
19.3: Regulation of Oxidative Phosphorylation
- Page ID
- 15041


\( \newcommand{\vecs}[1]{\overset { \scriptstyle \rightharpoonup} {\mathbf{#1}} } \)
\( \newcommand{\vecd}[1]{\overset{-\!-\!\rightharpoonup}{\vphantom{a}\smash {#1}}} \)
\( \newcommand{\id}{\mathrm{id}}\) \( \newcommand{\Span}{\mathrm{span}}\)
( \newcommand{\kernel}{\mathrm{null}\,}\) \( \newcommand{\range}{\mathrm{range}\,}\)
\( \newcommand{\RealPart}{\mathrm{Re}}\) \( \newcommand{\ImaginaryPart}{\mathrm{Im}}\)
\( \newcommand{\Argument}{\mathrm{Arg}}\) \( \newcommand{\norm}[1]{\| #1 \|}\)
\( \newcommand{\inner}[2]{\langle #1, #2 \rangle}\)
\( \newcommand{\Span}{\mathrm{span}}\)
\( \newcommand{\id}{\mathrm{id}}\)
\( \newcommand{\Span}{\mathrm{span}}\)
\( \newcommand{\kernel}{\mathrm{null}\,}\)
\( \newcommand{\range}{\mathrm{range}\,}\)
\( \newcommand{\RealPart}{\mathrm{Re}}\)
\( \newcommand{\ImaginaryPart}{\mathrm{Im}}\)
\( \newcommand{\Argument}{\mathrm{Arg}}\)
\( \newcommand{\norm}[1]{\| #1 \|}\)
\( \newcommand{\inner}[2]{\langle #1, #2 \rangle}\)
\( \newcommand{\Span}{\mathrm{span}}\) \( \newcommand{\AA}{\unicode[.8,0]{x212B}}\)
\( \newcommand{\vectorA}[1]{\vec{#1}} % arrow\)
\( \newcommand{\vectorAt}[1]{\vec{\text{#1}}} % arrow\)
\( \newcommand{\vectorB}[1]{\overset { \scriptstyle \rightharpoonup} {\mathbf{#1}} } \)
\( \newcommand{\vectorC}[1]{\textbf{#1}} \)
\( \newcommand{\vectorD}[1]{\overrightarrow{#1}} \)
\( \newcommand{\vectorDt}[1]{\overrightarrow{\text{#1}}} \)
\( \newcommand{\vectE}[1]{\overset{-\!-\!\rightharpoonup}{\vphantom{a}\smash{\mathbf {#1}}}} \)
\( \newcommand{\vecs}[1]{\overset { \scriptstyle \rightharpoonup} {\mathbf{#1}} } \)
\( \newcommand{\vecd}[1]{\overset{-\!-\!\rightharpoonup}{\vphantom{a}\smash {#1}}} \)
Introduction
The main function of oxidative phosphorylation (oxphos) is to produce, under aerobic conditions, lots of ATP. It should make sense that to a first approximation, the regulation of oxphos depends primarily on the energy state of the cell, which is reflected by the ADP/ATP ratio. In contrast to glycolysis and the citric acid cycle, which produce NADH, the primary and first electron carrier in oxphos, the regulation does not depend on the binding of allosteric effectors to key enzymes in the pathway. Likewise, hormonal regulation is not involved. Perhaps this occurs since the oxphos pathway is downstream from the glycolytic and citric acid pathways, where allosteric and hormonal regulation robustly affects their outputs.
If you consider the primary reactants in electron transport to be NADH, FADH2, O2, ADP, and Pi and if you assume that O2 levels are constant, ADP appears to be the main molecule that determines the rate of the oxphos reactions. This is in accordance with what we have previously described: AMP, ADP, and ATP levels regulate many of the key enzymes in the glycolytic and citric acid pathways, as reviewed in Figure \(\PageIndex{1}\).

Figure \(\PageIndex{1}\): Regulation of glycolysis, the citric acid cycle, and oxphos by ATP, ADP, and AMP.
Overall there are several levels of oxphos regulation, which occurs at the level of the kinetics of the electron transport chain complexes, the efficiency of electron and proton transfer, the structure of the mitochondria, and mitochondria formation and their degradation.
Coupling and uncoupling of electron and proton transport
What is key is that the regulation of oxidation (electron transport) is coupled to the regulation of ATP synthesis (phosphorylation). These processes can also be uncoupled if electrons "leak" away from their transfer from NADH to O2, which leads to the production of harmful reactive oxygen species (ROS) such as superoxide. Proton can also "leak" away from the proton gradient if they bypass the ATP synthase complex and pass through the inner membrane with the help of specific carriers and protein uncouplers, as shown in Figure \(\PageIndex{2}\).

Figure \(\PageIndex{2}\): Coupling and uncoupling of oxidative phosphorylation. Eyenga, P.; Rey, B.; Eyenga, L.; Sheu, S.-S. Regulation of Oxidative Phosphorylation of Liver Mitochondria in Sepsis. Cells 2022, 11, 1598. https://doi.org/10.3390/cells11101598. Creative Commons Attribution License
The far right light green proton and the insert show the proton leak’s kinetics. The dotted line indicates the electron pathways.
There are two types of proton leaks:
- a basal leak through mitochondrial anion carriers in a non-regulated and minor process.
- an inducible leak through specific proteins, adenine nucleotide translocase (ANT), and uncoupling proteins (UCPs), which leads to loss of energy as heat. They can be activated by fatty acids as well as ROS. A particular UCP, UCP1, is found most abundantly in brown fat in mammals.
The basal leak occurs in the presence of inhibitors of ANT (carboxyatractylate) and UCP1 (GDP). It can be significant (about 25% of the resting metabolic rate of liver cells and up to 50% in respiring skeletal muscle cells). It is less understood than inducible leaks and does appear to be attributed to ANT in some fashion.
When oligomycin, which inhibits the collapse of the proton gradient through ATP synthase, is added to mitochondria, the proton gradient (protonmotive force, Δp) decreases. The rate of leakage increases exponentially with increasing Δp, so it represents non-Ohmic leakage. Ohmic leakage would give a linear dependence on Δp. This can be seen from a rearrangement of Ohm's Law (V=IR) to give I = V/R = conductance(V), where V is voltage, I is the current (analogous to the leak), R is resistance and 1/R is conductance. The exponentially increasing non-Ohmic leakage (usually measured by O2 uptake in the presence of oligomycin) shown in the inserted graph in Figure 2, is not associated with non-specific membrane damage.
A particular uncoupling membrane protein, UCP1, is especially prevalent in hibernators, small mammals, and human infants, which allows them to stay warm. The UCP family is activated by fatty acids, which may act as required cofactors for the protein or as antagonists of the inhibition of UCPs by nucleotide diphosphates.
Two methods are used to determine the efficiency of coupling of oxidation and phosphorylation.
- One is to determine the ADP/O ratio as both are substrates for oxphos, where O represents the amount of O2 consumed in the conversion of a defined amount of ADP to ATP when ADP is at high levels (which might not be physiologically relevant). This would give the maximum phosphorylation rate (defined as state 3).
- A second is to measure ATP (or ADP)/O ratio directly through methods that give spectrophotometric signals such as the production of NADH by a coupled hexokinase/glucose-6-phosphate dehydrogenase assay in which ATP is used in the following reactions to make NADH, as shown in Figure \(\PageIndex{3}\).

Figure \(\PageIndex{3}\): Generation of NADH on the combined reaction of hexokinase and glucose-6-phosphate dehydrogenase.
In this coupled assay, one ATP used produces one NADH, which absorbs at 340 nm. Also, the ATP used as a substrate in the coupled reaction has left the mitochondria for it to have access to hexokinase, so the internal ratios of ADP/ATP in the respiring mitochondria are unchanged during the time course of the reaction. This method also allows the measurement to be made under nonsaturating ADP concentrations.
Uncoupling of electron transport and ATP synthesis can occur through a combination of mechanisms, including proton loss at ANT and UCPs, at the complexes in electron transport that transport electrons and protons, and through ATP synthase itself.
Other mechanisms would include substrate depletion or effects on the mitochondrial permeability transition pore (mPTP), which is an inner membrane transmembrane protein, which is gated open by increases in matrix Ca2+, adenine nucleotide decreases and increases in Pi. It is also a voltage-gated channel. When open the mitochondrial membrane depolarizes, ATP is depleted and cell death can be triggered. We'll discuss this complex later.
Figure \(\PageIndex{4}\) shows the chemistry used to analyze the efficiency of oxphos and their graphical results.

Figure \(\PageIndex{4}\): Measurement of coupling efficiency in respiring mitochondria. Eyenga et al. Ibid.
Panel (A) shows the chemistry involved in the determination of the ATP/O ratio to measure coupling efficiency. Note that this step allows the regeneration of ADP and efficiency can be measured at any ADP concentration.
Panel (B) shows changes in O2 with time. The respiration rate is given by the slope of the curve. Until substrate is added, O2 levels are constant. On the addition of substrate, O2 is consumed in electron transport so levels O2 levels fall linearly. When ADP is added, the rate of O2 consumption increases which is reflected in a steady linear decline in O2 levels. This state which is at fixed ADP levels (as illustrated in Panel (A)), is called state 3 (maximum ATP synthesis at a given ADP level). When oligomycin, an inhibitor of proton flow across ATP synthase which inhibits ATP synthesis (and ADP use) is added, state 4 ensues with shows decreased O2 consumption when ATP synthesis is stopped. Note the parallel lines for stages 2 and 4. The Cytochrome c oxidase activity at the end of the curve is the maximal respiration with ascorbate (as an oxidizing agent) and N,N,N′N′-tetra methyl-p-phenylenediamine (TMPD) as a substrate.
Panel (C) shows a graph of the rate of ATP synthesis vs the rate of O2 consumption. The slope gives the rate of ATP generation to that of O2 consumption (ie. the ATP/O ratio). Note that the graph is linear:O is linear over a range of fixed, non-saturating ADP concentrations.
Changes in Proton Gradient from "Slippage"
Slippage in the electron transport chains: Redox Slipping
Proton translocation from the matrix to the inner membrane space is an integral part of the function and activity of the electron transport chains that establish the pH gradient and hence the Δp. These components are Complexes I, III, and IV. Complex IV (cytochrome C oxidase - CCO) appears to be especially important. Protons are removed by CCO from the matrix on the reduction of O2 to H2O. This requires exactly 4 electrons and 4 protons so the stoichiometry is fixed. Also, CCO moves protons into the inner membrane space in the formation of the pH gradient. This is where the electron-to-proton ratio may vary depending on redox and coupling conditions. Alterations in CCO or even decreases in its concentration would impact the movement of protons as well. Instead of calling these alterations in nominal proton translocation leakages, they are called slippage since an ordinary function of CCO is proton translocation. Slippages through CCO would decrease proton transport and decrease ATP/O. Reactive nitrogen species (NO and peroxynitrite) can also decrease ATP/O.
Slippage at ATP synthase
Proton leakage at ATP synthase would also result in a decreased ATP/O ratio. This occurs especially if nucleotides are low or if the holoenzyme is compromised by low subunit availability. ATP synthase forms dimers and other multimers to form supercomplexes, and this affects (or is determined by) the formation of invaginations in the inner membrane which form cristae.
Given that the multimeric c-ring of F0 effectively moves protons across the inner membrane, it is a likely source of slippage. It most likely occurs through a modified version of the F0 ATP synthase unit called the ATP synthase c-subunit leak channel (ACLC). This is different from the mitochondrial permeability transition pore (mPTP) mentioned above. Alternatively, it may be that the ACLC might be part of the leak channel of the mitochondrial permeability transition (MPT) pore discussed above. Studies show that the c-ring can form large conductance channels that are voltage-gated without regulatory subunits. In addition, added F1 subunit inhibits it. In neurons stimulated by the excitatory neurotransmitter glutamate, F1 dissociates from the F1F0 complex, allowing the c-ring to slip protons through the membrane. Finally knockdown of the c-subunit eliminates high conductance. Hence the c-ring is part of a type of mPT that is regulated by cyclophilin D (CypD), which is a mitochondrial peptidyl-prolyl cis-trans isomerase, that regulates the mitochondrial permeability transition pore (PTP).
In vitro, c-rings incorporated into vesicles form a large voltage-gated channel that is inactivated by the addition of F1. Also in neurons stimulated with the excitatory neurotransmitter glutamate, which leads to increases in cytoplasmic Ca2+, binding and ensuring conformational changes in the complex leads to dissociation of F1 from the complex, freeing F0 for proton "slippage" and transport uncoupled from ATP synthesis.
A Proposed “bent-pull-twist” model of ACLC gating in physiological and pathological conditions is shown in Figure \(\PageIndex{5}\).

Figure \(\PageIndex{5}\): Bent-pull-twist model of ACLC gating in physiological and pathological conditions. Mnatsakanyan, N., Park, HA., Wu, J. et al. Mitochondrial ATP synthase c-subunit leak channel triggers cell death upon loss of its F1 subcomplex. Cell Death Differ (2022). https://doi.org/10.1038/s41418-022-00972-7. Creative Commons Attribution 4.0 International License. http://creativecommons.org/licenses/by/4.0/.
Panel A shows c-ring diameter changes during the electrophysiology recordings, upon the application of voltage and F1. F1 added during c-ring recordings probably inactivates the channel due to the specific interactions between F1 and c-ring that induce twisting motions in c-subunit monomers in a clockwise direction, to stabilize the ring, reduce the pore diameter and close the channel.
Panel B shows reversible brief openings of ACLC in physiological conditions.
Panel C shows that non-reversible dissociation of F1 from FO occurs during long-lasting openings of the c-ring channel in severe pathology. For simplicity, only ATP synthase monomer is shown. ATP synthase subunits are drawn as ribbon representations (modified PDB ID code: 6J5I) [14]. In B and C, red arrows indicate the path of ion flow through the channel. Closed and open conformations of the channel are noted.
A closer look at uncoupler protein 1 (UCP1)
UCP1 is an inner membrane protein in the mitochondria that bypasses the movement of protons through the c-ring of F1. UCP1 is activated by fatty acids and inhibited by purine nucleotides. The mechanism of proton translocation is unclear. It could arise from a "handshake" of protons through a series of linked hydrogen bond donors and acceptors in the membrane protons. Evidence suggests that what moves are bound and protonated fatty acids which flip across the inner membrane where the carboxyl group deprotonates in the high pH matrix side of the membrane.
The role of UCP1 in this process could be to flip the deprotonated fatty acid back across the membrane. This model is called the protonophoretic model in which the fatty acid acts as a "protonophore" much like valinomycin, which transports K+ across the membrane and is called an ionophore. UCP1 doesn't interact with the H+ directly but just flips the deprotonated fatty acid back to continue the cycle. This model would give a stoichiometry of one flipped negatively charged fatty acid per proton transferred.
In the second "H+-shuttling" model, UCP1 is considered a fatty acid/H+ symporter (carries both species in the same direction). In this model, a fatty acid is strongly bound to UCP1 with the head group inside a cavity in the protein. Both models required UCP1 to carry deprotonated fatty acids back across the membrane.
The NMR structure of a similar protein, UCP2, is known. It can bind fatty acids with the acyl tail near the matrix side. However, UCP2 does not seem to be involved in thermogenesis and doesn't uncouple oxphos. It binds and catalyzes the exchange of malate, oxaloacetate, and aspartate for phosphate and H and hence has other metabolic roles. UCP 1 and 2 are about 60% homologous but have similar alpha-helical structures based on modeling.
Perturbation of NMR signals from assigned side chains was used to show the fatty acids bind to UCP1 and it's closer to the matrix than the inner membrane space. Two key lysines (K56 on helix 1 and K269 at the matrix side of helix 6) probably bind with the carboxylate end of the fatty acid. UCP1also has a hydrophobic grove (T31, F32, L34, D35, L278, G279, S280, W281, and V283) to accommodate the fatty acid. In addition, both UCP1 and UCP2 transport/flip alkyl sulfonates, analogs of fatty acids. This is consistent and required with both models.
Figure \(\PageIndex{6}\) shows an interactive iCn3D model of the predicted AlphaFold model of human UCP1 (P25874). The subunits are shown in the same color as Figure 1 above.
.png?revision=1&size=bestfit&width=272&height=369)
 Figure \(\PageIndex{6}\): Predicted AlphaFold model of human UCP1 (P25874). (Copyright; author via source). Click the image for a popup or use this external link: https://structure.ncbi.nlm.nih.gov/i...Qf8W1MgVH6u546
The blue colors represent assigned structures with the highest predicted confidence, and the red the lowest. The amino acid side chains that are implicated in binding to fatty acids based on perturbation of NMR signals on fatty acid binding (http://dx.doi.org/10.1016/j.str.2017.07.005) are shown in sticks, with CPK colors and labeled. The membrane would be positioned perpendicular to the average vertical orientation of the helices in the above orientation.
Additional Controls
From the perspective of moving electrons into the electron transport pathway, the key deliverers of electrons are NADH derived from integrated multiple pathways at Complex I (as illustrated in Figure 1) and FADH2 from the citric acid cycle at Complex II. Hence if intermediates in the citric acid cycle are low, the flux through electron transport is compromised. Flux through Complex I seems to determine the rate-limiting steps for oxygen use.
In the previous chapter section, we calculated the total chemical potential driving force across the membrane. A pH difference of 1.4 across the membrane provides a -1.9 kcal/mol (-8 kJ/mol) H+ chemical potential compared to the -3.23 kcal/mol (13.5 kJ/mol) from the transmembrane potential, Δψm. Both contribute to the thermodynamically favorable movement of H+ across the inner membrane in respiring mitochondria, but Δψm is a large contributor. Hence Δψm and ATP synthesis are also coupled with maximal synthesis occurring between -100 to -150 mV. At values around -200 mV, give rise to increased permeability for protons (which decreases Δp) but also the production of superoxide and peroxides. Hence Δψm is also regulated.
ADP levels control ATP synthesis as well, with higher concentrations leading to increased ATP synthesis and a decrease in Δp. Decreased ATP synthesis from increased Δp affects coupling, slippage in cytochrome C oxidase, and heat generation.
Reduction of O2 to water by stepwise addition of electrons involves the generation of superoxide, O2-. As shown in an earlier section, superoxide formed by Complex I would move to the matrix, while those formed by Complex III to both sides of the membrane. Hydrogen peroxide can also form from monoamine oxidase and α-ketoglutarate dehydrogenase, which produces increased peroxides with increasing NADH concentrations. Respiratory state 4 (when proton transport is blocked by oligomycin) leads to higher levels of ROS. Hence ROS levels are also determined by not only the respiratory state but also Δp.
Other control mechanisms are potentially derived from other protein subunits that bind to the complex within a lipid bilayer. These include A6L, DAPIT (diabetes-associated protein in insulin-sensitive tissues), and the proteolipid 6.8PL. Another is the ATPase inhibitory factor 1 (IF1), which turns out to be a significant regulator. When the Δψm falls too low, IF1 inhibits ATP depletion which leads to ATP hydrolysis by the complex to move protons from the matrix to the inner membrane space. The interaction of IF1 with ATP synthase is shown in Figure \(\PageIndex{7}\).

Figure \(\PageIndex{7}\): Structure of the bovine H+-ATP synthase and binding site of IF1. Esparza-Moltó, P.B., Nuevo-Tapioles, C. & Cuezva, J.M. Regulation of the H+-ATP synthase by IF1: a role in mitohormesis. Cell. Mol. Life Sci. 74, 2151–2166 (2017). https://doi.org/10.1007/s00018-017-2462-8. Creative Commons Attribution 4.0 International License (http://creativecommons.org/licenses/by/4.0/)
Panel (a) shows the soluble F1-ATPase domain composed by the 3α3β subassembly (salmon/red) and γ (dark blue), δ and ε (light blue) subunits, while the membrane-embedded Fo domain is formed by subunit a (red) and a ring of 8c subunits (light/dark blue). Both domains are linked together by a central stalk (γ, δ, ε subunits of the F1 domain) and a peripheral stalk (b, d F6, A6L, OSCP subunits, in orange). The 3D structure of the peripheral stalk is not fully resolved. Except for a and A6L subunits, the remainder is encoded in the nucleus. (model comprised of multiple PDB structures)
Panel (b) shows the lateral and basal view of the bovine F1 domain (α subunit is shown in salmon, β in red, and γ in blue) complexed with a fragment of IF1 (green). IF1 binds to the αβ interface through residues 1–37 and also contacts the γ subunit. (PDB: 1OHH)
IF1 has an intrinsically disordered N-terminal domain that binds to ATP synthase between the α and β subunits of the F1, where it adopts an alpha-helical conformation. It can dimerize through self-interactions with the C-terminal domain. Interestingly, bound IF1 inhibits both ATP synthesis and hydrolysis as well as H+ translocation through the complex. These activities are illustrated in Figure \(\PageIndex{8}\).

Figure \(\PageIndex{8}\): IF1 inhibits H+ translocation through the H+-ATP synthase in both synthetic and hydrolytic modes. Esparza-Moltó, ibid.
Panel (a) shows H+ uptake is induced by valinomycin-mediated K+ release from FoF1-K+ liposomes with the H+-ATP synthase functioning in the hydrolytic mode.
Panel (b) shows H+ release is induced by valinomycin-mediated K+ uptake in FoF1-K+ liposomes with the H+-ATP synthase functioning in the synthetic mode. The rates of H+ uptake (a) and H+ release (b) are reduced when the liposomes are incubated with increasing concentrations of isolated IF1. Black circle valinomycin.
Five key histidines in IF1 play a role in the inhibition of the ATPase activity and the oligomerization of IF1. When the pH gradient collapses, and the matrix becomes more acidic (as seen in hypoxia and ischemia), IF1 form dimers that inhibit ATP hydrolysis. At higher pHs, IF1 forms a dimer of IF1 dimers, or effectively a tetramer, which prevents its binding to ATP synthase and hence prevents the inhibition of ATP synthesis. An IF1-H49K mutant is an active inhibitor even at higher pHs. These properties are illustrated in Figure \(\PageIndex{9}\).

Figure \(\PageIndex{9}\): Post-translational regulation of IF1 activity. Esparza-Moltó, ibid.
IF1 inhibition of ATP hydrolysis is not only relieved by pH-dependent oligomerization as illustrated above, but also by phosphorylation by a mitochondrial Protein kinase A-like molecule, or by its interaction with yet another protein, BP. A conserved serine 39 is important in its inhibitory action. When dephosphorylated, IF1 binds to ATP synthase and inhibits both ATP synthesis and hydrolysis. When phosphorylated it can't bind and hence can't inhibit ATP synthase.
Mitochondria - Nuclear Signaling
We would be remiss to not include the role of the mitochondrial genome and its relationship to the nuclear genome in the control of mitochondrial function, including oxidative phosphorylation. Mitochondrial arose from the internalization of a distant bacteria into a eukaryotic cell. They developed an endosymbiotic relationship in which some of the genes from the original bacterial species remain in mitochondria today. The mitochondrial genome is shown in Figure \(\PageIndex{10}\).
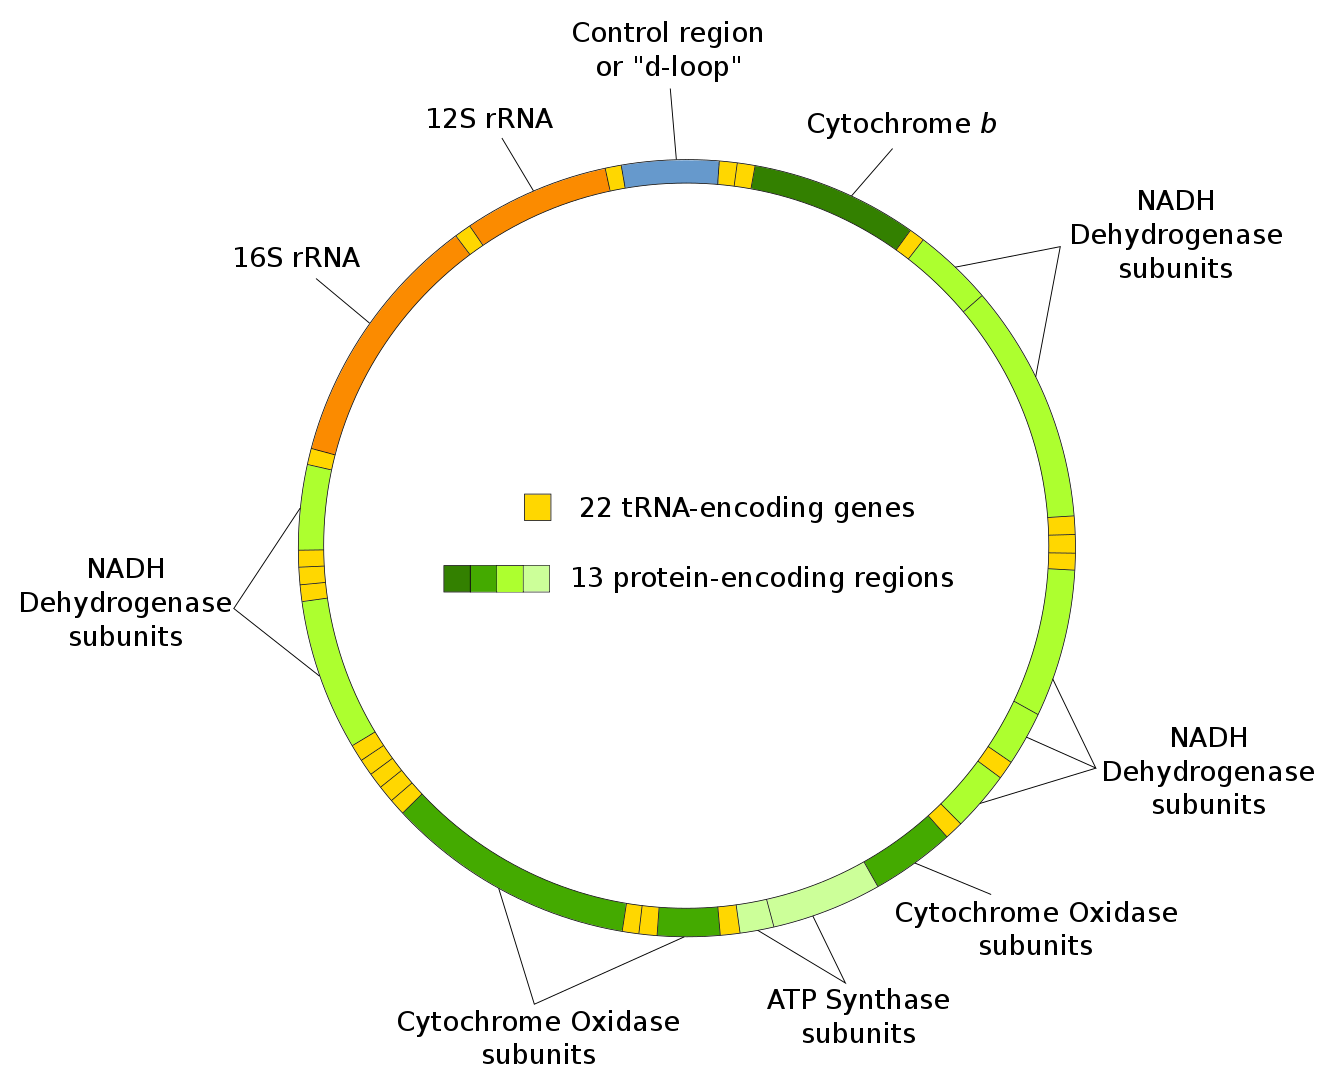
Figure \(\PageIndex{10}\): Mitochondrial genome. https://commons.wikimedia.org/wiki/C...ial_DNA_en.svg
Mitochondrial DNA is a double-stranded molecule of 16.5 kilobases. It encodes some proteins, as well as its own tRNA and ribosomal RNAs. There are many copies (100s to 1000s) of the circular genome in each cell.
Some (actually 13), but not all of the genes for proteins required for oxidative phosphorylation are found in the mitochondrial genome. The rest reside in the nuclear genome, and after transcription and translation, the resulting protein must be imported into mitochondria. In fact, over 95% of mitochondrial proteins are encoded by nuclear genes. Mitochondria move in the cells guided by the internal cytoskeleton to sites where energy (ATP) is needed. They also participate in buffering intracellular Ca2+ ions in the cell, much like the ER with which mitochondria form intimate membrane contacts. The ER also makes contact with the outer nuclear membrane, so, likely, the mitochondria can closely associate with the nucleus as well.
Hence there must be regulation of the respective genomes to produce the correct type and amounts of proteins required for oxidative phosphorylation. To accomplish this, there is a bidirectional regulated signaling between the two organelles. There is direct signaling between the nucleus and mitochondria and retrograde signaling in the other direction. Signals and processes affected in these signaling pathways are shown in Figure \(\PageIndex{10}\).

jdjkfj
Figure \(\PageIndex{11}\): Signaling from the mitochondria to the nucleus. Brittni R. Walker and Carlos T. Moraes. Biomolecules 2022, 12(3), 427; https://doi.org/10.3390/biom12030427. Creative Commons Attribution (CC BY) license (https://creativecommons.org/licenses/by/4.0/)
Signals originating from the mitochondria, including calcium, reactive oxygen species (ROS), and AMP/ATP, often stimulate pathways, leading to transcriptional changes in the nucleus. Nuclear responses can involve upregulating cell proliferation and anti-apoptotic factors, as well as proteins involved in mitogenesis, such as PGC-1α and nuclear-encoded mitochondrial proteins. The levels of other molecules, such as TCA intermediates Acetyl CoA and α-ketoglutarate, can influence the epigenome by modifying methylation and acetylation, and consequently, the cell physiology.
We've encountered several key enzymes involved in the regulation of metabolism, including:
- AMP-activated protein kinase (AMPK) senses the energy state (AMP/ATP ratio) of the cell. When ATP is low (AMP is high), it activates pathways to produce ATP and inhibits pathways that require ATP. AMPK has been found at or near the mitochondrial membrane and may also be found in it. AMPK also promotes mitochondrial biogenesis (mitogenesis)
- mTOR (mammalian target of rapamycin ) which is a serine/threonine kinase that regulates protein synthesis and other anabolic pathways based on the energy status of the cell. processes in response to growth factors, energy status, and oxygen levels. It also simulated mitogenesis.