
4.1.2: Evidence of Evolution
- Page ID
- 83832

Evidence of Evolution
- Please read and watch the following Mandatory Resources
- Reading the material for understanding, and taking notes during videos, will take approximately 2.5 hours.
- To navigate to the next section, use the Contents menu at the top of the page OR the right arrow on the side of the page.
- If on a mobile device, use the Contents menu at the top of the page OR the links at the bottom of the page.
- Explain how a variety of forms of evidence support the theory of evolution.
Evolution - It's a Thing
This 11-minute video describes the formation of fossils.
Question after watching: What were the forms of evidence highlighted that inform scientists about whale evolution?
Modern Studies of Darwin's Finches - Evidence of Natural Selection
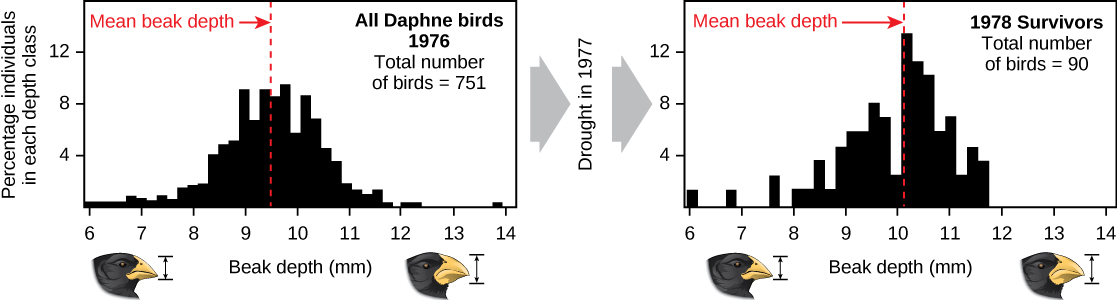
Scientific studies of evolution by natural selection can be time-consuming. One of the best demonstrations has been in the very birds that helped to inspire the theory, the Galápagos finches. Peter and Rosemary Grant and their colleagues have studied Galápagos finch populations every year since 1976 and have provided important demonstrations of the operation of natural selection. The Grants found changes from one generation to the next in the beak shapes of the medium ground finches on the Galápagos island of Daphne Major. The medium-ground finch feeds on seeds. The birds have inherited variations in the bill shape with some individuals having wide, deep bills and others having thinner bills. Large-billed birds feed more efficiently on large, hard seeds, whereas smaller-billed birds feed more efficiently on small, soft seeds.
During 1977, a drought period altered vegetation on the island. After this period, the number of seeds declined dramatically: the decline in small, soft seeds was greater than the decline in large, hard seeds. The large-billed birds were able to survive better than the small-billed birds the following year. The year following the drought when the Grants measured beak sizes in the much-reduced population, they found that the average bill size was larger (Figure \(\PageIndex{3}\)). This was clear evidence for natural selection (differences in survival) of bill size caused by the availability of seeds.
The Grants had studied the inheritance of bill sizes and knew that the surviving large-billed birds would tend to produce offspring with larger bills, so the selection would lead to evolution of bill size. Subsequent studies by the Grants have demonstrated selection on, and evolution of, bill size in this species in response to changing conditions on the island. The evolution has occurred both to larger bills, as in this case, and to smaller bills when large seeds became rare.
The Fossil Record as Evidence for Evolution
Fossils tell us when organisms lived, as well as provide evidence for the progression and evolution of life on earth over millions of years.
Fossils are preserved remains or traces of animals, plants, and other organisms from the past. Fossils range in age from 10,000 to 3.48 billion years old. The observation that certain fossils were associated with certain rock strata led 19th-century geologists to recognize a geological timescale. Like extant organisms, fossils vary in size from microscopic, like single-celled bacteria, to gigantic, like dinosaurs and trees.

Permineralization
Permineralization is a process of fossilization that occurs when an organism is buried. Small-scale permineralization can produce very detailed fossils. For permineralization to occur, the organism must be covered by sediment soon after death, or soon after the initial decay process.
It would not be an exaggeration to say that the typical vertebrate fossil consists of a single bone, or tooth, or fish scale. The preservation of an intact skeleton with the bones in the relative positions they had in life requires remarkable circumstances. The mineralization of soft parts is even less common and is seen only in exceptionally rare chemical and biological conditions.
Some of the best fossil beds in the world are located in Canada, due to the vast age of the rocks in the shield formations there. Alberta is well known for its T. rex, Albertasaurus, and Edmontonsaurus specimens. Fossils in the Burgess Shale, located between Alberta and British Columbia, date back even further to before the Cambrian Explosion more than 550 million years ago.
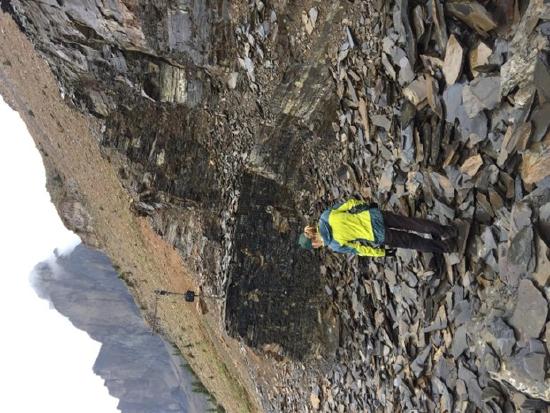
a
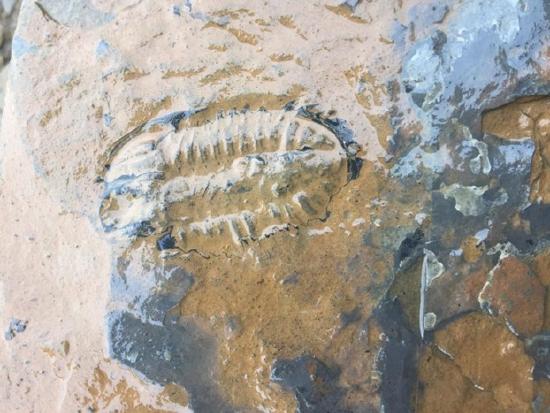
b
This 4-minute video humorously describes the formation of fossils.
Question after watching: If you were a paleontologist, where would you go to look for a fossil?
Trace Fossils
Fossils may also consist of the marks left behind by the organism while it was alive, such as footprints or feces. These types of fossils are called trace fossils, or ichnofossils, as opposed to body fossils. Past life may also leave some markers that cannot be seen but can be detected in the form of biochemical signals; these are known as chemofossils or biomarkers.
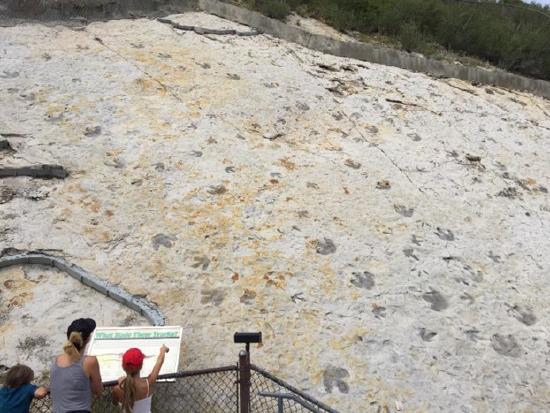
Figure \(\PageIndex{4}\): These dinosaur footprints, examples of trace fossils, are located in Denver, Colorado's Dino Ridge. Similar footprints can be seen in Grande Prarie in Northern Alberta and Northern British Columbia (CC-BY-SA 4.0 Annie Prud'homme Genereux).
The Fossil Record
The totality of fossils, both discovered and undiscovered, and their placement in fossiliferous (fossil-containing) rock formations and sedimentary layers (strata) is known as the fossil record. The fossil record was one of the early sources of data underlying the study of evolution and continues to be relevant to the history of life on Earth. The development of radiometric dating techniques in the early 20th-century allowed geologists to determine the numerical or “absolute” age of various strata and their included fossils.
Each fossil discovery represents a snapshot of the process of evolution. Because of the specialized and rare conditions required for a biological structure to fossilize, many important species or groups may never leave fossils at all. Even if they do leave fossils, humans may never find them—for example, if they are buried under hundreds of feet of ice in Antarctica. The number of species discovered through the fossil record is less than 5% of the number of species alive today. Fossilized species may represent less than 1% of all the species that have ever lived.
The fossil record is very uneven and is mostly comprised of fossils of organisms with hard body parts, leaving most groups of soft-bodied organisms with little to no fossil record. Groups considered to have a good fossil record, including transitional fossils between these groups, are the vertebrates, the echinoderms, the brachiopods, and some groups of arthropods. Their hard bones and shells fossilize easily, unlike the bodies of organisms like cephalopods or jellyfish.
Romer’s gap is an example of an apparent gap in the tetrapod fossil record used in the study of evolutionary biology. These gaps represent periods from which no relevant fossils have been found. Romer’s gap is named after paleontologist Alfred Romer, who first recognized it. Romer’s gap spanned from approximately 360 to 345 million years ago, corresponding to the first 15 million years of the Carboniferous Period. There has been much debate over why there are so few fossils from this time period. Some scientists have suggested that the geochemistry of the time period caused bad conditions for fossil formation, so few organisms were fossilized. Another hypothesis suggests that scientists have simply not yet discovered an excavation site for these fossils, due to inaccessibility or random chance.

Determining Fossil Ages
Paleontology seeks to map out how life evolved across geologic time. A substantial hurdle is in the difficulty of working out fossil ages. There are several different methods for estimating the ages of fossils, including:
- stratigraphy
- biostratigraphy
- carbon dating
Stratigraphy
Paleontologists rely on stratigraphy to date fossils. Stratigraphy is the science of understanding the strata, or layers, that form the sedimentary record. Strata are differentiated from each other by their different colors or compositions and are exposed in cliffs, quarries, and river banks. These rocks normally form relatively horizontal, parallel layers, with younger layers forming on top.
If a fossil is found between two layers of rock whose ages are known, the fossil’s age is thought to be between those two known ages. Because rock sequences are not continuous but may be broken up by faults or periods of erosion, it is difficult to match up rock beds that are not directly adjacent.

Biostratigraphy
Fossils of species that survived for a relatively short time can be used to match isolated rocks: this technique is called biostratigraphy. For instance, the extinct chordate Eoplacognathus pseudoplanus is thought to have existed for a short time in the Middle Ordovician period. If rocks of unknown age have traces of E. pseudoplanus, they have a mid-Ordovician age. Such index fossils must be distinctive, globally distributed, and occupy a short time range to be useful. Misleading results can occur if the index fossils are incorrectly dated.
Relative Dating
Stratigraphy and biostratigraphy can in general provide only relative dating (A was before B), which is often sufficient for studying evolution. This is difficult for some time periods, however, because of the barriers involved in matching rocks of the same age across continents. Family-tree relationships can help to narrow down the date when lineages first appeared. For example, if fossils of B date to X million years ago and the calculated “family tree” says A was an ancestor of B, then A must have evolved earlier.
It is also possible to estimate how long ago two living branches of a family tree diverged by assuming that DNA mutations accumulate at a constant rate. However, these “molecular clocks” are sometimes inaccurate and provide only approximate timing. For example, they are not sufficiently precise and reliable for estimating when the groups that feature in the Cambrian explosion first evolved, and estimates produced by different approaches to this method may vary as well.
Carbon Dating
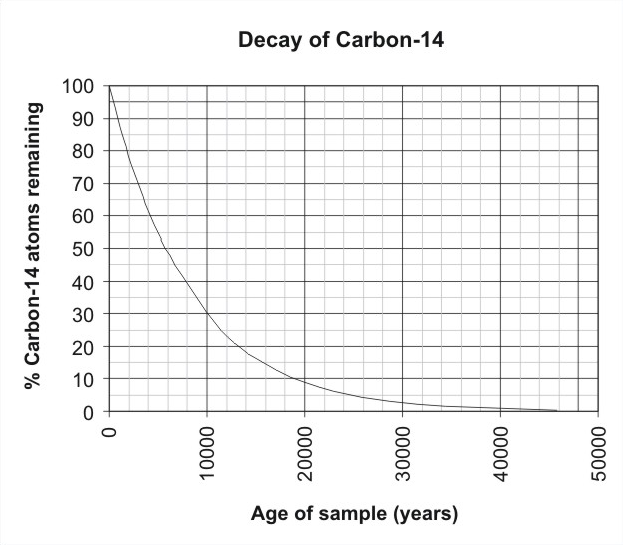
Together with stratigraphic principles, radioactive elements are used in geochronology to establish the geological time scale. Beds that preserve fossils typically lack these traditional radioactive elements. Instead, radiocarbon dating, or simply “carbon dating”, is used Figure \(\PageIndex{7}\). The principle of radiocarbon dating is simple: the rates at which various radioactive elements decay are known, and the ratio of the radioactive element to its decay products shows how long the radioactive element has existed in the rock. This rate is represented by the half-life, which is the time it takes for half of a sample to decay.
The half-life of carbon-14 is 5,730 years, so carbon dating is only relevant for dating fossils less than 60,000 years old. Radioactive elements are common only in rocks with a volcanic origin, so the only fossil-bearing rocks that can be dated using traditional elements are volcanic ash layers. Carbon dating uses the decay of carbon-14 to estimate the age of organic materials, such as wood and leather.
Case Study: The Fossil Record and the Evolution of the Modern Horse
Highly detailed fossil records have been recovered for sequences in the evolution of modern horses. The fossil record of horses in North America is especially rich and contains transition fossils: fossils that show intermediate stages between earlier and later forms. The fossil record extends back to a dog-like ancestor some 55 million years ago, which gave rise to the first horse-like species 55 to 42 million years ago in the genus Eohippus.
The first Equid fossil was found in the gypsum quarries in Montmartre, Paris in the 1820s. The tooth was sent to the Paris Conservatory, where Georges Cuvier identified it as browsing equine, related to the tapir. His sketch of the entire animal matched later skeletons found at the site. During the H.M.S. Beagle survey expedition, Charles Darwin had remarkable success with fossil hunting in Patagonia. In 1833 in Santa Fe, Argentina, he was “filled with astonishment” when he found a horse’s tooth in the same stratum as fossils of giant armadillos and wondered if it might have been washed down from a later layer, but concluded this was “not very probable.” In 1836, the anatomist Richard Owen confirmed the tooth was from an extinct species, which he subsequently named Equus curvidens.
The original sequence of species believed to have evolved into the horse was based on fossils discovered in North America in the 1870s by paleontologist Othniel Charles Marsh. The sequence, from Eohippus to the modern horse (Equus), was popularized by Thomas Huxley and became one of the most widely known examples of a clear evolutionary progression. The sequence of transitional fossils was assembled by the American Museum of Natural History into an exhibit that emphasized the gradual, “straight-line” evolution of the horse.
This video explains how fossils show dramatic changes in horse morphology over nearly 60 million years of evolution.

Since then, as the number of Equid fossils has increased, the actual evolutionary progression from Eohippus to Equus has been discovered to be much more complex and multi-branched than was initially supposed. Detailed fossil information on the rate and distribution of new Equid species has also revealed that the progression between species was not as smooth and consistent as was once believed.
Although some transitions were indeed gradual progressions, a number of others were relatively abrupt in geologic time, taking place over only a few million years. Both anagenesis, a gradual change in an entire population's gene frequency, and cladogenesis, a population “splitting” into two distinct evolutionary branches, occurred, and many species coexisted with “ancestor” species at various times.
Adaptation for Grazing
The series of fossils tracks the change in anatomy resulting from a gradual drying trend that changed the landscape from a forested habitat to a prairie habitat. Early horse ancestors were originally specialized for tropical forests, while modern horses are now adapted to life on drier land. Successive fossils show the evolution of teeth shapes and foot and leg anatomy to a grazing habit with adaptations for escaping predators.
The horse belongs to the order Perissodactyla (odd-toed ungulates), the members of which all share hoofed feet and an odd number of toes on each foot, as well as mobile upper lips and a similar tooth structure. This means that horses share a common ancestry with tapirs and rhinoceroses. Later species showed gains in size, such as those of Hipparion, which existed from about 23 to 2 million years ago. The fossil record shows several adaptive radiations, or periods of cladogenesis, in the horse lineage, which is now much reduced to only one genus, Equus, with several species. Paleozoologists have been able to piece together a more complete outline of the modern horse’s evolutionary lineage than that of any other animal.
Additional Evidence for Evolution
Homologous Structures vs Analogous Structures
Homology is the relationship between structures or DNA derived from the most recent common ancestor. A common example of homologous structures in evolutionary biology is the wings of bats and the arms of primates. Although these two structures do not look similar or have the same function, genetically, they come from the same structure from the last common ancestor. Homologous traits of organisms are therefore explained by descent from a common ancestor. In genetics, homology is measured by comparing protein or DNA sequences. Homologous gene sequences share a high similarity, supporting the hypothesis that they share a common ancestor. It’s important to note that defining two structures or sequences as homologous depends on what ancestor is being described as the common ancestor.
Homology can also be partial: new structures can evolve through the combination of developmental pathways or parts of them. As a result, hybrid or mosaic structures can evolve that exhibit partial homologies. For example, certain compound leaves of flowering plants are partially homologous both to leaves and shoots because they combine some traits of leaves and some of shoots.

The opposite of homologous structures is analogous structures, which are physically similar structures between two taxa that evolved separately (rather than being present in the last common ancestor). Bat wings and bird wings evolved independently and are considered analogous structures. Genetically, a bat wing and a bird wing have very little in common; the last common ancestor of bats and birds did not have wings like either bats or birds. Wings evolved independently in each lineage after diverging from ancestors with forelimbs that were not used as wings (terrestrial mammals and theropod dinosaurs, respectively).
It is important to distinguish between different hierarchical levels of homology in order to make informative biological comparisons. In the above example, the bird and bat wings are analogous as wings, but homologous as forelimbs because the organ served as a forearm (not a wing) in the last common ancestor of tetrapods.
Analogy is different than homology. Although analogous characteristics are superficially similar, they are not homologous because they are phylogenetically independent. The wings of a maple seed and the wings of an albatross are analogous but not homologous (they both allow the organism to travel on the wind, but they did not both develop from the same structure).

Vestigial Structures
Some organisms possess structures with no apparent function which appear to be residual parts from a past ancestor. For example, some snakes have pelvic bones despite having no legs because they descended from reptiles that did have legs. Another example of a structure with no function is the human vermiform appendix. These unused structures without function are called vestigial structures. Other examples of vestigial structures are wings (which may have other functions) on flightless birds like the ostrich, leaves on some cacti, traces of pelvic bones in whales, and the sightless eyes of cave animals.

There are also several reflexes and behaviors that are considered to be vestigial. The formation of goosebumps in humans under stress is a vestigial reflex its function in human ancestors was to raise the body’s hair, making the ancestor appear larger and scaring off predators. The arrector pili muscle, which is a band of smooth muscle that connects the hair follicle to connective tissue. When it contracts it creates goosebumps on the skin.
Vestigial Structures in Evolution
Vestigial structures are often homologous to structures that function normally in other species. Therefore, vestigial structures can be considered evidence for evolution, the process by which beneficial heritable traits arise in populations over an extended period of time. The existence of vestigial traits can be attributed to changes in the environment and behavior patterns of the organism in question. As the function of the trait is no longer beneficial for survival, the likelihood that future offspring will inherit the “normal” form of it decreases. If there are no selection pressures actively lowering the fitness of the individual, the trait will persist in future generations unless the trait is eliminated through genetic drift or other random events.

In some cases, the structure becomes detrimental to the organism. Although in many cases the vestigial structure is of no direct harm, all structures require extra energy in terms of development, maintenance, and weight and are also a risk in terms of disease (e.g., infection, cancer). This provides some selective pressure for the removal of parts that do not contribute to an organism’s fitness, but a structure that is not directly harmful will take longer to be ‘phased out’ than one that is. Some vestigial structures persist due to limitations in development, such that complete loss of the structure could not occur without major alterations of the organism’s developmental pattern, and such alterations would likely produce numerous negative side effects.
The vestigial versions of a structure can be compared to the original version of the structure in other species in order to determine the homology of the structure. Homologous structures indicate common ancestry with those organisms that have a functional version of the structure. Vestigial traits can still be considered adaptations because an adaptation is often defined as a trait that has been favored by natural selection. Adaptations, therefore, need not be adaptive, as long as they were at some point.
This 4-minute video takes you on a tour of vestigial structures in the human body.
Question after watching: We say that vestigial structures are evidence for evolution. Why is that? What could account for these structures if evolution was not the reason?
Convergent Evolution
Sometimes, similar phenotypes evolve independently in distantly related species. For example, flight has evolved in both bats and insects, and they both have wings, which are adaptations to flight. However, the wings of bats and insects have evolved from very different original structures. This phenomenon is called convergent evolution, where similar traits evolve independently in species that do not share a recent common ancestry.
Examples of Convergent Evolution
Convergent evolution describes the independent evolution of similar features in species of different lineages. The two species came to the same function, flying, but did so separately from each other. They have “converged” on this useful trait. Both sharks and dolphins have similar body forms, yet are only distantly related: sharks are fish and dolphins are mammals. Such similarities are a result of both populations being exposed to the same selective pressures. Within both groups, changes that aid swimming have been favored. Thus, over time, they developed similar appearances (morphology), even though they are not closely related.
One of the most well-known examples of convergent evolution is the camera eye of cephalopods (e.g., octopus), vertebrates (e.g., mammals), and cnidaria (e.g., box jellies). Their last common ancestor had at most a very simple photoreceptive spot, but a range of processes led to the progressive refinement of this structure to the advanced camera eye. There is, however, one subtle difference: the cephalopod eye is “wired” in the opposite direction, with blood and nerve vessels entering from the back of the retina, rather than the front as in vertebrates.

The opposite of convergent evolution is divergent evolution, whereby related species evolve different traits. On a molecular level, this can happen due to random mutation unrelated to adaptive changes. More will be discussed on divergent evolution in Unit 2.3.
Biogeography and the Modern Distribution of Species
Biogeography is the study of the geographic distribution of living things and the abiotic factors that affect their distribution. Abiotic factors, such as temperature and rainfall, vary based on latitude and elevation, primarily. As these abiotic factors change, the composition of plant and animal communities also changes.
Patterns of Species Distribution
Ecologists who study biogeography examine patterns of species distribution. No species exists everywhere; for example, the Venus flytrap is endemic to a small area in North and South Carolina. An endemic species is one that is naturally found only in a specific geographic area that is usually restricted in size. Other species are cosmopolitan: species that live in a wide variety of geographic areas. The raccoon, for example, is native to most of North and Central America.
Since species distribution patterns are based on biotic and abiotic factors and their influences during the very long periods of time required for species evolution, early studies of biogeography were closely linked to the emergence of evolutionary thinking in the eighteenth century. Some of the most distinctive assemblages of plants and animals occur in regions that have been physically separated for millions of years by geographic barriers. Biologists estimate that Australia, for example, has between 600,000 and 700,000 species of plants and animals. Approximately 3/4 of living plant and mammal species are endemic species found solely in Australia.

The geographic distribution of organisms on the planet follows patterns that are best explained by evolution in conjunction with the movement of tectonic plates over geological time. Broad groups that evolved before the breakup of the supercontinent Pangaea (about 200 million years ago) are distributed worldwide. Groups that evolved since the breakup appear uniquely in regions of the planet, such as the unique flora and fauna of northern continents that formed from the supercontinent Laurasia and of the southern continents that formed from the supercontinent Gondwana. The presence of Glossopteris in Australia, Antarctica, India, Africa, and South America is best explained by the plant family’s presence there prior to the southern supercontinent Gondwana breaking up.
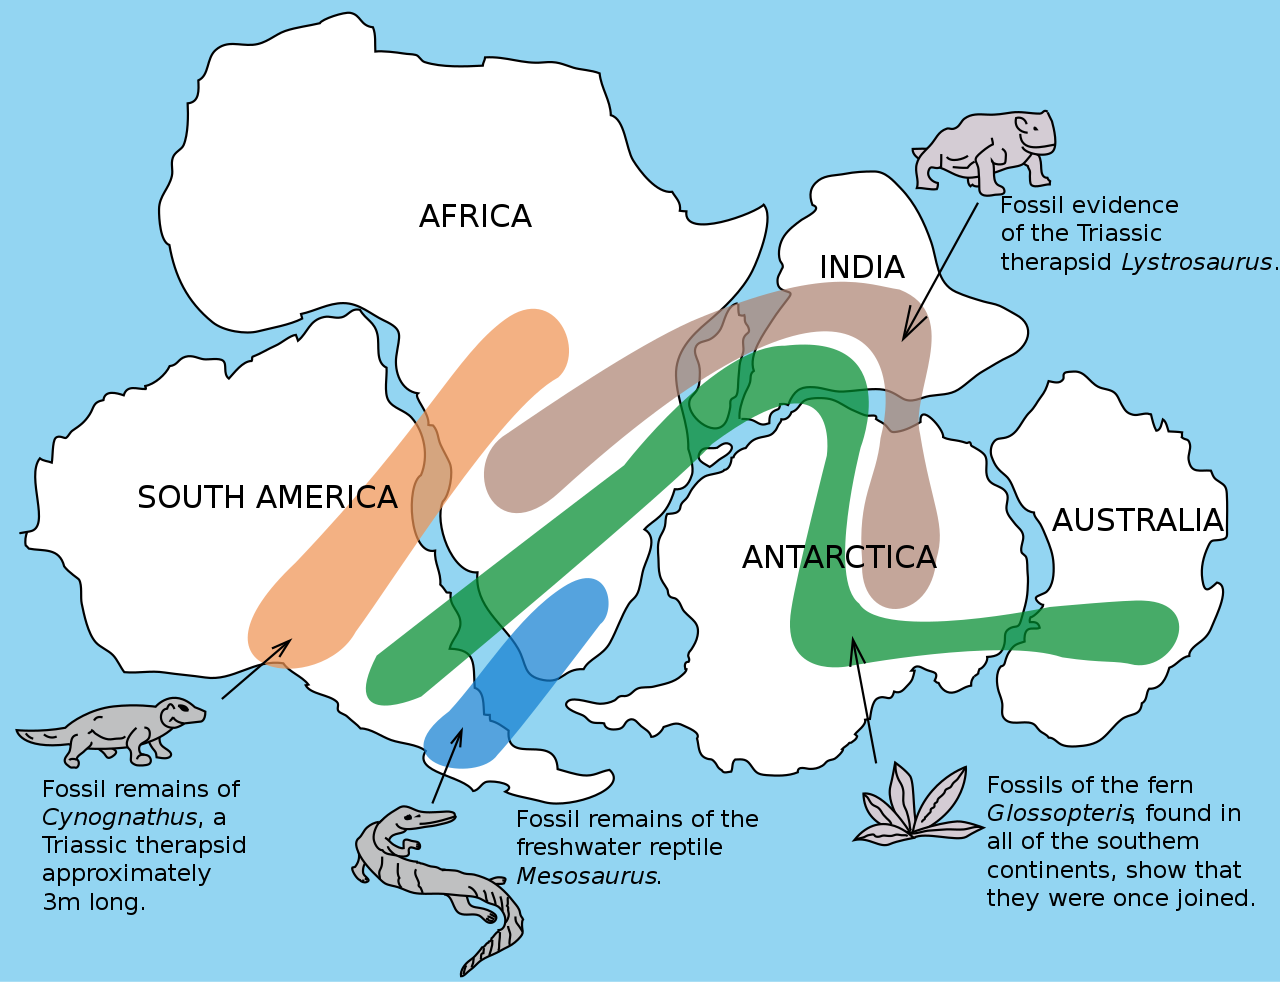
Figure \(\PageIndex{15}\): The Glossopteris genus of ferns evolved before the supercontinent Gondwana broke up. Today, members of this plant family are found throughout the southern hemisphere (shown in green).
Artificial Selection: Human-Initiated Change
Most contemporary evolutionary biologists study evolution experimentally using laboratory organisms such as Drosophila or natural systems in the wild. However, 18th- and 19th-century evolutionary biologists, including Darwin, emphasized the similarities between natural evolution and artificial ‘ improvement’ of livestock under domestication. They believed that studying domesticated animals and plants could illuminate the mechanisms of natural evolution. Indeed, Chapter 1 of On the Origin of Species… is entitled ‘Variation under domestication’. Recent discoveries reveal the relationship between natural evolutionary mechanisms and the practical technologies used to breed plants, animals, yeasts, and microbes, to produce food, clothing, transport, companionship, decoration, entertainment, and medicines.
Artificial selection is any selective breeding intentionally practiced by humans leading to the evolution of domesticated organisms. Artificial selection may oppose or amplify or be neutral in relation to natural selection. Most livestock, including dogs, cats, goats, pigs, cattle, sheep, guinea pigs, horses, geese, poultry, and scores of crop plants were domesticated more than 5000 years ago. Estimates of dates of domestication based upon the archeological record differ enormously from those based on genetic analysis for almost all crops and livestock. However, experts agree that dogs were among the first mammalian species to become domesticated, followed by sheep. During the last few hundred years, people have domesticated a wide range of other animals such as guppies, hamsters, mice, and budgerigars, mostly for use as pets, together with thousands of culinary, medicinal, and ornamental plants.
Domesticated animals are usually held in small, isolated populations with limited opportunities for interbreeding. For centuries, drovers herded large numbers of non-breeding pigs, cattle, sheep, geese, and poultry to market for slaughter, often over hundreds of kilometers. However, the breeding stocks were usually kept within a small area because moving sexually active bulls and large boars over long distances was much less practical. It is important to note that true domestication is different from the taming of wild animals. Certain individuals of many species, especially juveniles and females, can be tamed and live in captivity where they are protected from predators and provided with food and shelter. Domesticated livestock are also fed and protected, but many generations breed and spend their entire lives in close association with humans.
For centuries, livestock breeders have nurtured strains of animals that thrive on various diets or in particular climates or that excel in certain roles. Sometimes, domestication was simply due to the whims of the breeder. The variety of such animals seems bewildering but certain changes consistently emerge in a surprisingly wide range of domesticated species and among humans, suggesting that similar mechanisms are operating.
This 5-minute video explains the current hypothesis for the origins of the modern dog.
Question after watching: Human-initiated selection is a large influence on the evolution of modern dogs. What role did natural selection also play?
This 6-minute video describes how broccoli, cabbage, and kohlrabi are all varieties of the same species.
Question after watching: You go to the garden centre and obtain a few strawberry plants. You want to breed the sweetest berries. How would you go about obtaining such a berry? Link each step to a similar step in the process of natural selection.
Parts adapted from ("Evolution: artificial selection and domestication"; CC BY-NC-SA 2.0 UK)