
3.2: Protein Purification
- Page ID
- 102250


\( \newcommand{\vecs}[1]{\overset { \scriptstyle \rightharpoonup} {\mathbf{#1}} } \)
\( \newcommand{\vecd}[1]{\overset{-\!-\!\rightharpoonup}{\vphantom{a}\smash {#1}}} \)
\( \newcommand{\dsum}{\displaystyle\sum\limits} \)
\( \newcommand{\dint}{\displaystyle\int\limits} \)
\( \newcommand{\dlim}{\displaystyle\lim\limits} \)
\( \newcommand{\id}{\mathrm{id}}\) \( \newcommand{\Span}{\mathrm{span}}\)
( \newcommand{\kernel}{\mathrm{null}\,}\) \( \newcommand{\range}{\mathrm{range}\,}\)
\( \newcommand{\RealPart}{\mathrm{Re}}\) \( \newcommand{\ImaginaryPart}{\mathrm{Im}}\)
\( \newcommand{\Argument}{\mathrm{Arg}}\) \( \newcommand{\norm}[1]{\| #1 \|}\)
\( \newcommand{\inner}[2]{\langle #1, #2 \rangle}\)
\( \newcommand{\Span}{\mathrm{span}}\)
\( \newcommand{\id}{\mathrm{id}}\)
\( \newcommand{\Span}{\mathrm{span}}\)
\( \newcommand{\kernel}{\mathrm{null}\,}\)
\( \newcommand{\range}{\mathrm{range}\,}\)
\( \newcommand{\RealPart}{\mathrm{Re}}\)
\( \newcommand{\ImaginaryPart}{\mathrm{Im}}\)
\( \newcommand{\Argument}{\mathrm{Arg}}\)
\( \newcommand{\norm}[1]{\| #1 \|}\)
\( \newcommand{\inner}[2]{\langle #1, #2 \rangle}\)
\( \newcommand{\Span}{\mathrm{span}}\) \( \newcommand{\AA}{\unicode[.8,0]{x212B}}\)
\( \newcommand{\vectorA}[1]{\vec{#1}} % arrow\)
\( \newcommand{\vectorAt}[1]{\vec{\text{#1}}} % arrow\)
\( \newcommand{\vectorB}[1]{\overset { \scriptstyle \rightharpoonup} {\mathbf{#1}} } \)
\( \newcommand{\vectorC}[1]{\textbf{#1}} \)
\( \newcommand{\vectorD}[1]{\overrightarrow{#1}} \)
\( \newcommand{\vectorDt}[1]{\overrightarrow{\text{#1}}} \)
\( \newcommand{\vectE}[1]{\overset{-\!-\!\rightharpoonup}{\vphantom{a}\smash{\mathbf {#1}}}} \)
\( \newcommand{\vecs}[1]{\overset { \scriptstyle \rightharpoonup} {\mathbf{#1}} } \)
\(\newcommand{\longvect}{\overrightarrow}\)
\( \newcommand{\vecd}[1]{\overset{-\!-\!\rightharpoonup}{\vphantom{a}\smash {#1}}} \)
\(\newcommand{\avec}{\mathbf a}\) \(\newcommand{\bvec}{\mathbf b}\) \(\newcommand{\cvec}{\mathbf c}\) \(\newcommand{\dvec}{\mathbf d}\) \(\newcommand{\dtil}{\widetilde{\mathbf d}}\) \(\newcommand{\evec}{\mathbf e}\) \(\newcommand{\fvec}{\mathbf f}\) \(\newcommand{\nvec}{\mathbf n}\) \(\newcommand{\pvec}{\mathbf p}\) \(\newcommand{\qvec}{\mathbf q}\) \(\newcommand{\svec}{\mathbf s}\) \(\newcommand{\tvec}{\mathbf t}\) \(\newcommand{\uvec}{\mathbf u}\) \(\newcommand{\vvec}{\mathbf v}\) \(\newcommand{\wvec}{\mathbf w}\) \(\newcommand{\xvec}{\mathbf x}\) \(\newcommand{\yvec}{\mathbf y}\) \(\newcommand{\zvec}{\mathbf z}\) \(\newcommand{\rvec}{\mathbf r}\) \(\newcommand{\mvec}{\mathbf m}\) \(\newcommand{\zerovec}{\mathbf 0}\) \(\newcommand{\onevec}{\mathbf 1}\) \(\newcommand{\real}{\mathbb R}\) \(\newcommand{\twovec}[2]{\left[\begin{array}{r}#1 \\ #2 \end{array}\right]}\) \(\newcommand{\ctwovec}[2]{\left[\begin{array}{c}#1 \\ #2 \end{array}\right]}\) \(\newcommand{\threevec}[3]{\left[\begin{array}{r}#1 \\ #2 \\ #3 \end{array}\right]}\) \(\newcommand{\cthreevec}[3]{\left[\begin{array}{c}#1 \\ #2 \\ #3 \end{array}\right]}\) \(\newcommand{\fourvec}[4]{\left[\begin{array}{r}#1 \\ #2 \\ #3 \\ #4 \end{array}\right]}\) \(\newcommand{\cfourvec}[4]{\left[\begin{array}{c}#1 \\ #2 \\ #3 \\ #4 \end{array}\right]}\) \(\newcommand{\fivevec}[5]{\left[\begin{array}{r}#1 \\ #2 \\ #3 \\ #4 \\ #5 \\ \end{array}\right]}\) \(\newcommand{\cfivevec}[5]{\left[\begin{array}{c}#1 \\ #2 \\ #3 \\ #4 \\ #5 \\ \end{array}\right]}\) \(\newcommand{\mattwo}[4]{\left[\begin{array}{rr}#1 \amp #2 \\ #3 \amp #4 \\ \end{array}\right]}\) \(\newcommand{\laspan}[1]{\text{Span}\{#1\}}\) \(\newcommand{\bcal}{\cal B}\) \(\newcommand{\ccal}{\cal C}\) \(\newcommand{\scal}{\cal S}\) \(\newcommand{\wcal}{\cal W}\) \(\newcommand{\ecal}{\cal E}\) \(\newcommand{\coords}[2]{\left\{#1\right\}_{#2}}\) \(\newcommand{\gray}[1]{\color{gray}{#1}}\) \(\newcommand{\lgray}[1]{\color{lightgray}{#1}}\) \(\newcommand{\rank}{\operatorname{rank}}\) \(\newcommand{\row}{\text{Row}}\) \(\newcommand{\col}{\text{Col}}\) \(\renewcommand{\row}{\text{Row}}\) \(\newcommand{\nul}{\text{Nul}}\) \(\newcommand{\var}{\text{Var}}\) \(\newcommand{\corr}{\text{corr}}\) \(\newcommand{\len}[1]{\left|#1\right|}\) \(\newcommand{\bbar}{\overline{\bvec}}\) \(\newcommand{\bhat}{\widehat{\bvec}}\) \(\newcommand{\bperp}{\bvec^\perp}\) \(\newcommand{\xhat}{\widehat{\xvec}}\) \(\newcommand{\vhat}{\widehat{\vvec}}\) \(\newcommand{\uhat}{\widehat{\uvec}}\) \(\newcommand{\what}{\widehat{\wvec}}\) \(\newcommand{\Sighat}{\widehat{\Sigma}}\) \(\newcommand{\lt}{<}\) \(\newcommand{\gt}{>}\) \(\newcommand{\amp}{&}\) \(\definecolor{fillinmathshade}{gray}{0.9}\)(Learning goals written by Claude, Sonnet 4.6, Anthropic)
Protein Purification Strategy and Quantitative Evaluation
- Explain the rationale for selecting cell disruption, centrifugation, ammonium sulfate precipitation, and dialysis as early-stage protein purification steps, and justify each choice in terms of the physical or chemical property being exploited.
- Calculate total protein, total activity, specific activity, percent yield, and fold purification at each step of a purification scheme, interpret trends in these parameters to assess the quality of each step, and explain why specific activity must rise while yield inevitably falls during successful purification.
Chromatographic Separation Methods
- Describe the molecular basis of separation for size exclusion, ion exchange, hydrophobic interaction, and affinity chromatography, predict the order of elution for proteins of differing size, charge, hydrophobicity, or binding affinity under each set of conditions, and select the most appropriate technique given a protein's known properties.
- Define void volume (V₀), total column volume (Vt), and elution volume (Ve) in size exclusion chromatography, explain the partition coefficient K and its dependence on both molecular size and Stokes radius, and predict how protein shape affects elution order independently of molecular weight.
- Explain the basis of affinity chromatography using both biological ligands and engineered protein tags (His₆, FLAG, HA, GST), describe how Ni-NTA resin chelates histidine imidazole groups through coordination chemistry, and outline how fusion protein tags facilitate protein purification and subcellular localization.
Electrophoretic Analysis of Proteins
- Derive the electrophoretic mobility equation U = Q/f from the balance of electrical and frictional forces on a charged particle, and explain why SDS-PAGE eliminates both charge and shape heterogeneity so that migration depends solely on molecular weight — enabling molecular weight determination by comparison to standards.
- Explain how the stacking gel/running gel discontinuous system concentrates proteins into sharp bands before separation, and describe how acrylamide concentration, crosslinking density, and pore size collectively determine sieving efficiency and resolution.
- Compare and contrast native PAGE, SDS-PAGE, isoelectric focusing, 2D electrophoresis, and Western blotting in terms of the protein property being exploited, the information obtained, and the appropriate application — including the use of antibody-based detection for identifying specific proteins in complex mixtures.
A protein or other biological macromolecule must be purified before being rigorously studied structurally and functionally. Purifying a single protein from a mixture of as many as 10,000 other cellular or tissue proteins, each containing the same 20 naturally occurring amino acids linked in different orders, is difficult. Proteins differ in size (how many amino acids), charge (how many positively and negatively charged amino acids), sequence, and presence of specific binding sites on the proteins. Any technique used to purify protein must be based on these inherent differences. Once the protein is purified, it must be analyzed by a spectral or electrophoretic technique.
Protein purification is a series of processes intended to isolate and purify a single protein or complex from cells, tissues, or whole organisms. Protein purification is vital for characterizing the function, structure, and interactions of the protein of interest. Separation steps usually exploit differences in protein size, physical-chemical properties, binding affinity, and biological activity.
Protein purification is either preparative or analytical. Preparative purifications aim to produce a relatively large quantity of purified proteins for subsequent use. Examples include the preparation of commercial products such as enzymes (e.g., lactase), nutritional proteins (e.g., soy protein isolate), and certain biopharmaceuticals (e.g., insulin). Many steps and quality control are required to remove other host proteins and biomolecules that could threaten the patient's health. Analytical purification yields a relatively small amount of protein for various research or analytical purposes, including identification, structural characterization, and studies of protein structure, post-translational modifications, and function.
The choice of a starting material is key to the design of a purification process. In plants or animals, a particular protein is usually not distributed uniformly throughout the organism; different organs or tissues have varying protein concentrations. Using tissues or organs with the highest concentration reduces the volume required to produce a given amount of purified protein. A protein of low abundance or high commercial value is often made using recombinant DNA technology. These techniques will be discussed in greater detail in Chapter 5.
Sample Processing
If the organism does not secrete the protein of interest into the surrounding solution, the first step of each purification process disrupts the cells that contain it. Depending on how fragile the protein is, one of several techniques could be used, including repeated freezing and thawing, sonication, homogenization by high pressure (French press), homogenization by grinding (bead mill), and permeabilization by detergents (e.g., Triton X-100) and/or enzymes (e.g., lysozyme). Finally, cell debris can be removed by centrifugation, leaving the proteins and other soluble compounds in the supernatant.
Proteases released during cell lysis cleave the proteins in the solution. As the protein of interest may be sensitive to proteolysis, it is important to proceed quickly and conduct many steps at low temperatures to reduce unwanted proteolysis. Alternatively, one or more protease inhibitors can be added to the lysis buffer immediately before cell disruption. Sometimes, it is also necessary to add DNase to reduce the viscosity of the cell lysate caused by a high DNA content.
Centrifugation
Centrifugation is a process that uses centrifugal force to separate mixtures of particles of varying masses or densities suspended in a liquid. When a vessel (typically a tube or bottle) containing a mixture of proteins or other particulate matter, such as bacterial cells, is rotated at high speeds, the inertia of each particle yields a force in the direction of the particle's velocity proportional to its mass. The tendency of a given particle to move through the liquid because of this force is offset by the resistance the fluid exerts on the particle. The net effect of "spinning" the sample in a centrifuge is that massive, small, and dense particles move outward faster than less massive particles or particles with more "drag" in the liquid. When suspensions of particles are "spun" in a centrifuge, a "pellet" may form at the bottom of the vessel, enriched for the most massive particles with low drag in the liquid.
Non-compacted particles remain mostly in the liquid "supernatant" and can be removed from the vessel, separating the supernatant from the pellet. The angular acceleration applied to the sample determines the centrifugation rate, typically measured in units of g, the gravitational constant. If samples are centrifuged long enough, the particles in the vessels will reach equilibrium, in which they accumulate at a point in the vessel where their buoyant density is balanced by centrifugal force. Such an "equilibrium" centrifugation can allow extensive particle purification.
In sucrose gradient centrifugation, a linear concentration gradient of sugar (typically sucrose, glycerol, or a silica-based density gradient medium, such as Percoll) is generated in a tube, with the highest concentration at the bottom and the lowest at the top. Percoll is a trademark owned by GE Healthcare companies. A protein sample is then layered on the gradient and spun at high speeds in an ultracentrifuge. This causes heavy macromolecules to migrate toward the bottom of the tube faster than lighter material. During centrifugation, in the absence of sucrose, as particles move farther from the center of rotation, they experience greater centrifugal force (the farther they move, the faster they move). However, the useful separation range within the vessel is restricted to a small observable window. A properly designed sucrose gradient will counteract the increasing centrifugal force so that the particles move proportionately to their time in the centrifugal field. After separating the protein/particles, the gradient is fractionated and collected. These are described in Figure \(\PageIndex{1}\).

Precipitation and Differential Solubilization
In bulk protein purification, precipitation is a common first step to isolate proteins using a salt such as ammonium sulfate (NH4)2SO4. Ammonium sulfate is often used because it is highly soluble in water, relatively temperature-insensitive, and typically not harmful to most proteins. Proteins are precipitated by (NH4)2SO4 in their native state, which is important if you need the protein for structure/function studies. Furthermore, dialysis can remove ammonium sulfate as described in Figure \(\PageIndex{2}\).
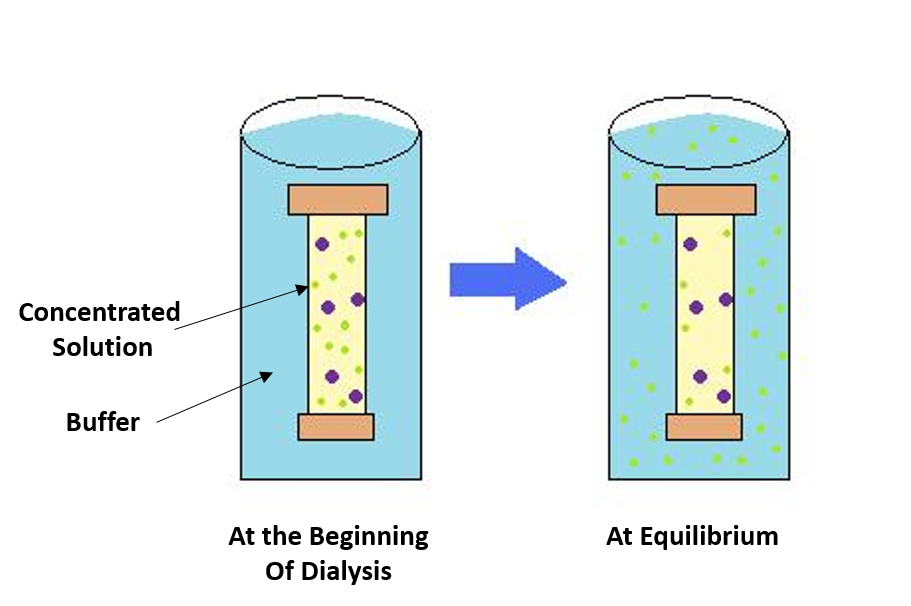
The process of dialysis separates dissolved molecules by their size. The biological sample is placed inside a closed membrane, where the protein of interest is too large to pass through the membrane's pores, whereas smaller ions can. As the solution reaches equilibrium, the ions become evenly distributed throughout the solution while the protein remains concentrated in the membrane. This reduces the suspension's overall salt concentration.
The mechanism underlying salt precipitation is quite complicated. High concentrations of sodium chloride don't precipitate protein. Other salts, such as guanidinium chloride, unfold proteins without causing precipitation. Salt ions interact with the protein and solvent water in somewhat complicated ways (which we will explore later). We will be satisfied with the empirical observation that ammonium sulfate is the salt of choice to precipitate and concentrate proteins from a solution. One advantage of (NH4)2SO4 protein precipitation from solution is that it can be performed inexpensively at large scale, making it useful early in protein purification. Different proteins precipitate at different (NH4)2SO4 concentrations, so differential precipitation is often used. (NH4)2SO4 concentrations are increased stepwise until the protein of interest is precipitated.
Some proteins are not soluble in water. These include transmembrane proteins that span cell membranes and large fibrous proteins. Membrane proteins can be solubilized by adding detergents such as sodium dodecyl sulfate (SDS), which unfolds the proteins, or octylglucoside or Triton X-100, which maintains protein structure.
Chromatography
Chromatography is used in almost all protein purification methods and is the key to separating a given protein from the 1000s of different proteins in cells and tissues. The separation of proteins on a chromatography column depends on the type of column and the chemical/physical properties of the molecule. There are four main types of chromatography used to separate proteins:
- size exclusion chromatography, in which proteins can be separated according to their size/shape or molecular weight
- ion exchange chromatography, in which proteins are separated by their charge/isoelectric point;
- hydrophobic interaction chromatography (similar to reverse-phase columns for purifying organic molecules), in which they are separated based on their relative hydrophobicity
- affinity chromatography, in which proteins are separated based on binding to a ligand covalently attached to a column bead.
The purification protocol generally contains one or more chromatographic steps for preparative protein purification. The basic procedure in chromatography is to flow the solution containing the protein through a column packed with a chromatography resin selected to separate proteins based on a specific property of the protein. Different proteins interact differently with the column material. They can thus be separated by the time required to pass the column or the conditions required to elute the protein from the column. Usually, proteins are detected as they elute from the column by measuring absorbance at 280 nm, where aromatic amino acids absorb.
Size Exclusion Chromatography (also known as Gel Filtration Chromatography)
This method separates proteins based on size and shape. The chromatography beads have tiny openings/pores into which proteins smaller than the pore diameter can enter. Large proteins that can't enter the pores flow around the beads and elute faster than small ones that enter the pores. They diffuse out of the pores and enter the rest of the moving solvent before getting "trapped" again for a short time in more pores. Eventually, they move through the column and elute at much higher volumes than larger proteins, which can't enter the pores. Thus, proteins will be separated based on size, as illustrated in Figure \(\PageIndex{3}\). The eluate is collected in sequential test tubes (or fractions). The figure below shows the pores as channels that go through the bead. The openings in resin beads should be considered tiny crevices and indentations, not channels.

Also known as gel filtration chromatography, it is a low-resolution isolation method involving beads with tiny “pores" that have a precise size distribution. The size is called an “exclusion limit," meaning molecules above a certain molecular weight will not fit into the tunnels. Molecules with sizes larger than the exclusion limit do not enter the tunnels and pass through the column relatively quickly by making their way between the beads. Smaller molecules, which can enter the tunnels, do so and, thus, have a longer path in passing through the column. Because of this, molecules larger than the exclusion limit will leave the column earlier, while smaller molecules that pass through the beads will elute from the column later. This method allows the separation of molecules based on their size.
In any chromatography system, there is a mobile and a stationary phase. In size-exclusion chromatography, the stationary phase is usually a polymerized agarose or acrylamide bead, which contains pores of various sizes filled with the solvent. Let's pretend that the solvent (typically an aqueous buffered solution) inside the bead is trapped there and doesn't exchange with the solvent moving around the bead, so it's part of the stationary phase. The mobile phase is the solvent used to elute the column, which flows around the bead. The chromatography beads are often supplied in a dried state, which must be rehydrated in the solvent before they are packed into the column. The volume of the agarose or acrylamide bead is very small compared to the volume of solution within its hydrated form.
Size and shape effects in size exclusion chromatography
Size-exclusion chromatography is so common that we will explore it in greater detail. Several different column volumes can be defined as shown in Figure \(\PageIndex{4}\), where the packed chromatography beads are shown as circles.

Figure \(\PageIndex{4}\): Define volumes in size exclusion chromatography
If we consider the beads' mass negligible relative to their volume, the beads' actual volume is mostly due to the trapped solution, which can be considered the "stationary" phase. The volume around the bead is called the void volume, Vo. It should be apparent that the volume inside the bead is given by
\begin{equation}
V_i=V_t-V_o
\end{equation}
A solute elutes from the column in a broad peak. If the sample volume applied to the column is very small compared to Vt, the volume at which a solute elutes, \(V_e\), is considered the center of the elution peak. This is true when \(V_{sample} \gg V_e\).
Suppose we view this chromatography as a solute partitioning between the mobile and stationary phases (the basis of all chromatography). In that case, we might be interested in what fraction of the stationary phase, Vi, a solute might partition into. Such a ratio would be given by:
\begin{equation}
K=\frac{V_e-V_o}{V_t-V_o}
\end{equation}
Vt-Vo (= Vinside) represents 100% of the stationary phase, where \(K\) is a distribution coefficient. Consider two cases:
- A very large solute compared to the pore size of the bead: In this case, Ve-Vo = 0 since Ve would be equal to Vo. (The solute wouldn't "see" any of the Vi.) In this case, K = 0. The solute would elute from the column's void volume, since it is too large to partition into the bead volume. All solutes of molecular weight greater than or equal to the smallest solute that can't enter the gel beads will all elute in the void volume. Hence, solutes greater than this minimal size will co-elute from the column and not be separated. Vo is usually about 30-40% of the Vt.
- A very small solute compared to the pore size. In this case, Ve-Vo = Vt - Vo, since Ve would be equal to Vt. The solute would "see" all of the solvent within the bead. In this case, K = 1. Like above, all solutes of MW equal to or less than the largest solute that can partition into the entire volume within a bead will co-elute at a volume near Vt.
Hence \(K\) is a partition coefficient, which varies from 0 - 1 and represents the fraction of Vi into which a solute could partition. However, this K is not exactly a partition coefficient since the actual volume of the gel matrix is assumed to be zero above. The graph in Figure \(\PageIndex{5}\) shows typical Ve as a fraction of Vt for solutes of different sizes (the x-axis is Ve/Vt).

Large species that cannot enter the pores in the beads flow around it and elute in the void volume (V0), which is about 35-40% of Vt (red bell-shaped curve). Very small species can partition into V0 and Vi, so they elute near Vt (green bell-shaped curve). If a species adsorbs to the column bead via noncovalent interactions (e.g., hydrogen bonds or ion-ion interactions), it may elute after Vt (purple bell-shaped curve).
K depends on the solute's size and shape. The size and shape of an object determine its flow properties in a fluid. Frictional resistance (itself a force that acts in the opposite direction to the velocity, another vector quantity) can be shown to be proportional to the velocity.
\begin{equation}
F_f \propto v
\end{equation}
or
\begin{equation}
F_f=-f v
\end{equation}
where \(f\) is the frictional coefficient, which depends on the shape. The bigger the object, the more frictional resistance to movement. For a sphere, it can be shown that:
\begin{equation}
f=6 \pi \eta R_s
\end{equation}
where η is the viscosity (a measure of the resistance to flow of a liquid - water has a low viscosity, real maple syrup has a high viscosity), and Rs (Stokes radius) is the radius of the hydrated sphere (the larger Rs, the larger the frictional coefficient, the larger the Ff which resists motion). For an irregularly shaped object, the Stokes radius is the radius of a sphere that would have the same frictional coefficient as the object. Hence, the Rs for a protein molecule that was not spherical would be much larger than the Rs for another protein molecule of identical molecular weight that was spherical. Hence, the Ve and the K values for a solute on a gel filtration column would best be related to the Stokes radius since Rs values consider both size and shape.
If you separate two proteins of equal mass but one is highly elongated, and the other is spherical, the elongated one, with a large RS, would elute first (assuming that both don't elute together in the void volume, V0.
Gel filtration can determine the molecular weight of an unknown, spherical (globular) protein compared to a standard curve generated from other globular proteins of known molecular weight. To ensure the proteins have the same "effective" shape, the proteins are eluted under denaturing conditions to remove shape-related contributions to the elution order.
Separation based on charge - Ion Exchange Chromatography
The chromatography resin in this type consists of an agarose, acrylamide, or cellulose resin or bead, which is derivatized to contain covalently linked positively or negatively charged groups. Proteins in the mobile phase will bind to the column via electrostatic interactions with the column's charged group. In a mixture of proteins, positively charged proteins will bind to a resin containing negatively charged groups, like the carboxymethyl group, CM (-OCH2COO-), or sulfopropyl, SP, (-OCH2CH2CH2SO3-). In contrast, the negatively charged proteins will pass through the column. The positively charged proteins can be eluted from the column with a mobile phase containing either a gradient of increasing salt concentration or a single higher salt concentration (isocratic elution). The most positively charged protein will be eluted last, at the highest salt concentration. Likewise, negatively charged proteins will bind to a resin containing positively charged groups, like the diethylaminoethyl group, DEAE (-OCH2CH2NH(C2H5)2+) or a quaternary ethyl amino group, QAE, and can be separated analogously.
Ion exchange chromatography separates compounds based on their ionic charge. The column used is selected according to its type and charge strength. Anion exchange resins carry a positive charge and are used to retain and separate negatively charged compounds (anions). In contrast, cation exchange resins carry a negative charge and are used to separate positively charged molecules (cations).
Before the separation begins, a buffer is pumped through the column to equilibrate the opposing charged ions. Upon sample injection, solute molecules will exchange with the buffer ions as each competes for the binding sites on the resin. The length of retention for each solute depends upon the strength of its charge. The most weakly charged compounds will elute first, followed by those with successively stronger charges. Because of the separating mechanism, pH, buffer type, buffer concentration, and temperature all play important roles in controlling the separation.
Figure \(\PageIndex{6}\) shows a cation exchange column. The beads (brown) contain negatively charged functional groups that can bind positively charged protein (blue) or concentrated regions of positive charge on a protein.

Before loading the column with protein, the negatively charged beads would interact with positively charged counterions (often Na+) from the column equilibration buffer. When the protein solution is introduced to the column, the positively charged protein will exchange with the bound Na+ ions (hence the name cation exchanger). Conversely, an anion exchanger consists of positively charged beads, which exchange anions. Proteins bound via ion-ion interactions can be eluted by increasing the Na+ concentration in the elution buffer stepwise or by using a salt concentration gradient. Ion exchange chromatography is a powerful protein purification tool and is frequently used in analytical and preparative separations.
Affinity Chromatography
In this technique, the chromatography resin is derivatized with a group that binds to a specific site on a given protein of interest. It may be a group that binds to the active site of an enzyme (such as benzamidine-agarose, which is used to purify trypsin) or an antibody that recognizes a specific amino acid sequence (an epitope) on a protein. For example, an antibody can be made to a specific peptide from albumin, the antibody covalently linked to agarose, and the antibody-agarose column then used to purify albumin specifically. This is a powerful technique since antibodies can be made that will bind selectively to a single protein. Knowing only the DNA sequence of a protein that has never been previously isolated, the amino acid sequence of the unknown protein can be derived from the DNA sequence. A 10-12 amino acid peptide from that protein can be synthesized in the lab (see the last section below), and an antibody raised against the peptide. The antibody will most likely bind to the unknown protein and the peptide, and could be used to purify the protein.
These features of affinity chromatography are illustrated in Figure \(\PageIndex{7}\).

In this example in Figure \(\PageIndex{7}\), protein P1 has an affinity for ligand Z and will bind to the column, while proteins P2 and P3 will pass through the column. Protein P1 can then be eluted from the column using high concentrations of free ligand Z.
For more details on the chemistry of in vitro peptide synthesis, click the link below.
- Answer
-
When making anti-peptide antibodies that recognize target proteins, or studying an isolated peptide on its own, it is more difficult to isolate and purify a peptide from its original protein than to synthesize it in the lab using solid-phase synthesis. We describe this technique below.
Peptides are chemically synthesized by the condensation reaction of the carboxyl group of one amino acid to the amino group of another. Two chemical challenges must be addressed. The formation of an amide bond between the carboxylic acid of one amino acid and the amine of the other is thermodynamically unfavorable, so the carboxyl end must be activated, typically by reaction with a reagent such as dicyclocarbodiimide. Secondly, reactive functional groups on the side chains and the amine of the carboxyl group-activated amino acid must be protected from unwanted reactions. Chemical peptide synthesis most commonly starts at the carboxyl end of the peptide (C-terminus) and proceeds toward the amino-terminus (N-terminus). Protein biosynthesis in living organisms occurs in the opposite direction. Chemical synthesis enables the production of peptides incorporating unnatural amino acids, peptide/protein backbone modification, and D-amino acids.
The established method for producing synthetic peptides in the lab is known as solid-phase peptide synthesis (SPPS). Pioneered by Robert Bruce Merrifield, SPPS allows the rapid assembly of a peptide chain through successive reactions of amino acid derivatives on an insoluble porous support. The solid support consists of small polymeric resin beads functionalized with reactive groups (e.g., amine or hydroxyl groups) that bind to the nascent peptide chain. Since the peptide remains covalently attached to the support throughout the synthesis, excess reagents and side products can be removed by washing and filtration. This approach circumvents the comparatively time-consuming isolation of the product peptide from solution after each reaction step, which would be required in conventional solution-phase synthesis.
Each amino acid to be coupled to the peptide chain N-terminus must be protected on its N-terminus and side chain using appropriate protecting groups such as t-Boc (t-butyloxycarbonyl-, acid-labile) or fluorenylmethyloxycarbonyl (Fmoc, base-labile), depending on the side chain and the protection strategy used (see below).
The general SPPS procedure involves alternating cycles of N-terminal deprotection and coupling reactions. The resin can be washed between each step to remove byproducts. Figure \(\PageIndex{8}\) shows the mechanism for the solid phase synthesis of a dipeptide.

Figure \(\PageIndex{8}\): Solid phase peptide/protein synthesis A. Deprotection of AA1: The first amino acid is coupled to the resin or purchased pre-coupled. The amine terminus contacting an FMOC group is deprotected with piperidine. The hydrogen abstracted from the FMOC is acidic, as its negatively charged conjugated base is aromatic: the negative charge on that C is sp2 hybridized to form the aromatic anion. The weak base piperidine is used to avoid side reactions.
B. Activation of AA2: The carboxyl group of AA2 reacts with a carbodiimide, which is attacked by the carboxylate of AA2, leading to the formation of an isourea derivative. This can react with a second nucleophilic catalyst (which is regenerated in step C), hydrobenzotriazole (HBT), to form the activated HBT ester and the very stable urea derivative.
C. Coupling Reaction: The activated AA2 now reacts with the amine of the solid phase N-terminal deprotected AA1 to form the peptide bond.
This cycle repeats until the desired sequence has been synthesized. At the end of the synthesis, the crude peptide is cleaved from the solid support while simultaneously removing all protecting groups with a strong acid reagent, such as trifluoroacetic acid. The crude peptide can be precipitated from a non-polar solvent like diethyl ether to remove organic-soluble by-products and then purified using reversed-phase HPLC. The purification process, especially of longer peptides, can be challenging because small amounts of several byproducts, which are very similar to the product, must be removed. For this reason, so-called continuous chromatography processes, such as MCSGP, are increasingly used in commercial settings to maximize yield without sacrificing purity.
Reaction yields limit SPPS, and typically peptides and proteins with 70 or more amino acids push the limits of synthetic accessibility. Synthetic difficulty is also sequence-dependent; aggregation-prone sequences, such as those found in amyloids, are typically difficult to make. Longer lengths can be accessed using ligation approaches, such as native chemical ligation, in which two shorter, fully deprotected synthetic peptides can be joined in solution.
Cell proteins can be increasingly engineered by manipulating their gene to contain a molecular tag, either a small peptide or a protein for which antibodies are commercially available. The tag is attached to the target's N- or C-terminal end to avoid interfering with the target protein's folding. Examples of peptide tags include His (sequence HHHHHH), FLAG (DYKDDDDK), and HA (YPYDVPDYA). The HA tags derive from the influenza hemagglutinin protein. A small protein, such as the green Fluorescent Protein (GFP), can also be used as a tag. The resulting fusion protein of GFP connected to the target protein can also allow the target protein to be localized and followed by confocal fluorescence microscopy within the cell. Chromatography resins with covalently attached antibodies to the His, FLAG, HA peptide tags, and GFP are commercially available as affinity chromatography resins, as shown in the right-hand side of Figure \(\PageIndex{9}\) below.

Affinity reagents other than antibodies can be attached to the beads, as shown on the left-hand side of Figure \(\PageIndex{9}\). Two, in particular, are Ni-Nitrilotriacetic acid (Ni-NTA) and the short peptide glutathione (γ-gluatmylcysteinylglycine). They also bind tagged proteins. The Ni-Nitrilotriacetic binds the His tag by chelating the nickel ion with the six histidine imidazole groups on the His-tagged protein. (Note that His tags can also be bound to anti-His tag antibody beads.) Glutathione binds to a protein tag, Glutathione S-transferase (GST), which is fused to the target.
The structure of the Ni2+-NTA complex attached to a bead and imidazoles (on a His6 tag) is shown in Figure \(\PageIndex{10}\) below.
 |
 |
 |
Figure \(\PageIndex{10}\): Ni2+-NTA - imidazole complexes (after Wegner and Spatz, https://doi.org/10.1002/anie.201210317)
Figure \(\PageIndex{11}\) shows an interactive iCn3D model of the Ni2+ NTA complex.
Figure \(\PageIndex{11}\): iCn3D model of the Ni2+-NTA complex. To see the Ni2+ in spacefill, follow these commands in the iCn3D window. Click the = menu icon and then:
- Select, Select on 3D, choose Atom
- Alt-click the central Ni ion
- Style, Chemical, Sphere
Without a His6 tag, two water molecules occupy adjacent axial and equatorial positions (shown interacting with imidazole rings of His in the images above) in the generally octahedral complex. One ring C in the iCn3D models shows a carbon with an unfilled valence. The bead is covalently attached to that carbon.
The His tag, probably the most widely used, binds strongly to divalent metal ions such as nickel and cobalt. The protein can be passed through a column containing Ni-nitrilotriacetic acid. All untagged proteins pass through the column. The protein can be eluted with imidazole, which competes with the imidazole side chain on the His tag for binding to the column, or by decreasing pH (typically to 4.5), which decreases the affinity of the tag for the resin. While this procedure is generally used to purify recombinant proteins with an engineered affinity tag (such as a 6xHis tag), it can also be used for natural proteins with an inherent affinity for divalent cations.
Hydrophobic Interaction Chromatography (HIC)
HIC media is similar to reverse phase chromatography in which a matrix like silica (very polar with exposed OH groups) is derivatized with ester or ether links from the silica surface hydroxyls to nonpolar molecules, usually containing 8 or 18 carbons in the acyl or alkyl chain. Proteins with exposed hydrophobic groups would preferentially bind to the bead. The interactions between the protein and the derivatized beads increase when high concentrations of salt are added to the aqueous solution, making water more polar. This would shift the equilibrium towards binding the surface-exposed nonpolar region on the protein to the nonpolar C8 or C18 chains. The ionic strength of the buffer is then reduced to elute proteins in order of increasing hydrophobicity, as shown in Figure \(\PageIndex{11}\).

The column matrix, shown in blue, has a hydrophobic ligand covalently attached. In high salt conditions, proteins bind to the matrix with differing affinities, with more hydrophobic proteins (shown in yellow) binding more tightly than more hydrophilic proteins (shown in green). When the salt concentration decreases, more hydrophilic proteins are released first, followed by more hydrophobic proteins.
High Performance Liquid Chromatography (HPLC) and Fast Protein Liquid Chromatography (FPLC)
High-performance liquid chromatography, or high-pressure liquid chromatography (HPLC), applies high pressure to drive solutes through the column faster than gravity-driven solvent flow. The small and close-packed packing beads allow for greatly increased resolution. Because of the close packing of the small beads, no flow would occur with an external pump. The most common form of HPLC is "reversed phase" HPLC, where the column packing material is hydrophobic. The proteins are eluted by a gradient of water and increasing amounts of an organic solvent, such as acetonitrile. The proteins elute in order of their hydrophobicity. After purification by HPLC, the protein is dissolved in a solution containing only volatile compounds and can be easily lyophilized (freeze-dried). HPLC purification often results in protein denaturation and is thus not applicable to proteins that do not spontaneously refold.
Due to the drawbacks of HPLC, an alternative technique using lower pressure was developed called Fast Protein Liquid Chromatography (FPLC). In FPLC, the mobile phase is an aqueous solution, or "buffer". A positive displacement pump controls the buffer flow rate and is normally kept constant. In contrast, the buffer composition can be varied by drawing fluids in different proportions from two or more external reservoirs. The stationary phase is a resin composed of beads, usually of cross-linked agarose, packed into a cylindrical glass or plastic column. Depending on the application, FPLC resins are available in a wide range of bead sizes and surface ligands.
An ion exchange resin is typically chosen in the most common FPLC purification systems, as shown in Figure \(\PageIndex{12}\).
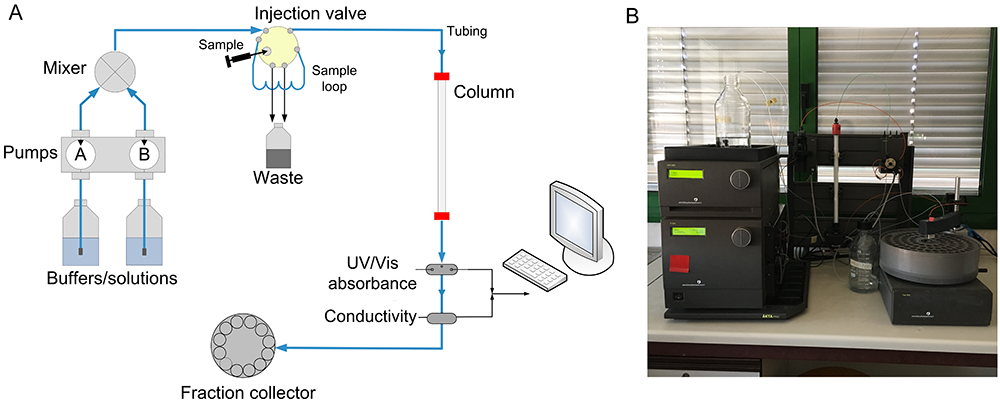
A mixture containing one or more proteins of interest is dissolved in 100% buffer A and pumped into the column. The proteins of interest bind to the resin while other components are carried out in the buffer. The total buffer solution flow rate is kept constant; however, the proportion of Buffer B (the "elution" buffer) is gradually increased from 0% to 100% according to a programmed concentration change (the "gradient"). Buffer B contains high concentrations of the exchanger ion. Thus, as Buffer B's concentration increases, bound proteins will dissociate due to ionic interactions between the exchanger ion and the column matrix, and they will appear in the eluant. The eluant passes through two detectors: one measures salt concentration (by conductivity) and the other protein concentration (by absorbance at 280 nm). As each protein is eluted, it appears in the eluant as a "peak" in protein concentration and can be collected for further use.
Purification Scheme
During protein purification, a quantitative system is necessary to determine the total amount and concentration of the target protein at each step, its biological activity, and its overall purity. This will help guide and optimize the purification method being developed. Ineffective separation techniques can be disregarded, and other techniques that give higher yields and retain the protein's biological activity can be adopted.
Thus, each step in the purification scheme is quantitatively evaluated for the following parameters: total protein, total activity, specific activity, yield, and purification level. The terms are described below.
Pretend you are a researcher who wants to isolate a novel, unknown protein from a bacterial culture. You grow 500 ml of the bacteria overnight at 37 °C and harvest the bacteria by centrifugation. You remove the culture broth and retain the bacterial pellet. You then lyse the bacteria using freeze/thaw in 10 mL of reaction buffer. You then centrifuge the lysed bacteria to remove insoluble material, retaining the supernatant containing soluble proteins. Your protein of interest has a biological activity you can measure using a simple assay that causes a color change in the reaction mixture, as illustrated in Figure \(\PageIndex{13}\). You also note that this reaction rate increases with increasing concentrations of your protein supernatant.

At this point, you can measure your baseline concentrations for the first purification step (bacterial lysis and centrifugation to remove insoluble proteins and other cellular debris).
Total Protein is calculated by measuring the concentration in a fraction of the sample and then multiplying that by the total volume of your sample. In this case, you are starting with 10 mL of supernatant. In a typical protein concentration assay, you will use 50-200 μL of sample. For example, if you calculate that there is 7.5 μg/μL in your initial assay, you would need to convert that value into mg/mL and then multiply it by 10 mL for a total of 75 mg of protein in 10 mL of supernatant (Table \(\PageIndex{1}\)).
Total Activity is measured as the enzyme activity in the assay multiplied by the sample volume. For example, you might use 5 to 50 μL of the sample in your biological reaction. If you calculated the activity in your assay to be 2.5 units/μL, this would be equivalent to 2,500 units/mL or 25,000 units/10 mL of supernatant. Note that the enzyme unit, or international unit for the enzyme (symbol U, sometimes also IU), describes the enzyme's catalytic activity. 1 U (μmol/min) is defined as the amount of the enzyme that catalyzes the conversion of one micromole of substrate per minute under the specified conditions of the assay method.
Specific Activity is measured by dividing the Total Activity by the Total Protein. In our example, 25,000 units divided by 75 mg of protein = 333.3 units/mg.
Yield measures the biological activity retained in the sample after each purification step. The amount in the first step is set to be 100%. All subsequent yield steps will be evaluated using the first purification step. It is calculated by dividing the current step's total activity by the first step's total activity and multiplying it by 100.
The Purification level evaluates the purity of the protein of interest by dividing the specific activity measured after each purification step by that of the first purification step. Thus, the first step always has a value of 1. A typical purification analysis scheme is shown below in Table \(\PageIndex{1}\).
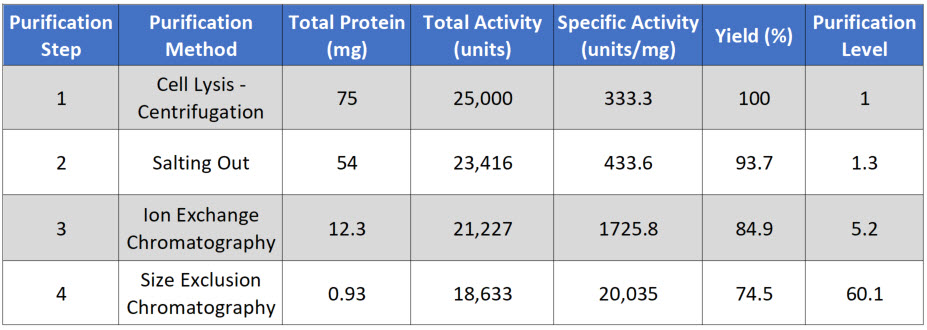
Table \(\PageIndex{1}\): A typical purification analysis scheme.
Note that after each purification step, the total protein goes down, as you separate the target protein from other proteins in the mixture. Total Activity also goes down with each purification step, as some of your protein of interest is also lost at each purification step because (1) some protein will stick to the test tubes and glassware, (2) some protein won't bind with 100% efficiency to your column matrix, (3) some protein may bind too tightly to be removed from the column matrix during elution, and (4) some protein may be denatured or degraded during the purification process.
The overall percent yield (or recovery) for each purification step represents the amount of your protein of interest that is retained. Alternative purification methods should be explored if the percent yield is too low.
Note that in a good protein purification scheme, the specific activity should go up substantially with each level of purification, as the amount of your protein of interest makes up a greater percentage of the total protein within that fraction. If the specific activity only increases modestly within a purification step, or if it decreases during a purification step, this could indicate that (1) your protein of interest is being substantially lost at that step, (2) your protein of interest is being denatured or degraded and is no longer biologically active, or (3) that a required cofactor or binding protein is being reduced at that purification step. Additional experiments may be needed to determine which factors predominate, so that steps can be taken to reduce protein inactivation. For example, many proteins are temperature sensitive and will degrade or denature at room temperature. Completing purification steps on ice can often reduce degradation.
The fold-increase (specific activity at step n divided by the initial specific activity) or purification level should increase during purification. A high-quality purification procedure results in a high fold increase or purification level AND a high recovery or yield.
Electrophoresis: Separation and Analysis
In column chromatography, flow through the column is driven by hydrostatic pressure, causing flow from higher-pressure regions at the top of the column reservoir to lower-pressure regions at the bottom of the column (drops eluting from the bottom). Ultimately, the hydrostatic pressure (in columns not driven by mechanical pumps) is due to gravity. However, proteins are charged particles and can be moved by an external electric field rather than a gravitational field. Electrophoresis is the movement of charged particles in an electric field. As we will show below, the movement of a charged protein within a static matrix in the presence of an external electric field depends on both size and shape. Electrophoresis can be used for both analytical and preparative separations of proteins. The most common uses are for analytical separations.
Theory
What determines how a protein moves in an electric field? Consider a charged particle (+Q) moving in an electric field (E) in a nonconducting medium, such as water. Suppose the particle is moving at a constant velocity toward the cathode (- electrode where cations go). In that case, the net force Ftot on the particle is 0 (since F=ma, and the acceleration (a) of the particle is zero at constant velocity). Two forces are exerted on the particle, one FE, the force exerted on the charged particle by the field, which is in the direction of the motion (toward the cathode), and the other, Ff, the frictional force on the charged particle, which retards its motion toward the cathode, and hence is in the direction opposite to the motion (toward the anode (+) electrode). This is shown in the Figure \(\PageIndex{14}\):

Therefore:
\begin{equation}
\mathrm{F}_{\text {tot }}=\mathrm{F}_{\mathrm{E}}+\mathrm{F}_{\mathrm{f}}
\end{equation}
where FE, the electrical force, is
\begin{equation}
\mathrm{F}_{\mathrm{E}}=\mathrm{QE}
\end{equation}
and
Ff, the frictional force, is
\begin{equation}
\mathrm{F}_{\mathrm{f}}=-\mathrm{fv}
\end{equation}
In the last equation, v is the particle's velocity, and f is a constant called the frictional coefficient. This equation shows that the force Ff hindering motion toward the cathode is proportional to the particle's velocity. This is intuitive, since one would expect that the higher the velocity, the greater the Ff, which would hinder motion. The frictional coefficient depends on a molecule's size and shape. The larger the molecule, the larger the frictional coefficient (i.e., more resistance to the molecule's motion). It can be shown that the frictional coefficient for a spherical particle is given by
\begin{equation}
\mathrm{f}=6 \pi \eta \mathrm{R}_{\mathrm{S}}
\end{equation}
where η is the viscosity (a measure of the resistance to flow of a liquid - water has a low viscosity, real maple syrup has a high viscosity), and Rs (Stokes radius) is the radius of the hydrated sphere (the larger Rs, the larger the frictional coefficient, the larger the Ff which resists motion toward the cathode). This equation should be intuitive based on your experiences.
When the velocity of the charged particles is constant (i.e, there is no net force on the particle), Fe = Ff, and using equations 3.3.6-8 gives
\begin{equation}
\mathrm{QE}=\mathrm{fv}
\end{equation}
Hence v/E = Q/f = U = the electrophoretic mobility, or
\begin{equation}
\mathrm{U}=\frac{\mathrm{V}}{\mathrm{E}}=\frac{\mathrm{Q}}{6 \pi \eta \mathrm{R}_{\mathrm{S}}}
\end{equation}
Therefore, the electrophoretic mobility U is proportional to the particle's charge density (Q/Rs), not just its size, as is the case for spherical proteins in size-exclusion chromatography. Macromolecules of different charge densities can thus be separated by electrophoresis. This discussion deals with the simplest case since, in reality, there are counterions in the solution (from salts), which would form a cloud around the charged macromolecule and partially shield the charged particle from the electric field E.
Modern-day electrophoresis is conducted in solid gels (such as polyacrylamide) formed from liquid acrylamide solutions after the addition of a polymerizing agent. The solid gel is porous to solute and solvent molecules. It serves as a medium for electrophoresis while helping to eliminate convection forces in the liquid that interfere with the separation. Electrophoretic experiments have been conducted on the space station in weightless conditions to prevent such perturbations.
One complication in this idealized description of electrophoresis in polyacrylamide gels is that the gels contain pores through which the macromolecules can move. Think of the protein moving under an electric force through a "spider web-like" matrix. As in gel chromatography, smaller molecules can pass through the pores more readily than larger ones. Hence, this additional sieving mechanism contributes to effective mobility. (Also, the gel could alter the local effective electric field.) The gel's sieving effect increases the resolving power of this technique.
It has been determined that the actual electrophoretic mobility of the protein, U, is a function of the mobility of the protein in a concentrated sucrose solution (Uo) and T, the total concentration of the acrylamide in the polymerized gel. The higher the concentration of acrylamide in the unpolymerized gel solution, the smaller the pores in the polymerized gel. An equation showing the relationship between U, Uo, and T is shown below:
\begin{equation}
\log \mathrm{U}=\log \mathrm{U}_{0}-\mathrm{K}_{\mathrm{r}} \mathrm{T}
\end{equation}
where Kr is the slope of a log U vs T plot for a given protein. Since Kr is a function of the radius of the molecule, it is possible to determine the molecular weight of a protein molecule by performing several electrophoretic separations in gels of different acrylamide concentrations (T) and extrapolating results to T = 0, hence eliminating pore size effects. Problems arise, however, if the proteins are not spherical.
Is there any way to obtain molecular weight information, in addition to purity determination, on a single gel? What would result if two different proteins with the same molecular weight and total net charge but different shapes were run on a single acrylamide gel? The more elongated shape (large Stokes radius) would have lower electrophoretic mobility (U = Q/6πηRs). A larger Rs would also cause the protein to enter the pores more slowly. Hence, electrophoretic mobility and sieving effects would cause this protein to run anomalously slowly and to appear to have a higher apparent molecular weight. Also, imagine two globular proteins of different sizes but with compensatory charge differences, which might allow them to migrate at the same speed through the gel.
An astute reader might quickly recognize a problem separating proteins by gel electrophoresis. Some proteins are negatively charged (pH > pI), some would be neutral (pH=pI), and the rest would be positive (pH < pI). Only some proteins would enter the gel and migrate toward the bottom electrode. Luckily, there is a way to eliminate both charge and shape effects in the electrophoresis of proteins: run the gel under denaturing conditions so that all proteins have the same charge density. The denaturant of choice for electrophoresis is usually sodium dodecyl sulfate (SDS), which is an ionic detergent with the structure CH3(CH2)10CH2OSO3- (a single chain amphiphile). This detergent binds to and denatures most proteins, with about 1.4 g SDS binding per gram of protein (about 1 SDS/2 amino acids). Since there is one negative charge/SDS, the binding of SDS masks any of the charges on the protein and gives all proteins an overall large negative charge. Additionally, SDS-protein complexes have been shown to have an elongated, cylindrical shape. Since the amount of SDS bound per unit protein mass is constant, the overall charge density on all proteins is similar, so the electrophoretic mobility is only determined by sieving effects.
SDS also eliminates shape differences among proteins as a variable, since all proteins have a similar rod-like shape. (The use of SDS is analogous to using 8M urea in the gel chromatographic separation of proteins to determine molecular weights.) Mobility becomes only a function of the molecular weight of the protein and not its shape. The molecular weight of an unknown protein can be determined by comparing the protein's position on an SDS polyacrylamide gel with a series of known molecular weight standards, from which a linear plot of the ln Mr vs Rf can be used to calculate unknown molecular weights. This is similar to the analysis in gel chromatography, where ln Mr is a linear function of Kavg, the distribution coefficient when the gel is run under denaturing conditions. However, some proteins run anomalously on such gels (due to incomplete or excessive SDS binding), so alternative molecular weight-determination techniques should be used in conjunction with this method.
Proteins are usually heated in SDS to 100 °C for 3 minutes in the presence of a reducing agent such as β-mercaptoethanol (βME) to denature them into rod-shaped molecules. Apparent molecular weight can be obtained under non-reducing conditions (without βME), but these should be considered just estimates. Running proteins, both in the presence and absence of a reducing agent, can provide important information about a protein's subunit structure. A multimeric protein whose subunits are held together by disulfide bonds can be resolved into component subunits by adding a reducing agent. If the subunits are held together only by noncovalent interactions, they will separate under denaturing conditions (SDS), eliminating subunit interactions in the presence or absence of β-ME.
Electrode nomenclature can be confusing. In the above example, in the presence of an existing electric field produced by a power source, the +Q particle, a cation, moved to the cathode, the negative electrode. In protein or DNA electrophoresis, you know that the negatively charged proteins or DNA fragments, which are anions, move to the bottom of the gel towards the anode, the positive electrode. However, when you studied galvanic cells (that spontaneously produce current without a power supply) in general chemistry courses, the cathode is the positive electrode, and the anode is the negative electrode. Instead of remembering the charge state of the electrode, it is better to focus on the redox reactions that occur at each electrode:
- It is always true that Oxidation occurs at the Anode - both start with a vowel - and Reduction occurs at the Cathode - both start with a consonant!
In galvanic cells, an electrical current is generated from a spontaneous set of redox half-reactions. In electrolytic cells, an external power supply is required to drive particle motion and the nonspontaneous redox reactions at the electrodes. In electrophoretic cells for protein analysis, the bubbles released at the electrodes are from the electrolysis of water - 2H2O(l) → 2H2 (g) + O2(g). The oxidation number of H goes from +1 to 0 in the reaction, so H is reduced and is produced at the cathode. In SDS-PAGE, SDS-coated proteins (negatively charged) migrate to the anode, the positive electrode in this case. Commercial electrolytic cells can produce Cl2(g) and Mg(s) from the aqueous electrolyte MgCl2(aq). Figure \(\PageIndex{15}\) illustrates the differences between galvanic and electrolytic cells.
 Figure \(\PageIndex{15}\): Galvanic vs electrolytic cells

Optional: To support the material in Chapter 32: Biochemistry and Climate Change, to review your learning in previous courses, to prepare for more complex redox reactions (mitochondrial electron transport, photosynthesis, and nitrogen fixation) that we will encounter later in this book, and as we move to electric vehicles (EVs) to reduce greenhouse gases from burning fossil fuels, it's important to know how Li+ ion batteries that power EVs work. All you need is basic general chemistry, which provides the foundation for understanding biochemical redox reactions.
- Click the link below if you wish to learn more about lithium-ion batteries
-
The diagram below shows the components of a Li+ ion battery that discharges to power electronic devices (such as a light bulb) and electric cars. Compare it to the spontaneously discharging galvanic/voltaic cell (left image above).

Schematic of the involved species/charge transports and electrochemical reactions in lithium-ion cells during discharge. Lithium atoms are shown as red spheres, Li+ ions as light orange, and electrons as light green. Jiang, F., Peng, P. Elucidating the Performance Limitations of Lithium-ion Batteries due to Species and Charge Transport through Five Characteristic Parameters. Sci Rep 6, 32639 (2016). https://doi.org/10.1038/srep32639. Creative Commons Attribution 4.0 International License. http://creativecommons.org/licenses/by/4.0/
In a lithium-ion battery:
* The - electrode (anode, where oxidation occurs) is porous carbon graphite (parallel sheets of graphene) with Li atoms/ions on a conducting metal (Cu). This is where Li+ ions and free electrons (e-) are formed. The electrons move through the electric circuit to the + electrode (the cathode);
* A liquid electrolyte solution (replaces the "salt bridge" in the Cu/Zn2+ cell) allows the transfer of Li+ to the + cathode (the tricky part to remember) to preserve charge neutrality.
* The + electrode (cathode, where reduction occurs) is a metal oxide (such as CoO2) on a conducting metal (Al), which reduces the arriving Li+ ions to neutral Li and intercalation into the CoO2 polymer. This is the reaction shown in the figure above. Most references state that the Co(IV) in CoO2 is reduced to Co(III), which is perhaps more likely given the low ionization energy of the gaseous form of Group 1 Li.
Here are the actual chemical reactions that occur at the anode and cathode during the discharge of the battery to power a light or an electric car:
Li atoms (neutral, red spheres) in the graphite anode are oxidized to Li+ ions (yellow spheres) as shown in this reaction:
Oxidation at anode: LiC6 → C6 + Li+ + e-
The Li+ ions move from the anode through the electrolyte to the cathode, where they are reduced (like Cu2+ in the left figure above). Here is the reaction:
Reduction (at cathode): Li+ + e- + CoO2 → LiCoO2
The last reaction could indicate that either Li+ or Co(IV) is reduced to maintain charge balance. The oxidation number of Co in CoCO2 is +4 (as each O is -2). In LiCoO2, if Co is reduced, it becomes Co+3 as it gains an electron, with the +1 on Li balancing the net -4 on the two oxygens. If Li+ is reduced, it becomes atomic Li0. This presumes that the interactions are all ionic. So with charge states/oxidation numbers, this could be written as:
Li+ + e- + Co(IV)(O2-)2 → [Li+Co(III)(O2-)2 or Li0Co(IV)(O2-)2]
A better way might be to envision a sharing of the electron between the Li+ and Co(IV) ions. We'll address this more below.
On charging (nonspontaneous, driven by plugging in the car), the reverse process occurs: reduced Li in LiCoO2 donates an electron (as Zn in the left figure above) to form Li+, which moves to the graphite electrode. Here is an animation (which sometimes requires refreshing the browser) showing the structure and Li-ion diffusion out of a LiCoO2 cathode (click the Lithium Ion Diffusion Icon).
The figure below shows the 3D structures of different graphite forms with intercalated Li in the anode.

The crystal structure of (a) and (b) graphite, (c) and (d) C12Li, and (e) and (f) C6Li. (b, d, and f) Show a c-axis view of graphite, C12Li, and C6Li, in which Li is located at the center of six-member carbon rings. Phys. Chem. Chem. Phys., 2017,19, 19058-19066. Creative Commons Attribution-NonCommercial 3.0 Unported
Here are two views of the LiC6 anode structure (see this link for a 3D view). Carbons in graphite are shown as gray spheres, while Li is shown as purple spheres. Lithium migrates in a 2D plane between 2 graphene layers (graphene is a single layer of graphite). Here is another link for the structure of LiC6.


The empirical formula for this structure is LiC6, but it is also written as C6Li. If we consider LiC6 as purely an ionic compound, the lithium would appear to have a +1 charge and oxidation state, and each of the Cs would be -1/6 = -0.166, with the electron from Li entering the pi cloud of graphite. But didn't we say above that Li likely has an oxidation number/charge of 0 (i.e., it's a neutral atom) in the LiC6 structure?
Here is some help for this problem. Assigning electrons to determine the charge state in metal ion complexes is arbitrary. It doesn't indicate the actual electron density around an atom (as in the case of H3O+, in which O has a formal charge of +1 but has almost all of the electron density). In the case of a transition metal complex, we can consider the bond between the metal and ligand to be a coordinate covalent bond. For a transition metal complex, the metal's oxidation number can be determined by first separating (in your mind) the ligand and its donating electrons from the metal. There are two ways to do this:
* send both electrons in the coordinate covalent bond to the withdrawn ligand (ie, a heterolytic cleavage). If the ligand is -NH3, the removed ligand has a full lone pair (:NH3) and is neutral. For a -CH3 ligand, the removed ligand would be :CH3-, a carbanion with a negative charge.
* send one electron to the withdrawn ligand and one to the metal (i.e a homolytic cleavage). If the ligand is -CH3, the removed ligand is .CH3 (free radical and neutral).
For Li, a nontransition Group I metal, if we assign one electron in the bond to Li and the other to the separated C6 electron cloud, the oxidation state of Li would be 0, consistent with the anode reaction shown above. Given the delocalized electron density from the pi clouds of the graphite interacting with Li, a coordinate covalent bond is a better descriptor than a simple ionic one. At the same time, given how easily Li gives up an electron, it makes sense to show both Li and Li+ in the electrodes.
Here is a figure showing the LiCoO2 cathode.

Lithium is shown in purple, oxygen in red, and Co in orange. https://www.chemtube3d.com/lib_lco-2/
Much research is devoted to finding new electrons and metal substitutes to make them cheaper and more environmentally favorable. Lithium manganese oxide (LiMn2O4) and lithium iron phosphate (LiFePO4) are cathode alternatives that don't rely on expensive and toxic cobalt.
Polyacrylamide Gel Electrophoresis - PAGE
Electrophoresis is performed in a porous yet solid medium to eliminate any problems associated with convection currents. Such media are formed by solidifying a liquid agarose solution (used mostly for electrophoresis of DNA fragments and very large proteins) or by polymerizing a solution of acrylamide. Polymerization of acrylamide is initiated by the addition of ammonium persulfate in the presence of tetramethylenediamine (TEMED), along with a dimer of acrylamide (N, N'-methylene-bis(acrylamide) connected covalently between the amide nitrogens of the acrylamides by a methylene group. The structures of these compounds are shown in Figure \(\PageIndex{16}\).

As shown above, acrylamide's free-radical polymerization is initiated by adding ammonium persulfate, which generates free radicals upon dissolution in water.
The radical initiates polymerization of the acrylamide, as shown below. The TEMED, through its ability to exist as a free radical, acts as an additional catalyst for polymerization. A rigid gel is only formed, however, when N, N'-methylene-bis(acrylamide) is added to the mixture during the polymerization, which cross-links adjacent acrylamide polymers as shown in Figure \(\PageIndex{17}\).

The amount of bisacrylamide added during polymerization controls the degree of cross-linking and, hence, the pore size of the polymerized gel. The effect of pore size is OPPOSITE to that in gel chromatography. In both cases, large proteins have difficulty entering the pore. In gel chromatography, large proteins partition preferentially into the mobile liquid phase (the void volume) and are eluted most QUICKLY from the column. In electrophoresis, large proteins that cannot readily enter the pores of the gel are not as readily transported by the electric field through the gel and elute most SLOWLY. Pore size can not be controlled as accurately as in the manufacture of gel chromatography resins.
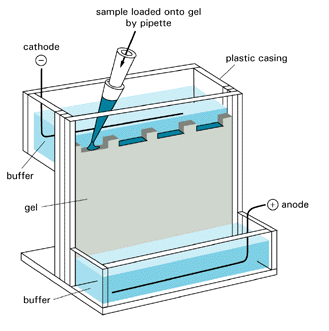
How do proteins migrate through the gel? A viscous protein solution is layered on the top of the gel in a small well molded into the gel during the polymerization process. The bottom and top parts of the gel are inserted into reservoirs containing a buffered solution and the appropriate electrode. The electric field is applied, and the proteins migrate through the hydrated gel. The nature of the buffer solution in the reservoir and the polymerized gel is important. The buffer components must not bind to the proteins to be separated. Additionally, for native (non-denatured) gels, the pH of the medium must be adjusted so that the proteins have the appropriate charge to migrate in the expected direction.
There are many variations of electrophoresis commonly used. Gels can be polymerized in tubes or slabs, with or without denaturing agents. Additionally, a given slab might consist of two separate slabs, each polymerized on top of the other, with different acrylamide concentrations and pH values. The top part is the stacking gel, and the bottom is called the running gel. Other gels have a continuous gradient of acrylamide concentrations (from low at the top to high at the bottom). Most commercially available precast gels use continuous acrylamide concentration gradients. Figure \(\PageIndex{18}\) shows a gel placed in an electrophoresis chamber.
Whether the gel has a continuous gradient or is discontinuous, the top part of the gel is a low concentration of acrylamide (2-4%), often in a Tris-HCl buffer solution (pH 6.5), usually 2 pH units below that used in the running gel. The lower part of the gel is 8-15% acrylamide, depending on the choice of gel, which is selected based on the molecular weight of the proteins to be separated. The upper buffer reservoir contains Tris buffer with a weak acid such as glycine (pKa2 = 9.6) to the same pH as the running gel.
Proteins electrophorese quickly through the low-concentration stacking gel at the top of continuous gradient gels and effectively "stack" as they hit the interface between the stacking and running gels or before they enter too far into the continuous gradient gel. This increases the compaction of protein bands before they enter the "running" section of the gel, thereby improving resolution.
For discontinuous gels, how does this stacking process work? When the electrophoresis is started, glycine ions from the upper reservoir (at pH 8.7) enter the stacking gel since, at that pH, they have an average partial negative charge. The stacking gel buffer ions continue moving through the stacking gel, but when the glycine ions enter the pH 6.5 region, they become zwitterions with a zero net charge and thus stop moving toward the anode. The electrical resistance in the stacking gel increases as the number of ions moving through it decreases. To maintain a constant current throughout the circuit, there will be a localized increase in voltage in the stacking gel (by Ohm's Law, V = iR). This will cause the proteins to migrate quickly and all stack in a single, very thin disc right behind the Cl- ions in the stacking gel (which are in front because they have the highest charge density and electrophoretic mobility of any ion in the stacking gel). The proteins will not pass Cl- ions, since, if they did, they would immediately slow down, since they would no longer be in an area of diminished charged carriers and higher voltage. At the stacking gel/running gel interface, proteins cannot all migrate at the same rate due to the sieving effect of the more concentrated gel. They will be separated in the running gel. The glycine eventually enters the running gel, assumes its fully charged state at that pH (8.7), passes the proteins, and restores the charge deficiency that occurred in the stacking gel.
Detection of proteins in the gel:
Most proteins do not absorb at visible wavelengths of light and hence will not be visible during electrophoresis. To prevent proteins from eluting from the gel into the lower buffer reservoir, a small-molecular-weight anionic dye and bromophenol blue are added to the protein before it is loaded onto the gel. The electrophoresis is halted when the dye reaches the bottom of the gel. The gel assembly is removed from the electrophoresis chamber, the glass plates are separated, and the gel is washed into a series of solutions to render the banded proteins visible.
- Coomassie Brilliant Blue dye is the most common stain in labs. It is dissolved in a methanol/acetic acid solution, generating significant waste. Proteins bind this dye, resulting in a concomitant spectral shift in its absorbance properties. The methanol and acetic acid in the dye solution also help to "fix" the proteins in the gel and prevent their diffusion into the solution. After the gel is stained, the background stain is removed with acetic acid/methanol, leaving the blue-colored protein bands. Some proteins will not be stained with Coomassie blue. A "colloidal Coomassie Blue" stain doesn't use methanol or acetic acid, so it is commonly used. A simple water solution can destain the gel.
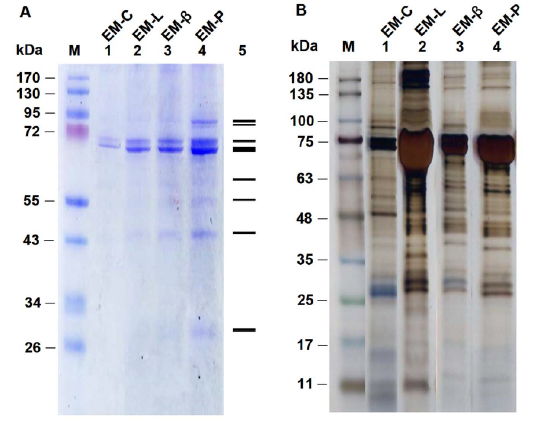
- Silver staining involves the reduction of Ag(I) to elemental silver and its deposition by protein in the appropriate reaction solutions, much as in a photographic process. (Remember, in the BCA assay, peptide bonds reduce Cu(II) to Cu(I), which is chelated to BCA.) A developer and fixer solution is required. This technique is 10-50 X more sensitive than Coomassie Blue staining. Figure \(\PageIndex{19}\) shows gels stained with Coomassie Blue (A)and silver staining (B).
- Modifying proteins with fluorescent or radioactive tags before electrophoresis increases sensitivity. After electrophoresis of a radiolabeled protein, the gel can be dried and overlaid with X-ray film for months, if necessary, to allow sufficient film exposure by a low-concentration protein. This visualization technique is called autoradiography.
Variations on polyacrylamide gel electrophoresis:
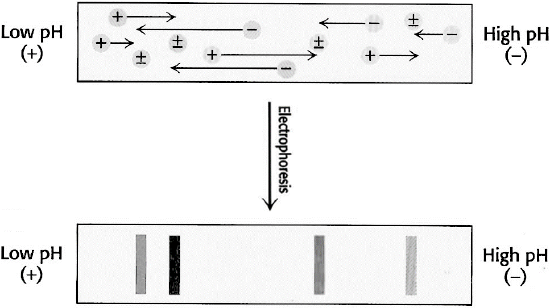
Isoelectric focusing: In this technique, a pH gradient is set up within the polyacrylamide gel or strip. This is accomplished by pre-electrophoresing a series of low-molecular-weight molecules containing amino and carboxyl groups called ampholytes, each with a different isoelectric point. When subjected to an electric field, the most negative of the species will concentrate at the anode, while the most positive will concentrate near the cathode. The remaining ampholytes will migrate to their isoelectric points, establishing a linear pH gradient in the gel.
Proteins initially in regions with a pH below their isoelectric point are positively charged and migrate toward the cathode. In contrast, those in a medium with a pH lower than its pI will be negatively charged and migrate towards the anode, as shown below in Figure \(\PageIndex{20}\). The migration will lead to a region where the pH matches the pI. There, the protein will have a net charge of zero and stop. Thus, amphoteric molecules are located in narrow bands where the pI coincides with the pH. In this technique, the point of application is not critical, as molecules will always move to their pI region. The stable pH gradient between the electrodes is achieved using a mixture of low-molecular-weight ampholytes whose pIs span a preset pH range.
2D electrophoresis: Two-dimensional gel electrophoresis (2-DE) separates a protein mixture according to two different molecular properties in each dimension. The most commonly used is based on a first-dimension separation by isoelectric focusing (IEF) and a second dimension by molecular weight using SDS-PAGE. A conditioning step is applied to proteins separated by IEF before the second-dimension run. This process reduces disulfide bonds and alkylates the resultant sulfhydryl groups of the cysteine residues. Concurrently, proteins are coated with SDS for separation based on molecular weight. After the IEF, the tube or strip is placed across the top of a slab gel and subjected to SDS-polyacrylamide gel electrophoresis at 90 ° to the direction of the initial isoelectric focusing experiment. Figure \(\PageIndex{21}\) shows a stained 2D electrophoresis gel.
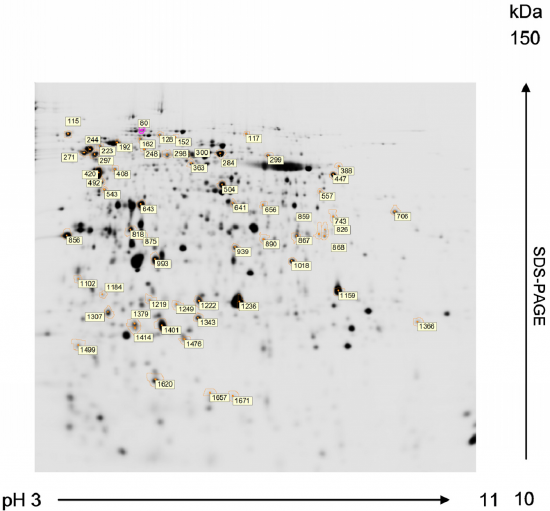
In Figure \(\PageIndex{21}\), proteins of Chlamydomonas reinhardtii are resolved by 2-DE from preparative gels stained with MALDI-MS compatible silver reagent for peptide mass fingerprinting analysis. First dimension: isoelectric focusing in a 3-11 pH gradient. Second dimension: SDS-PAGE in a 12% acrylamide (2.6% crosslinking) gel (1.0 mm thick). Numbered spots marked with a circle correspond to proteins that are to be subsequently identified by MALDI-TOF MS. The MALDI-TOF MS analysis of protein sequences is discussed in more detail in Chapter 3.4.
One of the biggest problems in 2-DE is the analysis and comparison of complex protein mixtures. Currently, there are databases capable of comparing two-dimensional gel patterns. These systems enable automatic spot comparison to precisely identify those needed for quantitative analysis. Once interesting proteins are identified, they can be excised from gels, destained, and digested for mass spectrometry analysis. This technique is known as peptide mass fingerprinting. The ability to precisely determine molecular weight by matrix-assisted laser desorption/ionization-time-of-flight mass spectrometry (MALDI-TOF MS) and to search databases for peptide mass matches has enabled high-throughput protein identification. Proteins not identified by MALDI-TOF can be identified by sequence tagging or de novo sequencing using the Q-TOF electrospray LC-MS-MS.
Western blotting: After a standard SDS-slab electrophoresis experiment, the gel is overlaid with a piece of nitrocellulose membrane. The sandwich of gel and filter paper is placed back into an electrophoresis chamber such that the proteins migrate from the gel into the nitrocellulose, where they irreversibly bind. This is illustrated in the figure below. Note, however, that in the absence of staining, the protein bands in either the PAGE gel or Western blot would not be visible. Standards (lane 5) would be visible if they were labeled with chromophores, as shown in Figure \(\PageIndex{22}\).

If a cell lysate were applied to a lane of a PAGE gel, the bands would appear as overlapping smears on the stained gel, regardless of the staining technique. Western blots are useful because specific bands can be visualized (stained) on the nitrocellulose membrane using a detection system linked to an antibody that recognizes a specific target protein. This is illustrated in Figure \(\PageIndex{23}\).

3D electrophoresis: To detect specific proteins in a 2D electrophoresis experiment, a 3rd dimension of separation — Western blotting — could be performed on the PAGE gel, and the nitrocellulose membrane stained with an antibody specific to the target protein. That is illustrated in Figure \(\PageIndex{24}\).

Part A, isoelectric focusing, is followed by a PAGE gel (B). The red dots represent proteins that have undergone a post-translational modification in which a phosphate group has been added to tyrosine side chains (for example). Western blotting is performed in panel C, and staining is performed in panel D. The left blot in D uses an antibody that recognizes phosphorylated tyrosine side chains on protein. The right blot in D is sometimes called a Far Western blot. If the protein on the nitrocellulose membrane retains some 3D native structure or can be induced to refold, it can be probed on the blot by a protein that binds to the native form of the protein on the blot. In the example shown in panel D above, the p-Tyr-protein target on the nitrocellulose membrane recognizes a PTP-GST fusion protein. GST is a protein tag for detection. PTP (a catalytically inactive form) is a protein tyrosine phosphatase, an enzyme that, in its active form, hydrolyzes p-Tyr on specific phosphorylated target proteins.
Summary
(Summary written by Claude, Sonnet 4.6, Anthropic)
This chapter presents the principles and methods for purifying and analyzing proteins from complex biological mixtures, integrating physical chemistry, chromatographic theory, and electrophoretic physics into a coherent, practical framework.
Protein purification begins with the recognition that no single technique can isolate a target protein from thousands of cellular proteins in a single step; instead, sequential methods that exploit different physical or chemical properties — size, charge, hydrophobicity, or binding specificity — are combined into a purification scheme. Initial sample processing involves cell disruption (by freeze-thaw, sonication, French press, or detergent) followed by centrifugation to remove insoluble debris. Ammonium sulfate precipitation is frequently used as an early bulk purification step because it precipitates proteins in their native state at low cost and large scale, and the precipitate can subsequently be desalted by dialysis, which exploits size-based differential permeation through a semipermeable membrane. The effectiveness of each purification step is evaluated quantitatively by tracking total protein, total activity, specific activity, percent yield, and fold purification. A successful purification step increases specific activity (the ratio of total activity to total protein) substantially while accepting some loss in yield; if specific activity fails to increase or decreases, the step is introducing protein loss, denaturation, or cofactor removal.
Chromatography is the central tool of protein purification. Size exclusion chromatography (gel filtration) separates proteins by their effective hydrodynamic radius — the Stokes radius — rather than strictly by molecular weight, because elongated proteins experience more frictional resistance than compact globular proteins of equal mass. Proteins larger than the exclusion limit elute in the void volume (V₀), while smaller proteins partition into the internal bead volume (Vi) and elute later; the distribution coefficient K (ranging from 0 to 1) quantifies this partitioning. Ion exchange chromatography separates proteins by their net surface charge at a given pH: cation exchangers (negatively charged beads) bind positively charged proteins, while anion exchangers bind negatively charged ones; stepwise or gradient elution with increasing ionic strength releases proteins in order of their binding strength, with the most strongly charged eluting last. Hydrophobic interaction chromatography exploits the hydrophobic effect: proteins with exposed nonpolar surface bind to derivatized nonpolar beads at high salt concentrations, and are eluted as ionic strength decreases, in order of increasing hydrophobicity. Affinity chromatography provides the greatest selectivity by exploiting specific biological binding interactions — between an enzyme and a competitive inhibitor ligand, between a protein and an antibody to its sequence, or between a His₆ tag and Ni-NTA resin. In the Ni-NTA system, six histidine imidazole groups coordinate the nickel ion in an octahedral complex, and elution is achieved either by imidazole competition or by pH reduction. Protein tags (His₆, FLAG, HA, GST, GFP) engineered onto recombinant proteins enable generic affinity purification using commercially available resins and allow subcellular localization by fluorescence microscopy.
Electrophoresis separates proteins under the influence of an electric field. At constant velocity, the electrical force (F = QE) on a charged protein is balanced by the frictional force (F = fv), yielding an electrophoretic mobility U = Q/f = Q/(6πηRs) that depends on charge density — the ratio of charge to Stokes radius — not on charge or size alone. In free solution, both charge and shape heterogeneity confound molecular weight determination. SDS-PAGE resolves this by denaturing all proteins into rod-shaped SDS-protein complexes with uniform charge density (~1 SDS per 2 amino acids), so that mobility in the polyacrylamide gel is determined solely by the sieving effect of the pore matrix, giving a linear relationship between log molecular weight and relative migration distance (Rf). Running proteins under reducing and non-reducing SDS conditions reveals disulfide-linked subunit architecture. The discontinuous gel system (stacking gel at low acrylamide concentration and low pH, running gel at higher concentration and higher pH) concentrates proteins into thin bands at the gel interface via a Kohlrausch voltage discontinuity before resolution occurs in the running gel. Isoelectric focusing separates proteins in a pre-established pH gradient until each reaches its isoelectric point (pI), where its net charge is zero, and migration ceases. Two-dimensional electrophoresis combines isoelectric focusing (first dimension, by pI) with SDS-PAGE (second dimension, by molecular weight), resolving thousands of proteins from a cell lysate into a characteristic spot pattern. Western blotting transfers SDS-PAGE-separated proteins onto nitrocellulose, then uses primary antibodies directed against the target protein and enzyme-linked secondary antibodies to detect and quantify specific proteins in complex mixtures — the essential tool for identifying a single protein among thousands. These techniques, used individually and in combination, form the analytical foundation of modern protein biochemistry.
References
Molnar, C. and Gair, J. (2013) Antibodies. Chapter in Concepts in Biology, Published by B.C. Open Textbook Project. Available at: https://opentextbc.ca/biology/chapter/23-3-antibodies/
The Human Atlas Project. (2019) Methods. Available at: https://www.proteinatlas.org/learn/method
Uhlén M et al, 2015. Tissue-based map of the human proteome. Science
PubMed: 25613900 DOI: 10.1126/science.1260419
Thul PJ et al, 2017. A subcellular map of the human proteome. Science.
PubMed: 28495876 DOI: 10.1126/science.aal3321
Uhlen M et al, 2017. A pathology atlas of the human cancer transcriptome. Science.
PubMed: 28818916 DOI: 10.1126/science.aan2507
Ahern, K. and Rajagopal, I. (2019) Biochemistry Free and Easy. Published by Libretexts. Available at: https://bio.libretexts.org/Bookshelves/Biochemistry/Book%3A_Biochemistry_Free_and_Easy_(Ahern_and_Rajagopal)/09%3A_Techniques/9.04%3A_Gel_Exclusion_Chromatography.
Magdeldin, S. (2012) Gel Electrophoresis - Principles and Basics. Published by InTech under Creative Commons Attribution 3.0. Available at: https://pdfs.semanticscholar.org/4b93/70ac3946cec6e12c369679c4178a5ef38e61.pdf
Structural Biochemistry/Proteins/X-ray Crystallography. (2018, November 19). Wikibooks, The Free Textbook Project. Retrieved 15:40, August 17, 2019 from en.wikibooks.org/w/index.php?title=Structural_Biochemistry/Proteins/X-ray_Crystallography&oldid=3488057.
UCD: Biophysics 200A (2019) "NMR Spectroscopy vs X-ray Crystallography", Chapter published in Current Techniques in Biophysics. Published by Libretexts and available at: https://phys.libretexts.org/Courses/University_of_California_Davis/UCD%3A_Biophysics_200A_-_Current_Techniques_in_Biophysics/NMR_Spectroscopy_vs._X-ray_Crystallography
Wikipedia contributors. (2019, June 27). Protein purification. In Wikipedia, The Free Encyclopedia. Retrieved 23:32, July 28, 2019, from en.Wikipedia.org/w/index.php?title=Protein_purification&oldid=903657925
Wikipedia contributors. (2019, February 15). Fast protein liquid chromatography. In Wikipedia, The Free Encyclopedia. Retrieved 17:14, August 15, 2019, from en.Wikipedia.org/w/index.php?title=Fast_protein_liquid_chromatography&oldid=883530035
Wikipedia contributors. (2019, July 9). Protein mass spectrometry. In Wikipedia, The Free Encyclopedia. Retrieved 15:27, August 16, 2019, from en.Wikipedia.org/w/index.php?title=Protein_mass_spectrometry&oldid=905547289
Wikipedia contributors. (2019, July 8). Peptide synthesis. In Wikipedia, The Free Encyclopedia. Retrieved 06:13, August 17, 2019, from en.Wikipedia.org/w/index.php?title=Peptide_synthesis&oldid=905401648