
20.3: Plant Electron Transport and ATP Synthesis
- Page ID
- 15048


\( \newcommand{\vecs}[1]{\overset { \scriptstyle \rightharpoonup} {\mathbf{#1}} } \)
\( \newcommand{\vecd}[1]{\overset{-\!-\!\rightharpoonup}{\vphantom{a}\smash {#1}}} \)
\( \newcommand{\dsum}{\displaystyle\sum\limits} \)
\( \newcommand{\dint}{\displaystyle\int\limits} \)
\( \newcommand{\dlim}{\displaystyle\lim\limits} \)
\( \newcommand{\id}{\mathrm{id}}\) \( \newcommand{\Span}{\mathrm{span}}\)
( \newcommand{\kernel}{\mathrm{null}\,}\) \( \newcommand{\range}{\mathrm{range}\,}\)
\( \newcommand{\RealPart}{\mathrm{Re}}\) \( \newcommand{\ImaginaryPart}{\mathrm{Im}}\)
\( \newcommand{\Argument}{\mathrm{Arg}}\) \( \newcommand{\norm}[1]{\| #1 \|}\)
\( \newcommand{\inner}[2]{\langle #1, #2 \rangle}\)
\( \newcommand{\Span}{\mathrm{span}}\)
\( \newcommand{\id}{\mathrm{id}}\)
\( \newcommand{\Span}{\mathrm{span}}\)
\( \newcommand{\kernel}{\mathrm{null}\,}\)
\( \newcommand{\range}{\mathrm{range}\,}\)
\( \newcommand{\RealPart}{\mathrm{Re}}\)
\( \newcommand{\ImaginaryPart}{\mathrm{Im}}\)
\( \newcommand{\Argument}{\mathrm{Arg}}\)
\( \newcommand{\norm}[1]{\| #1 \|}\)
\( \newcommand{\inner}[2]{\langle #1, #2 \rangle}\)
\( \newcommand{\Span}{\mathrm{span}}\) \( \newcommand{\AA}{\unicode[.8,0]{x212B}}\)
\( \newcommand{\vectorA}[1]{\vec{#1}} % arrow\)
\( \newcommand{\vectorAt}[1]{\vec{\text{#1}}} % arrow\)
\( \newcommand{\vectorB}[1]{\overset { \scriptstyle \rightharpoonup} {\mathbf{#1}} } \)
\( \newcommand{\vectorC}[1]{\textbf{#1}} \)
\( \newcommand{\vectorD}[1]{\overrightarrow{#1}} \)
\( \newcommand{\vectorDt}[1]{\overrightarrow{\text{#1}}} \)
\( \newcommand{\vectE}[1]{\overset{-\!-\!\rightharpoonup}{\vphantom{a}\smash{\mathbf {#1}}}} \)
\( \newcommand{\vecs}[1]{\overset { \scriptstyle \rightharpoonup} {\mathbf{#1}} } \)
\(\newcommand{\longvect}{\overrightarrow}\)
\( \newcommand{\vecd}[1]{\overset{-\!-\!\rightharpoonup}{\vphantom{a}\smash {#1}}} \)
\(\newcommand{\avec}{\mathbf a}\) \(\newcommand{\bvec}{\mathbf b}\) \(\newcommand{\cvec}{\mathbf c}\) \(\newcommand{\dvec}{\mathbf d}\) \(\newcommand{\dtil}{\widetilde{\mathbf d}}\) \(\newcommand{\evec}{\mathbf e}\) \(\newcommand{\fvec}{\mathbf f}\) \(\newcommand{\nvec}{\mathbf n}\) \(\newcommand{\pvec}{\mathbf p}\) \(\newcommand{\qvec}{\mathbf q}\) \(\newcommand{\svec}{\mathbf s}\) \(\newcommand{\tvec}{\mathbf t}\) \(\newcommand{\uvec}{\mathbf u}\) \(\newcommand{\vvec}{\mathbf v}\) \(\newcommand{\wvec}{\mathbf w}\) \(\newcommand{\xvec}{\mathbf x}\) \(\newcommand{\yvec}{\mathbf y}\) \(\newcommand{\zvec}{\mathbf z}\) \(\newcommand{\rvec}{\mathbf r}\) \(\newcommand{\mvec}{\mathbf m}\) \(\newcommand{\zerovec}{\mathbf 0}\) \(\newcommand{\onevec}{\mathbf 1}\) \(\newcommand{\real}{\mathbb R}\) \(\newcommand{\twovec}[2]{\left[\begin{array}{r}#1 \\ #2 \end{array}\right]}\) \(\newcommand{\ctwovec}[2]{\left[\begin{array}{c}#1 \\ #2 \end{array}\right]}\) \(\newcommand{\threevec}[3]{\left[\begin{array}{r}#1 \\ #2 \\ #3 \end{array}\right]}\) \(\newcommand{\cthreevec}[3]{\left[\begin{array}{c}#1 \\ #2 \\ #3 \end{array}\right]}\) \(\newcommand{\fourvec}[4]{\left[\begin{array}{r}#1 \\ #2 \\ #3 \\ #4 \end{array}\right]}\) \(\newcommand{\cfourvec}[4]{\left[\begin{array}{c}#1 \\ #2 \\ #3 \\ #4 \end{array}\right]}\) \(\newcommand{\fivevec}[5]{\left[\begin{array}{r}#1 \\ #2 \\ #3 \\ #4 \\ #5 \\ \end{array}\right]}\) \(\newcommand{\cfivevec}[5]{\left[\begin{array}{c}#1 \\ #2 \\ #3 \\ #4 \\ #5 \\ \end{array}\right]}\) \(\newcommand{\mattwo}[4]{\left[\begin{array}{rr}#1 \amp #2 \\ #3 \amp #4 \\ \end{array}\right]}\) \(\newcommand{\laspan}[1]{\text{Span}\{#1\}}\) \(\newcommand{\bcal}{\cal B}\) \(\newcommand{\ccal}{\cal C}\) \(\newcommand{\scal}{\cal S}\) \(\newcommand{\wcal}{\cal W}\) \(\newcommand{\ecal}{\cal E}\) \(\newcommand{\coords}[2]{\left\{#1\right\}_{#2}}\) \(\newcommand{\gray}[1]{\color{gray}{#1}}\) \(\newcommand{\lgray}[1]{\color{lightgray}{#1}}\) \(\newcommand{\rank}{\operatorname{rank}}\) \(\newcommand{\row}{\text{Row}}\) \(\newcommand{\col}{\text{Col}}\) \(\renewcommand{\row}{\text{Row}}\) \(\newcommand{\nul}{\text{Nul}}\) \(\newcommand{\var}{\text{Var}}\) \(\newcommand{\corr}{\text{corr}}\) \(\newcommand{\len}[1]{\left|#1\right|}\) \(\newcommand{\bbar}{\overline{\bvec}}\) \(\newcommand{\bhat}{\widehat{\bvec}}\) \(\newcommand{\bperp}{\bvec^\perp}\) \(\newcommand{\xhat}{\widehat{\xvec}}\) \(\newcommand{\vhat}{\widehat{\vvec}}\) \(\newcommand{\uhat}{\widehat{\uvec}}\) \(\newcommand{\what}{\widehat{\wvec}}\) \(\newcommand{\Sighat}{\widehat{\Sigma}}\) \(\newcommand{\lt}{<}\) \(\newcommand{\gt}{>}\) \(\newcommand{\amp}{&}\) \(\definecolor{fillinmathshade}{gray}{0.9}\)Search Fundamentals of Biochemistry
-
Outline the Photosynthetic Electron Transport Chain:
-
Describe the linear flow of electrons from photosystem II (PSII) to photosystem I (PSI) through intermediates (plastoquinone, cytochrome b6f, plastocyanin, and ferredoxin) and explain how these events drive the synthesis of NADPH and ATP.
-
-
Explain the Function and Mechanism of Cytochrome b6f:
-
Detail the role of cytochrome b6f as a rate-limiting enzyme in electron transport, its operation via the Q cycle, and its contribution to the generation of the proton gradient across the thylakoid membrane.
-
-
Differentiate Linear and Cyclic Electron Flow:
-
Compare and contrast the pathways and outcomes of linear photophosphorylation versus cyclic electron flow, emphasizing the conditions under which each pathway is favored and how they affect the ATP/NADPH ratio.
-
-
Interpret Structural Models of Photosynthetic Complexes:
-
Use interactive models (e.g., iCn3D visualizations) to analyze the structural features of key complexes such as the cytochrome b6f complex, the PSI-LHCI supercomplex, and the NDH–PSI–LHCI-2 supercomplex, linking structure to function.
-
-
Assess the Role of Light-Harvesting Complexes (LHCs):
-
Explain how the spatial arrangement and phosphorylation state of LHCII proteins regulate the distribution of excitation energy between PSI and PSII, particularly under varying light conditions.
-
-
Relate Electron Flow to Proton Gradient and ATP Synthesis:
-
Illustrate how electron transfer events are coupled to proton translocation and how the resulting electrochemical gradient is harnessed by the chloroplast ATP synthase to synthesize ATP.
-
-
Examine the Structure and Regulation of Chloroplast ATP Synthase (CF1FO):
-
Describe the rotary mechanism of ATP synthase, focusing on the role of the γ subunit in redox regulation, and explain how light-driven changes modulate its activity to prevent wasteful ATP hydrolysis at night.
-
-
Analyze the Integration of Electron Transport with Carbon Metabolism:
-
Evaluate how the electron transport chain interfaces with carbon fixation (via Rubisco) and how feedback mechanisms regulate the balance between electron transport and the demands of the dark reactions.
-
-
Explore the Mechanism of Redox Control in Photosynthesis:
-
Discuss how redox-sensitive processes (e.g., the activation/inactivation of LHCII kinase and the reduction of thioredoxin) serve as rapid feedback mechanisms to adjust photosynthetic efficiency and protect the system from photodamage.
-
-
Apply Kinetic and Regulatory Concepts to Model Photosynthetic Efficiency:
-
Use models (such as the transistor analogy for cytochrome b6f regulation) to predict how changes in light intensity affect electron transport kinetics, excitation balance, and overall photosynthetic performance.
-
These learning goals are designed to help students integrate structural, mechanistic, and regulatory perspectives of the photosynthetic machinery and understand how these systems work together to support energy conversion in plants.
Introduction
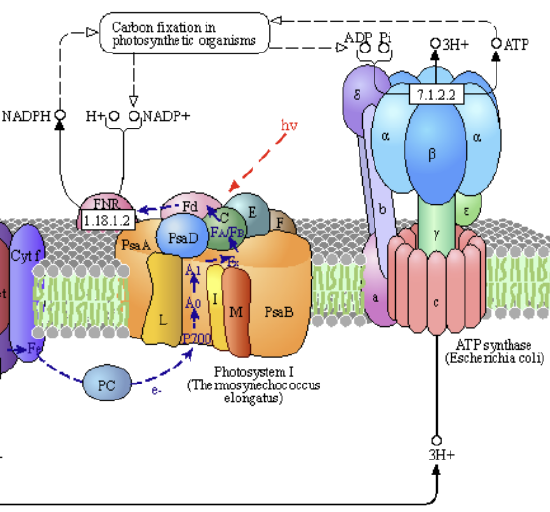
In the previous sections, we studied light absorption by chlorophylls, the transfer of energy to the reaction center of photosystem II, the oxidation of H2O by the oxygen-evolving complex (OEC), and the transfer of electrons from these events to the lipophilic electron carrier, plastoquinone. Now, we are ready to see how the process continues as electrons are passed on from reduced plastoquinone to the cytochrome b6f complex, through photosystem I (which has no OEC), and on to the terminal electron acceptor NADP+, which forms NADPH. This is used for the reductive biosynthesis of glucose after fixation of atmospheric CO2 by ribulose bisphosphate carboxylase (RuBisCo). As we saw in mitochondrial electron transport, the passage of electrons is accompanied by the movement of protons from the lumen to the stroma, with the ultimate collapse back into the lumen through a rotary ATP synthase, forming the ATP required for reductive biosynthesis. Figure \(\PageIndex{1}\) reviews the light reactions of photosynthesis again.
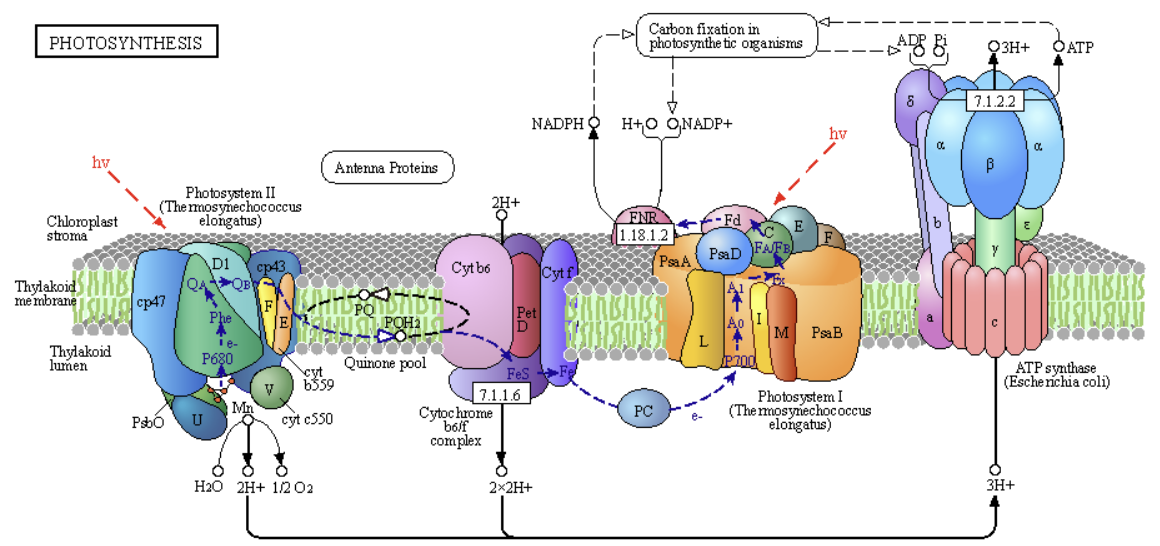
The pathway shows a "linear" sequential flow of electrons from:
- PSII to a mobile electron carrier, plastoquinone (PQ/PQH2), then to
- the membrane complex Cytochrome b6f complex to the mobile carrier plastocyanin (PC), then to
- PSI to the mobile carrier flavodoxin (Fd), then to
- FNR (Ferredoxin-NADP⁺ Reductase (FNR), a peripheral membrane protein, passes electrons from bound reduced flavodoxin to the mobile electron acceptor, NADP+.
Accompanying this linear flow of electrons is a linear flow of protons (H+), forming a proton gradient that collapses through ATP synthase to produce ATP. Hence, these linear flows of electrons and protons couple NADPH and ATP synthesis. This sequence of events is also called linear photophosphorylation, which leads to an ATP/NADPH ratio ≈ 1.3.
We'll see an alternative "circular" electron flow below and see the advantages of each.
Cytochrome b6f
This complex moves electrons from the mobile lipophilic electron carrier reduced plastoquinol (PQH2), an isoprenoid quinone, to the mobile Cu-containing protein plastocyanin, which plays an analogous role to the mobile protein carrier in mitochondrial electron transport, cytochrome C. It catalyzes the rate-limiting step in electron transport in the light reactions. Figure \(\PageIndex{2}\) shows an interactive iCn3D model of the spinach plastocyanin (1AG6)
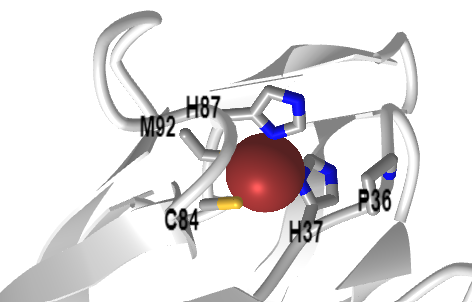
 Figure \(\PageIndex{2}\): Spinach plastocyanin (1AG6). (Copyright; author via source). Click the image for a popup or use this external link: https://structure.ncbi.nlm.nih.gov/i...DwSDDrYMUb9Xn7
The complex that mediates electron transfer between reduced plastoquinone and the protein plastocyanin, cytochrome b6f, is centrally positioned between the two photosystems. In addition, it moves 2 H+s from the stroma into the lumen. These are joined by 2 H+s from water oxidation by the OEC (on the luminal side of PSII) to create a transmembrane proton gradient, which powers ATP synthesis.
Electron transfer with cytochrome b6f occurs through the quinol (Q) cycle, similar to Complex III in mitochondrial electron transport; therefore, we will not delve into the details here. Figure \(\PageIndex{3}\) shows a summary diagram with electron and proton flow.
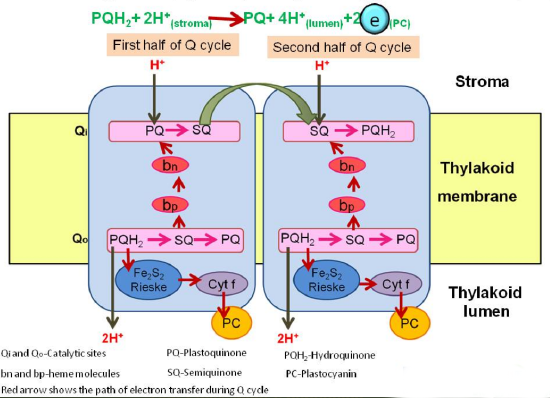
Figure \(\PageIndex{4}\) shows another version of the Q cycle as an alternative representation.

The left box shows the b6f complex transfers two protons (green arrows) per electron transferred (blue arrows) along high (Fe2S2 cluster, cytochrome f) and low potential chains (bl, bh, ci hemes) as well as Quinol (QH2) oxidation at Qo site, Quinone (Q) reduction at Qi site. The right structure depicts haems b (purple), ci and f (red), Fe2S2 cluster (yellow and orange ball-and-stick model), cytochrome b6 (cyan), subunit IV (blue), Rieske subunit (yellow), cytochrome f (red), PetG, L, M and N subunits (green). Magnification of Qi site comprising bh and ci haems.
Both cytochrome bc1 and cytb6f are dimeric complexes with 2 Fe2S2 clusters, two cytochrome bs, and a cytochrome c. The cytb6f complex also contains 9-cis β-carotene and an additional c1 heme. The electrons move from PQH2 through the complex in a similar fashion to that of the bc1 complex.
PQH2 is oxidized at the Qp site with a bifurcation of electrons:
- one electron moves through the high-potential Fe2S2 center and cyt f pathway (bottom left in pathway diagram of Figure 3), with the electron moving to the soluble peripheral protein plastocyanin and one to photosystem I.
- the other moves through the low potential bl, bh, ci hemes pathway (top left in pathway diagram of Figure 3), with the electron moving to a plastoquinone at the Qn site near the stroma. A second round of oxidation of PQH2 at the Qp site eventually donates another electron to a plastoquinone-. which regenerates PQH2 after addition of 2 H+ from the stroma.
Two successive oxidations of PQH2 result in twice the number of protons moving into the lumen, and in the process, 2 H+ ions move into the lumen. Cytochrome b6f is also a redox sensor of the plastoquinol/plastoquinone pool's status.
Figure \(\PageIndex{5}\) shows an interactive iCn3D model of the spinach cytochrome b6f complex (6RQF)
.png?revision=1)
Figure \(\PageIndex{5}\): Spinach cytochrome b6f complex (6RQF). (Copyright; author via source). Click the image for a popup or use this external link: https://structure.ncbi.nlm.nih.gov/i...tgUhjekB4Tndw6
The region away from the red leaflet represents the lumen side of the complex. The FeS cluster and heme C are in the luminal domains. The coloring scheme is as follows:
- cytochrome bcf subunits 4, 5, 6, 7, and 8: light gray
- cytochrome b6: dark gray
- cytochrome b6 FeS subunit: plum
- cytochrome F: cyan
- chlorophylls: orange spacefill, labeled
- FeS clusters: CPK spacefill, labeled
- HEC - Heme C: CPK spacefill, labeled
- heme - porphoryin IX containing Fe: yellow spacefill
Cytochrome b6f is the rate-limiting step for electron flow, but what is its role in regulating the photosynthetic pathway (light reaction plus the dark reaction of carbon metabolism? Data suggest that the complex regulates electron transport in low light conditions but affects a switch to carbon metabolism under saturating light. We'll see that below when we discuss circular electron flow.
Plant photosystem I-LHCI super-complex
If the goal of the photosystem complexes is to transduce light energy delivered by photons into electrons that can be used for reductive biosynthesis of glucose from atmospheric carbon capture of CO2, then PSI is quite amazing. It has a "quantum efficiency" close to 1, which implies that one absorbed photon produces 1 electron that can be used to reduce NADP+. This occurs because the transfer of photon energy to other molecules in PSI is so rapid compared to non-radiative decay processes for the excited-state chlorophylls.
The same excitation and electron (charge) transfer process we saw in PSII occurs in PSI, with the chlorophyll in the reaction center involved in charge transfers. The light-absorbing molecules of PSI enable light to be absorbed at the far red end of the spectrum. The complex contains 16 proteins, 155 chlorophyll molecules, and 35 carotene derivatives. As with PSII, there is a core complex that is similar to cyanobacterial PSI. The supercomplex has, in addition, light-harvesting complex I proteins surrounding one side of the complex (looking down on it), which comprise four LHCI proteins (Lhca 1-4), allowing for increased light absorption. They have 57 chlorophylls and 13 carotene derivatives.
The apoproteins that bind the chlorophylls, including the LHCI proteins, have similar but slightly different topologies, allowing for tuning the absorbance spectra of the bound chromophores. Seven of the chlorophylls, when bound, have local environments that allow the absorption of far-red light. These are not found in PSII. Far red light would be more abundant in the low parts of the plant canopies, as photons of lower wavelengths would be more filtered out by upper leaves in the canopy.
Due to the complexity of PSI, we will provide several different iCn3D models to illustrate the various features of the photosystem I-LHCI super-complex. As with PSII, PSI has a core surrounded by a light-harvesting complex (LHCI). Figure \(\PageIndex{6}\) shows an interactive iCn3D model of the Plant (pea) photosystem I-LHCI super-complex (4XK8)
.png?revision=1)
Figure \(\PageIndex{6}\): C. (Copyright; author via source). Click the image for a popup or use this external link: https://structure.ncbi.nlm.nih.gov/i...uWBzFrVBUDHHQ6 (long load time)
Again, the red leaflet represents the lumen side of the complex, while the gray represents the chlorophyll and other lipid molecules in the membrane.
Figure \(\PageInde.x{7}\) shows an interactive iCn3D model highlighting the chlorophylls, beta carotene derivatives, and FeS clusters of Plant photosystem I-LHCI super-complex (4XK8)
.png?revision=1&size=bestfit&width=395&height=204)
Figure \(\PageIndex{7}\): Chlorophylls, beta carotene derivatives, and FeS clusters of Plant photosystem I-LHCI super-complex (4XK8). (Copyright; author via source). Click the image for a popup or use this external link: https://www.ncbi.nlm.nih.gov/Structu...BecS9cgNqdr8J6 (long load time)
The proteins in the complex are shown in gray cartoons. Chlorophylls A and B are shown in green and teal spacefill, respectively. Beta-carotene derivatives are shown in orange spacefill.
Figure \(\PageIndex{8}\) shows an interactive iCn3D model of the ApoA1 protein with surrounding chlorophyll and other components from plant photosystem I-LHCI super-complex (4XK8)
.png?revision=1)
Figure \(\PageIndex{8}\): ApoA1 protein with surrounding chlorophyll and other components from plant photosystem I-LHCI super-complex (4XK8). (Copyright; author via source). Click the image for a popup or use this external link: https://structure.ncbi.nlm.nih.gov/i...L6tsJ3oMDZ2YQA (long load time)
ApoA1 is shown in a cartoon and colored according to hydrophobicity. The chlorophylls, carotenes, and other components within 5 Å are shown in red. Rotate the image to see how the chlorophyll and other lipids encircle the membrane protein components.
Figure \(\PageIndex{9}\) shows an interactive iCn3D model of the Plant (pea) photosystem I-LHCI super-complex, highlighting LHCIs (4XK8)
_photosystem_I-LHCI_super-complex_highlighting_LHCIs_%25C2%25A0(4XK8).png?revision=1&size=bestfit&width=323&height=272)
Figure \(\PageIndex{9}\): Plant (pea) photosystem I-LHCI super-complex highlighting LHCIs (4XK8). (Copyright; author via source). Click the image for a popup or use this external link: https://structure.ncbi.nlm.nih.gov/i...9vHynkRTLxAct7 (long load time)
The LHCI subunits (Lhca 1-4) are shown in alternating magenta and cyan cartoon structures surrounding one side of the core complex. The view in the model above is a top-down view.
We discussed in Chapter 20.1 that PSI absorbance is tilted toward the red end of the spectra, with the effective absorbance ratio over a broad wavelength range for the two photosystems, PSI/(PSI+PSII), deviating from around 0.5 at the red/far red end of the spectrum (670-730 nm), where the ratio is close to 1. When exposed to far-red light, the systems move to state I. In this state, the major mobile antenna proteins (LHCIIs) move to PSII to restore a "photoabsorption" balance. When exposed to light depleted in the high end of visual spectra, the system moves to state II, where mobile LHCIIs move to PSI.
The location of LHCs is regulated by the phosphorylation of LHCs, which is controlled by the levels of plastoquinone, making excellent biological sense. When the concentration of plastoquinones in the reduced state, PQH2 (plastoquinol), is high, it would be optimal to increase the activity of PSI to relieve the high concentration of the substrate for cyto b6f and shift the system to higher PSI activity and continue electron flow. This regulation is mediated by the phosphorylation of LHCs by LHCII kinase (a Ser/Thr kinase), which is activated by high concentrations of reduced PQH2. Phosphorylation of LHCs leads to their movement from PSII to PSI. When the oxidized form of plastoquinone is high, LHCII kinase is inactivated by dephosphorylation, causing the mobile LHC to move back to PSII to increase output (PQH2) from PSII. These events occur in low light. In high-light conditions, when the system is functioning at a high level, the LHCII kinase is inhibited by stromal thioredoxin. Specifically, the phosphorylation status of Lhcb1 and Lhcb2 in LHCII homo- or heterotrimers determines the movement between PSII and PSI. The chloroplastic serine/threonine-protein kinase (STT7, also known as STN7) is another LHCII kinase.
Recent Updates: 4.7.25
Linear vs Cyclic Flow of Electrons in Photosynthesis
Sometimes, the flow of electrons from PSI does not go through ferredoxin to NADP+ using Ferredoxin-NADP⁺ Reductase (FNR). Instead, the electrons are repeatedly shunted repeatedly from reduced ferredoxin (FdH2) back to PSI through cytochrome b6f in a circular flow, which is often called cyclic photophosphorylation. If this happens, NADPH is not made. Yet, protons continue to flow across the membrane, leading to increased ATP synthesis. Here are several reasons this occurs:
- NADPH is in excess, and it's not needed
- NADP+ is low and must be regenerated
- prevention of damage to the photosystems by excess light
This cyclic flow essentially uncouples NADPH and ATP production, allowing the continuous production of ATP.
The actual return of electrons in this circular flow occurs through a thylakoid membrane enzyme called NAD(P)H dehydrogenase (Ndh). This enzyme is structurally very similar to mitochondrial Complex I, also known as NADH:ubiquinone oxidoreductase or Type I NADH dehydrogenase. As the name implies, Complex I binds NADH and passes electrons from it in a dehydrogenation reaction to another mobile electron carrier, ubiquinone (UQ), which forms ubiquinol (UQH2).
NADH + ubiquinone (UQ) ↔ NAD+ + UQH2
The chloroplastic Ndh, however, does not bind NADPH, which is confusing given the name. Rather, it binds reduced ferredoxin from PSI and transfers electrons to plastoquinone (PQ), which, when reduced, can pass electrons to Cyto b6f and then to PSI. Ferredoxin is considered the principal electron donor. The redox state does not change in a net fashion. Note that the cyclic electron pathway, once started, does not need PSII, so water oxidation is not needed. Hence, the enzyme Ndh binds ferredoxin and plastquinones/ols at distinct sites.
Essentially, FNR makes NADPH and ATP for biosynthesis, while Ndh boosts ATP and helps modulate the NADPH/ATP ratio.
Spinach NDH has many subunits. Ndh A-G are in the membrane arm and are similar to subunits (ND1-ND6) in the analogous arm of mitochondrial complex I. Ndh H-K in the peripheral arm are similar to the Q (ubiquinone) reduction part of complex I. Instead of having a binding site for NADH, it interacts with ferredoxin. Other subunits include NdhL-O and S-V. NdhC, I, J, L, M, O, and U form a plastoquinone binding site. Other subunits (PnsL1–PnsL5 and PnsB1–PnsB5) are found in the spinach chloroplast NDH but not in cyanobacteria.
NDH used for cyclic electron flow is part of a much larger NDH–PSI–LHCI-2 supercomplex. The structure of a larger supercomplex in spinach, composed of NDH, PSI, and LHCI-2, determined by cryoelectromicroscopy, is shown in Figure \(\PageIndex{10}\) below.

Figure \(\PageIndex{10}\): Cryo-EM structure of the NDH–PSI–LHCI-2 supercomplex from S. oleracea. Introini, B., Hahn, A. & Kühlbrandt, W. Cryo-EM structure of the NDH–PSI–LHCI supercomplex from Spinacia oleracea. Nat Struct Mol Biol (2025). https://doi.org/10.1038/s41594-024-01478-1. Creative Commons Attribution 4.0 International License. http://creativecommons.org/licenses/by/4.0/.
Lateral (a,b) views of the cryo-EM map of the supercomplex (contour level: 0.38). Shades of cyan (module SubA, NdhH–NdhO) and magenta (module SubE, NdhU) indicate the NDH peripheral arm. The membrane arm is drawn in shades of blue (module SubM, NdhA–NdhG). Lumenal SubL subunits (PnsL1–PnsL5) are shown in shades of purple, and subunits of the stromal SubB (PnsB1–PnsB5) are in shades of gray. PSI–LHC-2 is colored in shades of green. Cryo-EM densities of lipids are salmon (PG), violet (MGDG), pink (SQDG) or green (DGDG). Carotenoids are orange, and chlorophylls are bright green. The detergent belt is transparent gray.
Figure \(\PageIndex{11}\) below shows a proton flow model for the spinach complex—Subunits A-G form transmembrane modules. B, D, and F form antiporters subunits for H+ translocation, and each has two discontinuous helices, TMH7 and TMH12. These homologous antiporter structures are also found in mitochondrial Complex I. Subunits A, C, E, and G from the plastoquinone binding site and the early part of the proton translocation machinery.

Figure \(\PageIndex{11}\): Proposed proton transfer path in the membrane arm of S. oleracea NDH. Introini, B. et al., ibid.
Side view of NDH. From right to left, NdhA helices and NdhH and NdhK loops contributing to the formation of the platoquinon (PQ)-binding pocket (gray surface), NdhC TMH1–TMH2, NdhG TMH3, NdhE TMH2–TMH3, and discontinuous TMHs of NdhB, NdhD and NdhF are shown as solid cylinders. Other subunits are shown as outlines. The 4Fe–4S N2 cluster (upper right) is indicated. Charged residues of NdhA–NdhG and residues involved in proton translocation that are conserved between spinach NDH and A. thaliana complex I are shown as stick models and are color-coded. Positively charged residues are blue, negatively charged residues are red and key aromatic residues are white. PQ pocket, voids, channels, and depressions within NDH are likely to be relevant for proton translocation and are shown as gray surfaces. The light-blue arrow delineates a continuous hydrophilic path from the Q-binding site to NdhF. Stromal half-channels above NdhB, NdhD and NdhF are indicated as dotted cyan arrows and labeled 1–3; the channel between NdhB and NdhD (magenta) is labeled 4.
Figure \(\PageIndex{12}\) shows an interactive iCn3D model the complex of NDH and the PSI-LHCI-2 supercomplex from S. oleracea (9GRX).
_.png?revision=1&size=bestfit&width=517&height=262)
Figure \(\PageIndex{12}\): NDH–PSI–LHCI-2 supercomplex from S. oleracea (9GRX) (Copyright; author via source). Click the image for a popup or use this external link: ttps://www.ncbi.nlm.nih.gov/Structur...kJXW3YGGrM9sQA
NdhP, D, and B are the antiporters involved in H+ translocation. Ndh H and K show the region of the PQ binding pocket. Yellow highlights show FeS complexes (spacefill)
The charged side chains in Complex I involved in proton flow are also found in NDH, supporting the idea that NDH in chloroplasts and Complex I in mitochondria have identical functions resulting from homologous structures.
Electronic regulation of an enzyme complex
- Click here
-
Johnson and Berry have analyzed electron flow with carbon metabolism in a fashion analogous to transistors in a circuit board, as illustrated in the figure below.

Electron transport system as an electrical circuit (and associated text below). Johnson and Berry. Photosynthesis Research (2021) 148:101–136. Creative Commons Attribution 4.0 International License. http:// creativecommons.org/ licenses/by/4.0/. They define a transistor as a regulated circuit element that utilizes variable conductance to control the flow of current. The linear flow of electrons from water to reductant is viewed as a light-driven current under the control of many regulatory feedbacks stemming from carbon metabolism. In limiting light, Cyt b6f presents maximal conductance to flow, and feedback from carbon metabolism adjusts the excitation of PS I and PS II in such a way as to balance the relative rates of linear and cyclic electron flow to the NADPH, Fd, and ATP requirements of the sinks. When the light becomes saturating, feedback from carbon metabolism also decreases the apparent conductance of Cyt b6f, controlling the linear flow of electrons through the plastoquinone pool and the associated flow of protons into the thylakoid lumen. In this way, the regulation of Cyt b6f simultaneously permits efficient photosynthesis and protects the system from photodamage.
This model is organized around the idea that the distribution of excitation between PS II and PS I is regulated in such a way as to minimize losses of absorbed light and maximize potential electron transport through Cyt b6f. The expression for the potential electron transport rate has the form of a Michaelis-Menten expression for a single substrate (i.e., light). Still, it describes the kinetic behavior of the entire electron transport chain (i.e., including both photochemical and biochemical reactions). It predicts that electron transport has a hyperbolic dependence on irradiance, with maximum efficiency realized at the limit where absorbed irradiance approaches zero and maximum speed realized at the limit where absorbed irradiance approaches infinity.
The trade-off between the speed and efficiency of potential electron transport is driven by the need for the supplies of reduced plastoquinone and oxidized plastocyanin to be balanced to sustain Cyt b6f turnover at the maximum catalytic rate. This causes progressive closure of the PS II and PS I reaction centers, with PS II accumulating in a reduced state and PS I in an oxidized state. As the excitation pressure on PS II and PS I increases, the closure of the reaction centers causes the photochemical yields of PS II and PS I, as well as the absorbed quantum yield, to decrease as the potential electron flow through Cyt b6f and the potential photosynthetic rate increase.
The key prediction of the expression for the potential electron transport rate is that the maximum activity of Cyt b6f defines the upper limit for the theoretical maximum speed of electron transport. The expressions describing feedback control over Cyt b6f activity are based on the idea that Cyt b6f functions like a transistor, i.e., a component of an electrical circuit that uses variable conductance to control the flow of current.
The fact that Cyt b6f can modulate its conductance to linear electron flow within milliseconds of a perturbation in light suggests that photosynthetic control is the first line of defense against overexcitation, protecting the acceptor side of PS I from being flooded with highly reduced intermediates.
In response to a sustained increase in light, the induction of photosynthetic control is followed by the induction of PQN. As NPQ alleviates the electron overpressure in the PQ pool, photosynthetic control progressively relaxes. The two forms of regulation gradually settle into a steady state at the new light intensity. This interaction appears to enable electron transport to proceed at the Cyt b6f-limited rate under low light intensities, then smoothly transitions to the Rubisco-limited rate once the light intensity is high enough to become saturating. It also appears to enable photosynthesis to operate safely and efficiently in a wide range of biochemical environments, from those characteristic of natural variation in photosynthetic capacity (with balanced electron transport and carbon metabolism) to those resulting from genetic manipulations (with imbalances in electron transport and carbon metabolism).
In this framework, the excitation balance of PS II and PS I, as well as the maximum activities of Cyt b6f and Rubisco, emerge as key limits on system dynamics. For example, the trade-off between the speed and efficiency of electron transport is shown to be controlled by the excitation balance of PS II and PS I, as well as the maximum activity of Cyt b6f. The development of PQN is shown to be controlled by the excitation balance of PSII and PSI, as well as the demand for linear electron flow (LEF) through the light reactions and circular electron flow (CEF) around PSI. The onset of photosynthetic control depends on the maximum activities of Cyt b6f and Rubisco.
Chloroplast ATP synthase - CF1FOATPase
Finally, let's look at the ATP synthase in chloroplasts. It is similar in structure and function to mitochondrial FoF1ATPase so we won't spend much time on the mechanism. Like its mitochondrial counterpart, it is a rotary enzyme that transduces the free energy of a proton gradient collapse into chemical energy in the form of ATP. One difference is that light levels should regulate the rotary enzyme, decreasing its activity at night. This is accomplished in higher plants by conversion between a reduced and oxidized state, an effective redox switch, in one subunit (γ) of the ATP synthase. Deactivation is important at night, as if the rotary enzyme runs in reverse, ATP hydrolysis will occur.
Figure \(\PageIndex{13}\) shows an interactive iCn3D model of the reduced R1 state of chloroplast ATP synthase (R1, CF1FO) (6VON). It should look familiar to you given its similarity to mitochondrial ATP synthase.
.png?revision=1)
Figure \(\PageIndex{13}\): Reduced R1 state of chloroplast ATP synthase (R1, CF1FO) (6VON) (Copyright; author via source). Click the image for a popup or use this external link: https://www.ncbi.nlm.nih.gov/Structu...HT8YZefdWN5XM7 (long load)
- alpha - light green
- beta - dark green
- gamma - yellow
- gamma - crimson
- epsilon - indigo
- b - blue
- b' - light blue
- a - light pink
- c ring - purple
- ATP - spacefill, cyan
- TENTOXIN (TTX) - space fill gray
- ADP - spacefill magenta
In the oxidized state, a disulfide in the γ subunit inhibits torsion by stabilizing two β hairpins. This constraint is relieved on reduction, and rotation is enhanced. In the reduced structure, tentoxin, an uncompetitive inhibitor, is present, which allowed the structure to be determined.
below Yang, JH., Williams, D., Kandiah, E. et al. Structural basis of redox modulation on chloroplast ATP synthase. Commun Biol 3, 482 (2020). https://doi.org/10.1038/s42003-020-01221-8. Creative Commons Attribution 4.0 International License. http://creativecommons.org/licenses/by/4.0/.
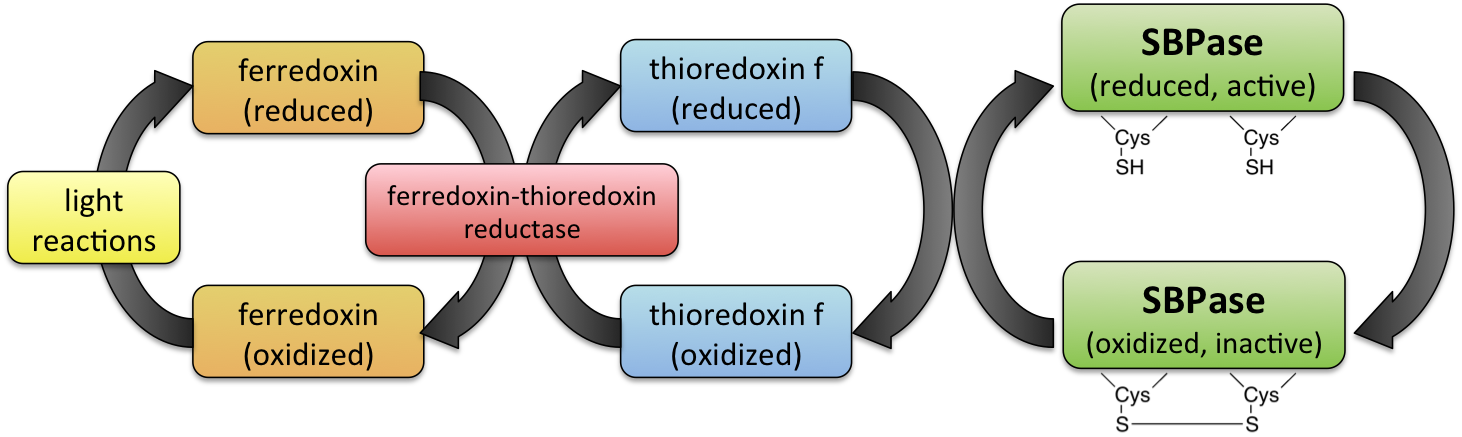
At night, the enzyme is in the low-activity form. When light becomes available in the day, the pH gradient collapse leads to the release of tightly bound ATP from the oxidized state of the enzyme. PSI can engage in photon-induced electron transfer to ferredoxin. This binds to NADP reductase, leading to the formation of NADPH. These processes are illustrated in Figure \(\PageIndex{14}\).
Increased reduced ferredoxin leads to the formation of reduced thioredoxin, a small redox protein involved in redox signaling and protection of cells from oxidative stress. A similar process activates the enzyme sedoheptulose-1,7-bisphosphatase (SBPase), found in the dark reaction of the Calvin cycle in photosynthesis. Its activation is illustrated in Figure \(\PageIndex{15}\).
Reduced thioredoxin also reduces and activates chloroplastic ATP synthase.
Figure \(\PageIndex{16}\) the activities and structures of the ATP synthase (CF1FO)

Panel a: For the experiments, purified CF1FO was reconstituted into a liposome (orange) mixed with phosphatidylcholine and phosphatidic acid lipids. The generated pH gradient across the membrane drove the reconstituted CF1FO to synthesize ATP molecules, which were detected using a luciferin/luciferase assay (green). Val indicates valinomycin.
Pane b: The activity of the enzyme is shown in the reduced state (in the presence of dithiothreitol - DTT, blue curve), oxidized state (in the presence of iodosobenzoate - IBZ, orange curve, and with no additive (green curve). Note that the activity is reduced by about 80% in the oxidized state.
Panel c: The images are from Cryo-EM density maps of the oxidized and reduced forms of the CF1FO. The color codes are as follows: α (light green), β (dark green), δ (yellow), bb' (blue and light blue), γ (crimson), ε (indigo), a (light pink), and c ring (purple). R indicates a reduced state, and O indicates an oxidized state. The three-dimensional (3D) reconstructions are categorized into three rotary states (1, 2, and 3). The upper insets are the density maps of the F1 domains.
Figure \(\PageIndex{17}\) shows the conformation changes in the γ subunit between the oxidized and reduced forms.

Panel a: Structures of the reduced (light blue) and oxidized (orange) γ subunits. Two β hairpin structures (from γGlu238 to γLeu282) are shown in light green, and the two cysteines of the redox switch are shown in yellow in circular, enlarged views. The diagram on the right shows the topology of the two β hairpin structures.
Panel b Superposition of the reduced and oxidized γ subunits (RMSD 1.016 Å). The two β hairpins are shown in light blue and orange for the reduced and oxidized forms, respectively. Other regions are shown in white.
Panel c Interaction networks of the β hairpin 2 and βDELSEED motif. The left and right panels are the reduced (γ subunit in light blue) and oxidized (γ subunit in orange) forms. Light green represents the β hairpin 2, dark green for the β subunit, and yellow for the βDELSEED motif. The distances connecting the residues of the γ coiled-coil (γArg73, γGln76, and γGlu77) with the βGlu412 are labeled.
Panel d Interaction of the EDE motif with the γ subunit. The EDE motif (yellow) does not interact with any part of the reduced γ subunit but forms an extensive interaction network with its neighborhood when the γ subunit is oxidized.
Figure \(\PageIndex{18}\) shows a cartoon model illustrating the structures of the overall oxidized and reduced states of ATP synthase

Panel a: This shows a cartoon schematic of the redox modulation. The upper and lower models are the reduced and oxidized states, respectively. Color codes are the same as in Fig. 1c, and the β hairpin structures of the γ subunit are shown in light green. The two redox states are aligned in the same view.
Pane b: At night, no energy input from light is available for the photosynthetic electron transport chain, and thus, no electrochemical potential (ΔΨ) and proton gradient (ΔpH) are generated. The oxidized γ subunit prevents CF1FO from hydrolyzing ATP. During the day, light induces charge separation, developing an electrochemical potential across the membrane. Although the CF1FO begins to synthesize ATP molecules, the γ subunit is still oxidized while ΔΨ is small. The rate of ATP synthesis is not at its maximum. At sunrise, thioredoxin subsequently reduces the γ subunit, fully activating CF1FO. The molecular motor, consisting of the γ-ε central shaft and the c14-ring, can rotate at full speed to maximize its ATP synthesis activity. Three ATP molecules per rotation of the c14 ring are produced. At sunset, the membrane becomes de-energized, resulting in small ΔΨ and ΔpH, and ATP hydrolysis occurs. To prevent ATP loss from excess ATP hydrolysis, the γ subunit is then oxidized again. Light regulation and redox modulation on the CF1FO will cycle daily.
Summary
This chapter integrates detailed mechanistic insights and structural perspectives of the photosynthetic electron transport chain, emphasizing both linear and cyclic pathways. Designed for junior and senior biochemistry majors, the chapter provides an in-depth look at the flow of electrons and protons that drive energy conversion in chloroplasts.
Key Points:
-
Linear Electron Flow:
-
Electrons are sequentially transferred from PSII through a series of mobile carriers—plastoquinone, cytochrome b6f, plastocyanin, and ferredoxin—to PSI.
-
The terminal acceptor, NADP⁺, is reduced to NADPH, which along with ATP, fuels the reductive biosynthesis of glucose during the Calvin cycle.
-
This electron movement is coupled to the translocation of protons, establishing an electrochemical gradient that powers ATP synthase.
-
-
Cytochrome b6f Complex and the Q Cycle:
-
The cytochrome b6f complex serves as a critical, rate-limiting step in the electron transport chain.
-
It employs a Q cycle mechanism to transfer electrons from reduced plastoquinol to plastocyanin, simultaneously contributing to the proton gradient.
-
Structural models illustrate the complex’s organization, including its dimeric nature and key prosthetic groups (e.g., Fe2S2 clusters, various hemes).
-
-
Photosystem I (PSI) and the PSI-LHCI Supercomplex:
-
PSI exhibits near-unity quantum efficiency by converting absorbed photon energy directly into electrons.
-
The PSI-LHCI supercomplex features an extensive network of chlorophylls and carotenoids that extend its absorption into the far-red region.
-
The dynamic association of light-harvesting complexes (LHCs) between PSI and PSII is modulated by phosphorylation, optimizing energy distribution based on light conditions.
-
-
Cyclic Electron Flow and NDH Complex:
-
Under certain physiological conditions, electrons from PSI are redirected in a cyclic pathway via the NDH complex back to the plastoquinone pool.
-
This process, which bypasses NADP⁺ reduction, enhances ATP production and helps balance the cellular NADPH/ATP ratio.
-
The NDH complex shares structural and mechanistic similarities with mitochondrial Complex I, further emphasizing the conservation of energy conversion strategies.
-
-
Regulation of Electron Transport and Carbon Metabolism:
-
The chapter presents an analogy of the electron transport chain as an “electronic circuit board,” where cytochrome b6f acts like a transistor, adjusting its conductance in response to light intensity.
-
Feedback mechanisms link the redox state of the plastoquinone pool and the phosphorylation status of LHCs to optimize the balance between electron flow and carbon fixation.
-
-
Chloroplast ATP Synthase (CF1FO):
-
Similar to its mitochondrial counterpart, the CF1FO ATP synthase operates as a rotary enzyme that synthesizes ATP by harnessing the proton motive force.
-
Its activity is tightly regulated by redox modulation, primarily via conformational changes in the γ subunit, ensuring that ATP hydrolysis does not occur during periods of low light.
-
Structural models highlight the conformational differences between the oxidized and reduced states of the enzyme, linking these changes to functional regulation.
-
Overall, the chapter provides a comprehensive view of how structural components and regulatory mechanisms are interwoven to ensure efficient and safe photosynthetic energy conversion. This integration of biophysical, biochemical, and structural data illustrates the complexity of photosynthetic regulation and its adaptation to varying environmental conditions.