
16.2: Plasma Membrane Structure
- Page ID
- 89002

\( \newcommand{\vecs}[1]{\overset { \scriptstyle \rightharpoonup} {\mathbf{#1}} } \)
\( \newcommand{\vecd}[1]{\overset{-\!-\!\rightharpoonup}{\vphantom{a}\smash {#1}}} \)
\( \newcommand{\dsum}{\displaystyle\sum\limits} \)
\( \newcommand{\dint}{\displaystyle\int\limits} \)
\( \newcommand{\dlim}{\displaystyle\lim\limits} \)
\( \newcommand{\id}{\mathrm{id}}\) \( \newcommand{\Span}{\mathrm{span}}\)
( \newcommand{\kernel}{\mathrm{null}\,}\) \( \newcommand{\range}{\mathrm{range}\,}\)
\( \newcommand{\RealPart}{\mathrm{Re}}\) \( \newcommand{\ImaginaryPart}{\mathrm{Im}}\)
\( \newcommand{\Argument}{\mathrm{Arg}}\) \( \newcommand{\norm}[1]{\| #1 \|}\)
\( \newcommand{\inner}[2]{\langle #1, #2 \rangle}\)
\( \newcommand{\Span}{\mathrm{span}}\)
\( \newcommand{\id}{\mathrm{id}}\)
\( \newcommand{\Span}{\mathrm{span}}\)
\( \newcommand{\kernel}{\mathrm{null}\,}\)
\( \newcommand{\range}{\mathrm{range}\,}\)
\( \newcommand{\RealPart}{\mathrm{Re}}\)
\( \newcommand{\ImaginaryPart}{\mathrm{Im}}\)
\( \newcommand{\Argument}{\mathrm{Arg}}\)
\( \newcommand{\norm}[1]{\| #1 \|}\)
\( \newcommand{\inner}[2]{\langle #1, #2 \rangle}\)
\( \newcommand{\Span}{\mathrm{span}}\) \( \newcommand{\AA}{\unicode[.8,0]{x212B}}\)
\( \newcommand{\vectorA}[1]{\vec{#1}} % arrow\)
\( \newcommand{\vectorAt}[1]{\vec{\text{#1}}} % arrow\)
\( \newcommand{\vectorB}[1]{\overset { \scriptstyle \rightharpoonup} {\mathbf{#1}} } \)
\( \newcommand{\vectorC}[1]{\textbf{#1}} \)
\( \newcommand{\vectorD}[1]{\overrightarrow{#1}} \)
\( \newcommand{\vectorDt}[1]{\overrightarrow{\text{#1}}} \)
\( \newcommand{\vectE}[1]{\overset{-\!-\!\rightharpoonup}{\vphantom{a}\smash{\mathbf {#1}}}} \)
\( \newcommand{\vecs}[1]{\overset { \scriptstyle \rightharpoonup} {\mathbf{#1}} } \)
\(\newcommand{\longvect}{\overrightarrow}\)
\( \newcommand{\vecd}[1]{\overset{-\!-\!\rightharpoonup}{\vphantom{a}\smash {#1}}} \)
\(\newcommand{\avec}{\mathbf a}\) \(\newcommand{\bvec}{\mathbf b}\) \(\newcommand{\cvec}{\mathbf c}\) \(\newcommand{\dvec}{\mathbf d}\) \(\newcommand{\dtil}{\widetilde{\mathbf d}}\) \(\newcommand{\evec}{\mathbf e}\) \(\newcommand{\fvec}{\mathbf f}\) \(\newcommand{\nvec}{\mathbf n}\) \(\newcommand{\pvec}{\mathbf p}\) \(\newcommand{\qvec}{\mathbf q}\) \(\newcommand{\svec}{\mathbf s}\) \(\newcommand{\tvec}{\mathbf t}\) \(\newcommand{\uvec}{\mathbf u}\) \(\newcommand{\vvec}{\mathbf v}\) \(\newcommand{\wvec}{\mathbf w}\) \(\newcommand{\xvec}{\mathbf x}\) \(\newcommand{\yvec}{\mathbf y}\) \(\newcommand{\zvec}{\mathbf z}\) \(\newcommand{\rvec}{\mathbf r}\) \(\newcommand{\mvec}{\mathbf m}\) \(\newcommand{\zerovec}{\mathbf 0}\) \(\newcommand{\onevec}{\mathbf 1}\) \(\newcommand{\real}{\mathbb R}\) \(\newcommand{\twovec}[2]{\left[\begin{array}{r}#1 \\ #2 \end{array}\right]}\) \(\newcommand{\ctwovec}[2]{\left[\begin{array}{c}#1 \\ #2 \end{array}\right]}\) \(\newcommand{\threevec}[3]{\left[\begin{array}{r}#1 \\ #2 \\ #3 \end{array}\right]}\) \(\newcommand{\cthreevec}[3]{\left[\begin{array}{c}#1 \\ #2 \\ #3 \end{array}\right]}\) \(\newcommand{\fourvec}[4]{\left[\begin{array}{r}#1 \\ #2 \\ #3 \\ #4 \end{array}\right]}\) \(\newcommand{\cfourvec}[4]{\left[\begin{array}{c}#1 \\ #2 \\ #3 \\ #4 \end{array}\right]}\) \(\newcommand{\fivevec}[5]{\left[\begin{array}{r}#1 \\ #2 \\ #3 \\ #4 \\ #5 \\ \end{array}\right]}\) \(\newcommand{\cfivevec}[5]{\left[\begin{array}{c}#1 \\ #2 \\ #3 \\ #4 \\ #5 \\ \end{array}\right]}\) \(\newcommand{\mattwo}[4]{\left[\begin{array}{rr}#1 \amp #2 \\ #3 \amp #4 \\ \end{array}\right]}\) \(\newcommand{\laspan}[1]{\text{Span}\{#1\}}\) \(\newcommand{\bcal}{\cal B}\) \(\newcommand{\ccal}{\cal C}\) \(\newcommand{\scal}{\cal S}\) \(\newcommand{\wcal}{\cal W}\) \(\newcommand{\ecal}{\cal E}\) \(\newcommand{\coords}[2]{\left\{#1\right\}_{#2}}\) \(\newcommand{\gray}[1]{\color{gray}{#1}}\) \(\newcommand{\lgray}[1]{\color{lightgray}{#1}}\) \(\newcommand{\rank}{\operatorname{rank}}\) \(\newcommand{\row}{\text{Row}}\) \(\newcommand{\col}{\text{Col}}\) \(\renewcommand{\row}{\text{Row}}\) \(\newcommand{\nul}{\text{Nul}}\) \(\newcommand{\var}{\text{Var}}\) \(\newcommand{\corr}{\text{corr}}\) \(\newcommand{\len}[1]{\left|#1\right|}\) \(\newcommand{\bbar}{\overline{\bvec}}\) \(\newcommand{\bhat}{\widehat{\bvec}}\) \(\newcommand{\bperp}{\bvec^\perp}\) \(\newcommand{\xhat}{\widehat{\xvec}}\) \(\newcommand{\vhat}{\widehat{\vvec}}\) \(\newcommand{\uhat}{\widehat{\uvec}}\) \(\newcommand{\what}{\widehat{\wvec}}\) \(\newcommand{\Sighat}{\widehat{\Sigma}}\) \(\newcommand{\lt}{<}\) \(\newcommand{\gt}{>}\) \(\newcommand{\amp}{&}\) \(\definecolor{fillinmathshade}{gray}{0.9}\)In eukaryotic cells, the plasma membrane surrounds a cytoplasm that is filled with ribosomes, organelles, cytoskeletal (actin, intermediate) filaments and microtubules. Organelles are structures that are themselves encased in membranes. Some organelles (nuclei, mitochondria, chloroplasts) are even surrounded by double membranes. All cellular membranes are composed of two layers of phospholipids embedded with proteins. All are selectively permeable (semipermeable), allowing only certain substances to cross the membrane. The unique functions of cellular membranes are due to different phospholipid and protein compositions. Decades of research have revealed these functions. (See earlier discussions of mitochondrial and chloroplast functions, for instance.) Here we’ll describe general features of membranes, using the plasma membrane as our example.
16.2.1 The Phospholipid Bilayer
In 1925, E. Gorter and F. Grendel reported blood counts and the surface areas of samples of human, rabbit, dog, sheep, guinea pig, and goat red blood cells and predicted a bilayer membrane structure as early as 1925. They knew that red blood cells (erythrocytes) have no nucleus or other organelles, and thus only a plasma membrane. They also knew that the membranes were mainly composed of phospholipids. They then disrupted a known number of red blood cells and measured the amount of phospholipids in their membrane extracts. They next calculated that there were enough lipid molecules per cell to wrap around each cell twice. Since they knew that phospholipids had charged and hydrophobic regions, Gorter and Grendel predicted the phospholipid bilayer, within which nonpolar fatty acid domains would interact with each other. The space-filling molecular model of a phospholipid in Figure 16.1 (below) highlights its hydrophilic (polar) head and hydrophobic (nonpolar) tail. We say that molecules with hydrophilic and hydrophobic domains are amphipathic molecules.

Curiously, Gorter and Grendel made two calculation errors in determining the amount of phospholipids per cells. Nevertheless, their errors compensated for each other, so—while not strictly speaking correct—their conclusion was prophetic! Figure 16.2 shows some common membrane phospholipids.

When mixed with water, the amphipathic phospholipid molecules spontaneously aggregate to “hide” their hydrophobic regions from the water, forming structures called liposomes, which sediment when centrifuged (see Section 16.2.5 and link 277-2 below).
276-2 Membrane Lipids & Phospholipid Bilayer
277-2 Experiments with & Uses of Liposomes
Liposome membrane structure is consistent with the predicted bilayer, in which the phospholipid hydrophobic tails interact with each other, and the polar heads face away from each other. This conceptual understanding led to a model of membrane architecture based on phospholipid interactions, in which the fatty acid tails make up a hydrophobic membrane interior, with the hydrophilic (polar) phosphates on the surfaces, facing the opposite, aqueous sides of the membrane. The iconic image of a phospholipid bilayer is illustrated in Figure 16.3

16.2.2 Models of Membrane Structure
In 1935, H. Davson and J. Danielli suggested that proteins might be bound to the polar heads of the phospholipids in the plasma membrane, creating a protein-lipid-protein sandwich. Decades later, J. D. Robertson observed membranes in the transmission electron microscope at high power, revealing that all cellular membranes had a trilamellar structure. The classic trilamellar a cellular membrane can be seen in the electron micrographs in Figure 16.4.
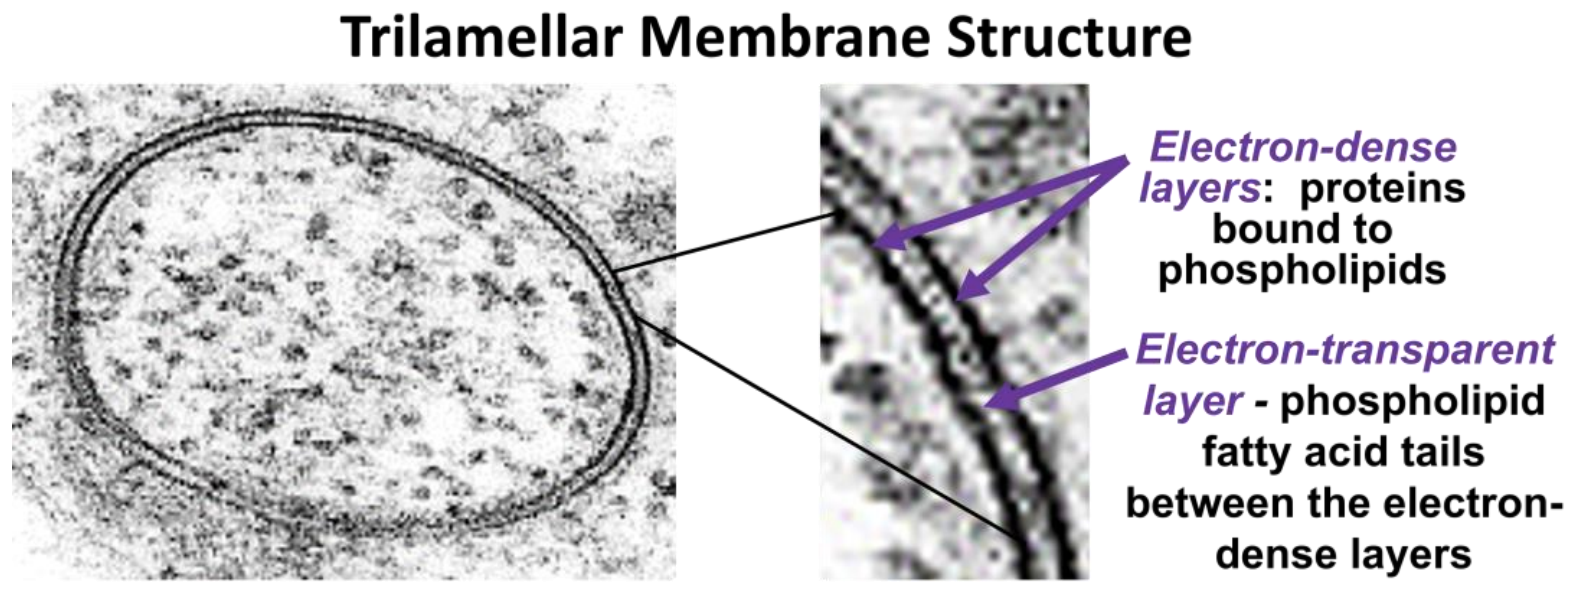
A trilamellar structure is consistent with the protein-lipid-protein Davson-Danielli model of the phospholipid bilayer. Observing that all cellular membranes had this trilamellar structure, Robertson further proposed his Unit Membrane model: all membranes consist of a clear phospholipid bilayer, coated with electron-dense proteins.
The static view implied by the Davson-Danielli or Robertson models of membrane structure was replaced in 1972 by Singer and Nicolson’s Fluid Mosaic model (see S. J. Singer and G. L. Nicolson, The fluid mosaic model of membranes. Science 175:720-731). They suggested that, in addition to peripheral proteins (which bind to the membrane surfaces), many integral membrane proteins span the membranes. Integral-membrane proteins were imagined as a mosaic of protein “tiles” embedded in a phospholipid medium. But unlike a mosaic of glazed tiles set in a firm, cement-like structure, the protein “tiles” were predicted to float in a phospholipid sea.
In the model, these proteins are anchored in membranes by one or more hydrophobic domains, while hydrophilic domains face either or both aqueous environments (external and cytosolic). Thus, like phospholipids themselves, membrane proteins are amphipathic. We know that cells expose different structural and functional surface features to their aqueous environments. Since the exposed domains of membrane proteins would be different on opposite sides of a membrane, we say that cellular membranes are asymmetric. Figure 16.5 is a model of the plasma membrane of a cell and includes its integral proteins, peripheral proteins, and glycoproteins.

In this model, some integral proteins have a hydrophobic domain that does not span the membrane but that anchors it to one side of the membrane. Peripheral (or so-called “surface”) proteins are also shown. These are less firmly bound to the membrane via charge interactions with the polar phosphate groups of phospholipids or via the polar domains of the integral membrane proteins. Because of their own aqueous, hydrophilic domains, membrane proteins present a natural barrier to the free passage of charged molecules across the membrane.
Membrane proteins are also responsible for the selective permeability of membranes, facilitating the movement of specific molecules into and out of cells (endocytosis and exocytosis, respectively). Membrane proteins also account for specific and selective interactions with their extracellular environment. These interactions include the adhesion of cells to each other, the cell’s attachment to surfaces, communication between cells (both direct and via hormones and neurons), and more.
The “sugar coating” of the extracellular surfaces of plasma membranes comes from oligosaccharides that are covalently linked to membrane proteins (to form glycoproteins) or to phospholipids (to make glycolipids). Carbohydrate components of glycosylated membrane proteins inform their function. Thus, glycoproteins enable specific interactions of cells with each other to form tissues. They also allow interaction with the extracellular surfaces to which they must adhere. In addition, they figure prominently as part of receptors for many hormones and other chemical-communication biomolecules. The intracellular domains of plasma membrane proteins (as well as those regions crossing the lipoidal region of the membrane itself) are not glycosylated. The cytoplasmic domains of some membrane proteins become attached to components of the cytoskeleton, giving cells their shape and allowing them to change shape when necessary. Other intercellular membrane protein domains have essential enzymatic features, as we will see. Given the crucial role of proteins and glycoproteins in membrane function, it should come as no surprise that proteins constitute an average of 40- 50% of the mass of a membrane. In some cases, proteins are as much as 70% of membrane mass (think cristal membranes in mitochondria!).
278-2 Properties of Proteins Embedded in a Phospholipid Bilayer
16.2.3 Evidence for Membrane Structure
Membrane asymmetry, in which the features facing one side of the membrane differ from those facing the opposite side, was directly demonstrated by the scanning electron microscope technique of freeze-fracture. The technique involves freezing isolated membranes in water, then chipping the ice. When the ice cracks, the encased membranes split along a line of least resistance, which turns out to be between the hydrophobic fatty acid opposing tails in the interior of the membrane. Scanning electron microscopy of a freeze-fractured membrane reveals features of the interior and exterior membrane surfaces that confirm membrane asymmetry. Among the prominent features shown by these micrographs are the pits and opposing mounds in the interior of the membrane. Figure 16.6 (below) illustrates the results of freeze-fracture electron microscopy of a plasma membrane.

Other features shown here are also consistent with phospholipid membrane structure.
280-2 Freeze-Fracture Electron Microscopy of Cell Membranes
Cytochemical studies also confirmed plasma membrane asymmetry, showing that only the external surfaces of plasma membranes are sugar coated. Check the following link for more detailed descriptions of the experiments.
281-2 EM Cytochemical Demonstration of Membrane Asymmetry
Finally, membrane asymmetry was also demonstrated biochemically. In one experiment, investigators treated whole cells with proteolytic enzymes, then extracted the membranes and isolated the membrane proteins. In a second experiment, investigators isolated plasma membranes from untreated cells first, and then treated the membranes with the enzymes. In a third experiment, investigators isolated plasma membranes from untreated cells, and then extracted the membrane proteins. Size separation of the three protein extracts by electrophoresis demonstrated that different components of integral membrane proteins were present in the two digest experiments, confirming the asymmetry of the plasma membrane. For more details, check the following link.
282-2 Electrophoretic Demonstration of Membrane Asymmetry
The idea that membranes are fluid was also tested experimentally. Here is a description of the experiment:
- Antibodies were made to mouse and human cell membrane proteins by isolating their membranes and injecting the isolates into a different animal (rabbits, most likely). Each rabbit’s cells saw the membranes and their associated proteins as foreign and responded by making specific anti-membrane antibody molecules.
- The rabbit antibodies against each membrane source were then isolated and separately tagged with colored fluorescent labels, so that each type would glow a different color when subjected to ultraviolet light.
- Next, mouse and human cells were mixed under conditions that caused them to fuse, making human-mouse hybrid cells.
- The tagged antibodies were added to the fused human-mouse cells and examined in a fluorescence microscope.
At first, the mouse and human antibodies were seen to bind to the mouse and human portions of the fused cell, as shown in Figure 16.7.

After a short time, the different fluorescent antibodies were seen to mix under a fluorescence microscope under UV light. The fluorescent tags seemed to be moving from their original location in the fused membranes (Figure. 16.8).

Clearly, proteins embedded in the membrane are not static; rather, they are able to move laterally in the membrane, in effect floating and diffusing in a “sea of phospholipids.”
283 Two Demonstrations of Membrane Fluidity: The Fluid Mosaic
16.2.4 Chemical Factors Affecting Membrane Fluidity
As you might expect, the fluidity of a membrane depends on its chemical composition and the physical conditions surrounding the cell (e.g., outside temperature). Just as heating a solution causes dissolved molecules and particulates to move faster, so also at higher external temperatures, membrane phospholipids and proteins are more fluid. Also, the fatty acids of phospholipids that have more unsaturated (C=C) carbon bonds have more kinks, or bends. These tend to push apart the phospholipid tails. With more space between the fatty acid tails, membrane components can move more freely. Thus, membranes with higher levels of polyunsaturated fatty acids are more fluid. On the other hand, cholesterol molecules tend to fill the space between fatty acids in the hydrophobic interior of the membrane. This reduces the lateral mobility of the phospholipid and protein components in the membrane. By reducing fluidity, cholesterol reduces membrane permeability to some ions. Factors that affect membrane fluidity are summarized in Figure 16.9 (below).

Evolution has adapted cell membranes to different and changing environments in order to maintain the fluidity necessary for proper cell function. Poikilothermic (i.e., coldblooded) organisms, from prokaryotes to fish and reptiles, do not regulate their body temperatures. When exposed to lower temperatures, poikilotherms respond by increasing the unsaturated fatty acid content of their cell membranes. At higher temperatures, they increase their cell membrane’s saturated fatty acid content. Thus, the cell membranes of fish living under the arctic ice maintain fluidity by having high levels of both monounsaturated and polyunsaturated fatty acids. What about fish species that range across warmer and colder environments (or that live in climates with changing seasons)? These fish regulate their cell membrane composition to adjust to the demands of their changing environment. The warmblooded (homeothermic) mammals and birds maintain a constant body temperature. Thus, their membrane composition is also relatively constant. But there is a paradox! Their cell membranes are very fluid, with a higher ratio of polyunsaturated fat to monounsaturated fats than, say, in reptiles. But the paradox is resolved when we understand that this greater fluidity supports the higher metabolic rate of the warm-blooded species compared to poikilotherms. Just compare the lifestyles of almost any mammal to a lazy floating alligator or a snake basking in the shade of a rock!
284-2 Factors Influencing Membrane Fluidity
Consider the paradox just mentioned. Why might a higher metabolic rate result in more fluid cellular membranes in homeotherms?
16.2.5 Making and Experimenting with Artificial Membranes
Membrane-like structures can form spontaneously. When phospholipids interact in an aqueous environment, they aggregate to exclude their hydrophobic fatty tails from water, forming micelles. Micelles are spherical phospholipid monolayer vesicles that self-assemble, a natural aggregation of the hydrophobic fatty acid domains of these amphipathic molecules. Figure 16.10 illustrates a micelle.

Micelles can further form spherical phospholipid bilayer liposomes (Figure 16.11).

Liposomes have a trilamellar membrane and behave somewhat like cells; for example, forming a pellet at the bottom of a tube when centrifuged. Liposomes can be custom designed from the different kinds of phospholipids and amphipathic proteins that have become integral to their membranes. When investigators prepare liposomes in the presence of specific proteins or other molecules that can’t diffuse across the liposomes’ membranes, these molecules become trapped in the vesicles. The trapped molecules cannot get out of this synthetic “organelle.” Such were the studies that allowed the identification of the mitochondrial respiratory-chain complexes. The ability of investigators to manipulate liposome content and membrane composition also makes liposomes candidates for drug delivery to specific cells and tissues. (Google “liposome” for more information.)
16.2.6 Separate Regions of a Plasma Membrane with Unique Fluidity and Permeability Properties
As we’ll see shortly, fluidity does not result in an equal diffusion of all membrane components around the cell-membrane surface. Instead, extracellular connections between cells, along with intracellular connections of the membrane to differentiated regions of the cytoskeleton, effectively compartmentalize the membrane into subregions. To understand this, imagine an epithelial cell sheet like the one below based on electron micrographs in Figure 16.12.

This sheet of cells exposes a domain (surface) with unique functions to the inside of the organ it lines. It exposes the opposite sheet surface, one with a quite different function, to fluid surrounding the organ. The lateral cell surfaces comprise yet another membrane compartment, one that functions to connect and communicate between the cells in the sheet. Membrane proteins, illustrated here with different symbolic shapes and colors, may remain fluid within a compartment. Of course, tissue-level macro-differentiation of cell membranes enabling cell– cell and cell–environmental interactions make intuitive sense. The possibility that cellular membranes are even more compartmentalized was perhaps less anticipated. In fact, membranes are further divided into micro-compartments. Within these compartments, components are fluid but seldom move between compartments. Studies indicate that cytoskeletal elements create and maintain these micro discontinuities. For example, integral membrane proteins are immobilized in membranes if they are attached to cytoskeletal fibers (e.g., actin) in the cytoplasm. Furthermore, aggregates of these proteins can line up due to similar interactions, forming a kind of fence, inhibiting other membrane components from crossing. By analogy, this mechanism of micro-compartmentalization is called the Fences and Pickets model: proteins attached to the cytoskeleton serve as the pickets (i.e., the usually white, pointy boards attached to a literal picket fence). The movement across the fences (i.e., from one membrane compartment to another) is infrequent. Extra kinetic energy is presumably needed for a molecule to “jump” a fence between compartments. Hence, this kind of motion (hop diffusion) differs from the Brownian motion implied by the original fluid mosaic model.