Case Study: How Can Evolution Explain the Frequency of White-Striped Clovers?
- Page ID
- 19916
*Adapted from National Center for Case Study Teaching in Science
Learning Objectives 
-
Understand the process of natural selection
-
Acquire an understanding of the concepts of variation, natural selection, fitness, selection, evolution, and adaptation.
-
Predict the distribution of cyanogenic clover
-
Propose hypotheses and justifications to explain the frequency of two types of clover
-
Be able to quantify the strength of selection and relative fitness of different clover forms
Part 1 - “I’m Looking Over…”
White clover (Trifolium repens), a small perennial plant, is found throughout the world, and has two forms. One variant has entirely green leaves (plain) and the other has green leaves with a prominent white stripe (striped). Do an internet search for clover to see if you can readily identify each type.
Both variants of white clover (plain and striped) are found along the coast of Long Island, New York. Most of Long Island is only a few feet above sea level. A series of low grass-covered hills separated by shallow depressions covers the area behind the oceanfront dunes. The shallow depressions reach to the water table, so they tend to be permanently moist year round and do not freeze in winter. Water drains away quickly from the low hills, which tend to dry out many times over the year and freeze in the winter. The habitat in the shallow depressions is more hospitable to molluscs (snails and slugs) that feed on clover. One type of clover is more common in shallow depressions while the other type is more likely to be found on low hills. When organisms of the same group or species have different phenotypes, they are referred to as polymorphisms.
At the end of the case, we will come back to New York and ask you to predict which type of white clover is most abundant in each microhabitat.
1. Propose a reason why one type of clover might be found in the depressions and another type on the hills.
2. Provide another example of a polymorphism you have observed in an animal group.
3. Sketch the coast of Long Island as it is described in the paragraph above, showing the types of organism and landscape and where they can be found.
ESSENTIAL QUESTION: What type of clover is found in the depressions and what type of clover would be mostly likely found on the hills of Long Island?
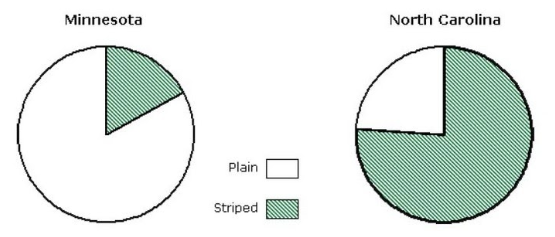
On a larger scale, the two types of clovers are found in different frequencies. The chart (Fig 1) below shows the distribution of the clover in North Carolina and Minnesota. Table 1 describes the physical habitats of the two locations.

Figure 1: Relative frequency of white clover variants in Minnesota and North Carolina
|
Minnesota |
North Carolina |
|
|
Latitude |
43 - 49° N |
34 -36° N |
|
Average Temperature (monthly) |
-19.4° to 28.6° C |
-2.6° to 31.3° C |
|
Mean # of days with a high above 32° C |
14 |
38 |
|
Mean # of days with a low below 0° C |
154 |
75 |
|
Average Yearly Precipitation |
66-76 cm |
107-117 cm |
|
Presence of herbivores (molluscs such as snails, slugs) |
small population, not present in winter |
large, active population, present all year |
4. A habitat is defined as the place and conditions under which an organism lives. This includes physical factors such as temperature, soil type, availability of nutrients, moisture and the presence of other organisms.
- Which habitat is farther north?
- Which habitat is generally warmer?
- Which habitat has more rain?
- Which habitat has a greater presence of herbivores?
5. Which habitat has a greater distribution of white-striped clover? Suggest a reason for this based on the data in the table.
Part II - Unlucky Clover
Some variants of white clover produce cyanide (CN), which is a very fast acting poison that inhibits enzymes in the mitochondrial electron transport chain. Without the electron transport chain, most organisms cannot produce ATP. The inability to produce ATP quickly leads to death. Small organisms that eat cyanide producing clover either die, or leave the plant alone in favor of other plants.
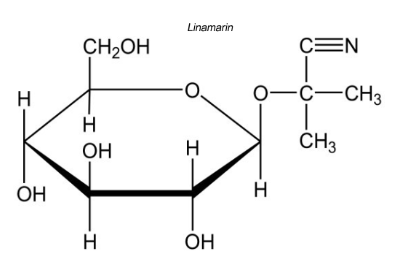
Two gene products are required to produce active cyanide. One gene encodes an inactive cyanide-sugar complex that is stored in the plant cell’s cytoplasm. The other gene encodes an enzyme that cleaves the sugar to activate the cyanide. This enzyme, called linamerase, is stored in the cell wall. In general, striped clover contains cyanide; plain clover does not.
In consistent freezing temperatures, plant cell membranes (surrounding organelles and the cell itself ) can burst. This is why the parts of plants above ground die back in colder climates. Root cells, however, are less likely to burst because they are underground and often store sugars, which protect the cell from freezing (just like antifreeze). This allows perennial plants to survive and grow again in the spring. Like the damage caused by freezing, herbivores can also damage plant cells. In the process of eating a leaf, herbivores destroy the membranes and organelles of the cells that make up the leaf.
6. Sketch a plant cell and include your representation for the cyanide-sugar complex and the enzyme linamerase using the descriptions above. Include the organelle that is directly affected by cyanide poison.
7. What would happen to the plant if the cyanide-sugar complex came into contact with linamerase?
8. Describe two ways in which the two could come into contact.
9. On the molecular formula at the top of the page, identify the cyanide portion and the sugar portion of linamarin. Indicate the “cleave” site for linamerase. (Label all three directly on the image.)
10. It takes energy for an organism to produce a particular structure such as a stripe on a clover leaf that is otherwise plain. Why might cyanide-producing clover produce striped leaves?
Part III - Fitness Is a Number
To understand why cyanide producing/striped clover is found at a higher frequency in North Carolina than in Minnesota, you must consider the “fitness” of each variant in the different habitats available in the two states. Fitness is determined by the ability of an organism to survive, grow, and reproduce in a particular habitat. You have probably heard the term “survival of the fittest,” but if an organism is not able to also grow and reproduce, it will not be able to pass any of its alleles (genetic information) onto its offspring. An organism that has high fitness does well in its habitat and passes those favorable alleles onto its offspring when it reproduces.
We can express fitness and selection with numbers that tell us not only whether one organism has a higher fitness than another, but also the degree to which that organism is more likely to survive and reproduce than another organism. It is not always possible to make an absolute measure of fitness, but often we can measure relative fitness. For each type of organism, we take some measure related to fitness, such as the percentage of individuals of that type surviving to the next generation. We then divide the measures for each type by the highest value. Thus, the organisms with the highest fitness will have a relative fitness of 1.0, whereas other organisms will have some value less than 1.0, but no lower than zero
For example, the data in the chart below shows the number of moths collected in two types of forests. (Data is based on Kettlewell’s experiments on peppered moths)
|
Unpolluted Forest
Relative fitness of light moths 13.7/13.7 = 1 Relative fitness of dark moths 4.7/13.7 = 0.34 |
Polluted Forest
|
11. Calculate the relative fitness for light and dark moths in the polluted forest. (Use the unpolluted forest calculations as a guide.)
12. One thing you might have noticed is that the difference between relative fitness of the fittest moths and the least fit moths is not the same for the unpolluted and polluted forests. This difference is called the strength of selection, or the selection coefficient(s). We can calculate this value for each environment. Here’s the calculation for the unpolluted forest: Unpolluted forest: s = 1.0 − 0.34 = .66
Calculate s for the polluted forest:
13. Since the unpolluted forest has a higher value for s, selection is stronger in the unpolluted forest than in the polluted forest. What does having a higher s value mean for that group of organisms? Think carefully on this and try to express your thoughts coherently!
Part IV – Investigating Clover Distribution
Now that you have considered the different habitats in which the white clover is found and the factors affecting fitness in clover, you will develop hypotheses to explain the observed distribution of plain and striped clover. A hypothesis is a tentative answer to a well-framed question. This means that one has developed an explanation of an event based on preliminary data, observations, and perhaps the work of other scientists.
Scientists use observations and data to develop and justify their hypotheses. A hypothesis is presented as a statement, not a question, and must be both testable (there must be some way to test if it is valid) and falsifiable (it must be possible to show that an incorrect hypothesis is false).
14. Based on the data presented above and the differences in habitat between Minnesota and North Carolina, propose a hypothesis to explain the distribution of clover in Minnesota and North Carolina. It may be easiest to write your hypothesis is an If-Then statement.
15. Once a scientist has formed a hypothesis, the next step is to test it with observations or experiments. Experiments should test only one variable at a time, and keep as many other factors as possible constant (which doesn’t mean“unchanging,” but only that they are the same for all experimental groups). Design an experiment(s) to test your hypothesis. Include the kind of data you would need to gather to support it. Be detailed!
Part V - What Did You Learn?
You have already used several concepts from evolutionary biology:
Variation: Differences among individuals of a species; different forms of the same trait.
Natural Selection: Differential survival (and reproduction) of individuals with different phenotypes
Evolution: Genetic change in a population over time.
Adaptation: A trait that increases the likelihood of survival and reproduction of an organism
16. Comparing white clover population in Minnesota and North Carolina, what would you need as evidence that evolution has occurred. (See definition)
17. Return to the first page (Part I) and predict which variant of clover would be most frequent in each of the microhabitats of Long Island and a short explanation of your reasoning. ( This is the answer to the ESSENTIAL QUESTION on page 1 and the overall purpose of this Case Study.)
18. Apply why you have learned to the following situation. 
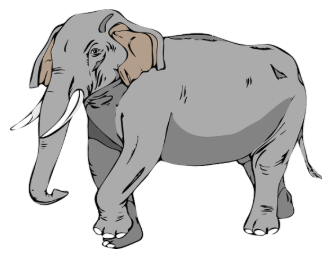
The average size of an African elephant’s tusks has gone down by half in the last century. Ivory poachers go for the largest males with the largest tusks, reducing the numbers of large males in the population. Smaller males with smaller tusks are more likely to breed when larger males are not present.
Explain how poaching can cause evolution to occur in elephant population. Use the terms: variation, adaptation, and selection pressure in your explanation.


