
3.4: Geologic Hazards
- Page ID
- 164490
\( \newcommand{\vecs}[1]{\overset { \scriptstyle \rightharpoonup} {\mathbf{#1}} } \)
\( \newcommand{\vecd}[1]{\overset{-\!-\!\rightharpoonup}{\vphantom{a}\smash {#1}}} \)
\( \newcommand{\dsum}{\displaystyle\sum\limits} \)
\( \newcommand{\dint}{\displaystyle\int\limits} \)
\( \newcommand{\dlim}{\displaystyle\lim\limits} \)
\( \newcommand{\id}{\mathrm{id}}\) \( \newcommand{\Span}{\mathrm{span}}\)
( \newcommand{\kernel}{\mathrm{null}\,}\) \( \newcommand{\range}{\mathrm{range}\,}\)
\( \newcommand{\RealPart}{\mathrm{Re}}\) \( \newcommand{\ImaginaryPart}{\mathrm{Im}}\)
\( \newcommand{\Argument}{\mathrm{Arg}}\) \( \newcommand{\norm}[1]{\| #1 \|}\)
\( \newcommand{\inner}[2]{\langle #1, #2 \rangle}\)
\( \newcommand{\Span}{\mathrm{span}}\)
\( \newcommand{\id}{\mathrm{id}}\)
\( \newcommand{\Span}{\mathrm{span}}\)
\( \newcommand{\kernel}{\mathrm{null}\,}\)
\( \newcommand{\range}{\mathrm{range}\,}\)
\( \newcommand{\RealPart}{\mathrm{Re}}\)
\( \newcommand{\ImaginaryPart}{\mathrm{Im}}\)
\( \newcommand{\Argument}{\mathrm{Arg}}\)
\( \newcommand{\norm}[1]{\| #1 \|}\)
\( \newcommand{\inner}[2]{\langle #1, #2 \rangle}\)
\( \newcommand{\Span}{\mathrm{span}}\) \( \newcommand{\AA}{\unicode[.8,0]{x212B}}\)
\( \newcommand{\vectorA}[1]{\vec{#1}} % arrow\)
\( \newcommand{\vectorAt}[1]{\vec{\text{#1}}} % arrow\)
\( \newcommand{\vectorB}[1]{\overset { \scriptstyle \rightharpoonup} {\mathbf{#1}} } \)
\( \newcommand{\vectorC}[1]{\textbf{#1}} \)
\( \newcommand{\vectorD}[1]{\overrightarrow{#1}} \)
\( \newcommand{\vectorDt}[1]{\overrightarrow{\text{#1}}} \)
\( \newcommand{\vectE}[1]{\overset{-\!-\!\rightharpoonup}{\vphantom{a}\smash{\mathbf {#1}}}} \)
\( \newcommand{\vecs}[1]{\overset { \scriptstyle \rightharpoonup} {\mathbf{#1}} } \)
\(\newcommand{\longvect}{\overrightarrow}\)
\( \newcommand{\vecd}[1]{\overset{-\!-\!\rightharpoonup}{\vphantom{a}\smash {#1}}} \)
\(\newcommand{\avec}{\mathbf a}\) \(\newcommand{\bvec}{\mathbf b}\) \(\newcommand{\cvec}{\mathbf c}\) \(\newcommand{\dvec}{\mathbf d}\) \(\newcommand{\dtil}{\widetilde{\mathbf d}}\) \(\newcommand{\evec}{\mathbf e}\) \(\newcommand{\fvec}{\mathbf f}\) \(\newcommand{\nvec}{\mathbf n}\) \(\newcommand{\pvec}{\mathbf p}\) \(\newcommand{\qvec}{\mathbf q}\) \(\newcommand{\svec}{\mathbf s}\) \(\newcommand{\tvec}{\mathbf t}\) \(\newcommand{\uvec}{\mathbf u}\) \(\newcommand{\vvec}{\mathbf v}\) \(\newcommand{\wvec}{\mathbf w}\) \(\newcommand{\xvec}{\mathbf x}\) \(\newcommand{\yvec}{\mathbf y}\) \(\newcommand{\zvec}{\mathbf z}\) \(\newcommand{\rvec}{\mathbf r}\) \(\newcommand{\mvec}{\mathbf m}\) \(\newcommand{\zerovec}{\mathbf 0}\) \(\newcommand{\onevec}{\mathbf 1}\) \(\newcommand{\real}{\mathbb R}\) \(\newcommand{\twovec}[2]{\left[\begin{array}{r}#1 \\ #2 \end{array}\right]}\) \(\newcommand{\ctwovec}[2]{\left[\begin{array}{c}#1 \\ #2 \end{array}\right]}\) \(\newcommand{\threevec}[3]{\left[\begin{array}{r}#1 \\ #2 \\ #3 \end{array}\right]}\) \(\newcommand{\cthreevec}[3]{\left[\begin{array}{c}#1 \\ #2 \\ #3 \end{array}\right]}\) \(\newcommand{\fourvec}[4]{\left[\begin{array}{r}#1 \\ #2 \\ #3 \\ #4 \end{array}\right]}\) \(\newcommand{\cfourvec}[4]{\left[\begin{array}{c}#1 \\ #2 \\ #3 \\ #4 \end{array}\right]}\) \(\newcommand{\fivevec}[5]{\left[\begin{array}{r}#1 \\ #2 \\ #3 \\ #4 \\ #5 \\ \end{array}\right]}\) \(\newcommand{\cfivevec}[5]{\left[\begin{array}{c}#1 \\ #2 \\ #3 \\ #4 \\ #5 \\ \end{array}\right]}\) \(\newcommand{\mattwo}[4]{\left[\begin{array}{rr}#1 \amp #2 \\ #3 \amp #4 \\ \end{array}\right]}\) \(\newcommand{\laspan}[1]{\text{Span}\{#1\}}\) \(\newcommand{\bcal}{\cal B}\) \(\newcommand{\ccal}{\cal C}\) \(\newcommand{\scal}{\cal S}\) \(\newcommand{\wcal}{\cal W}\) \(\newcommand{\ecal}{\cal E}\) \(\newcommand{\coords}[2]{\left\{#1\right\}_{#2}}\) \(\newcommand{\gray}[1]{\color{gray}{#1}}\) \(\newcommand{\lgray}[1]{\color{lightgray}{#1}}\) \(\newcommand{\rank}{\operatorname{rank}}\) \(\newcommand{\row}{\text{Row}}\) \(\newcommand{\col}{\text{Col}}\) \(\renewcommand{\row}{\text{Row}}\) \(\newcommand{\nul}{\text{Nul}}\) \(\newcommand{\var}{\text{Var}}\) \(\newcommand{\corr}{\text{corr}}\) \(\newcommand{\len}[1]{\left|#1\right|}\) \(\newcommand{\bbar}{\overline{\bvec}}\) \(\newcommand{\bhat}{\widehat{\bvec}}\) \(\newcommand{\bperp}{\bvec^\perp}\) \(\newcommand{\xhat}{\widehat{\xvec}}\) \(\newcommand{\vhat}{\widehat{\vvec}}\) \(\newcommand{\uhat}{\widehat{\uvec}}\) \(\newcommand{\what}{\widehat{\wvec}}\) \(\newcommand{\Sighat}{\widehat{\Sigma}}\) \(\newcommand{\lt}{<}\) \(\newcommand{\gt}{>}\) \(\newcommand{\amp}{&}\) \(\definecolor{fillinmathshade}{gray}{0.9}\)Earthquakes
An earthquake is the shaking caused by the rupture (breaking) and subsequent displacement of rocks (one body of rock moving with respect to another) beneath Earth’s surface. A body of rock that is under stress becomes deformed. When the rock can no longer withstand the deformation, it breaks and the two sides slide past each other. The region where the rupture occurs is called the focus. This is often deep below the surface of the crust. The point on the surface directly above the focus is called the epicenter. Destructive waves propagate outward from the region of the quake, traveling throughout the earth. The magnitude of an earthquake is a measure of the total amount of energy released. The first step in determining the magnitude is to measure the propagated waves using a device called a seismograph. Based on this information, the earthquake is given a number classification on a modified Richter scale. The scale is logarithmic, so a difference of one unit means a difference of ten-fold in wave intensity, which corresponds to an energy difference of 32-fold. The intensity of an earthquake is an indicator of the effect of an earthquake at a particular locale. The effect depends not only on the magnitude of the earthquake, but also the types of subsurface materials and the structure and design of surface structures.
Earthquakes generally occur along breaks in the rock mass known as faults, and most occur in regions near plate boundaries, although not all earthquakes happen on pre-existing faults. Some 80 percent of all earthquakes occur near convergent plate boundaries, triggered by the interaction of the plates. Earthquakes are also often associated with volcanic activity due to the movement of sub-surface magma.
An intense earthquake can cause great damage to buildings, and the collapsing structures, fires, and other destruction can take a great toll on people. In 1556 an earthquake struck Shanxi Province in China and caused about 830,000 deaths, making it the most deadly earthquake in recorded history. The most famous catastrophic earthquake in North America was the San Francisco event in 1906, caused by slippage along the San Andreas Fault, which killed 503 people and resulted in tremendous physical damage. However, other earthquakes during the twentieth century resulted in much greater losses of human lives, including one in 1976 that killed 242,000 people in Tangshan, China; another in 1927 that killed 200,000 in Nan-Shan, China; and one in Tokyo–Yokohama, Japan, that killed 200,000 in 1926. Notable recent earthquakes include one in Kobe, Japan (1995) that killed 5,500 people, another in Kashmir (2005) that killed 79,000 people, one in Sichuan, China (2008) that killed 70,000 people, and one in the Tohuku region of Japan (2011) that generated a tsunami (seismic sea wave) that killed 16,000 people. The events in San Francisco (1906) and Tokyo (1926) affected large cities. The powerful tremors caused great damage, partly because of weak architectural designs that were unable to withstand the strong forces. In both cases, however, about 90% of the actual destruction resulted from fires. Earthquakes can also cause soil to lose some of its mechanical stability, resulting in destructive landslides and subsidence (sinking) of land and buildings.
When an earthquake occurs under the ocean, it can trigger a destructive tidal wave known as a tsunami. A tsunami may be almost indiscernible in deep water of the open ocean, but it can become gigantic when the wave reaches shallow water and piles up to heights that can swamp coastal villages and towns. In 1946, a large earthquake centered on Umiak Island in the Aleutian Islands (Alaska) caused a tsunami to strike Hawaii, 4,500 km away, with an 18 m crest. The greatest tsunami of recent times was triggered by an undersea, so-called “megathrust” earthquake on December 26, 2004. Its epicenter was located about 40 km off the coast of Aceh in northern Sumatra, an Indonesian island, and it registered a massive 9.2 on the Richter scale (making it the largest earthquake in 40 years) (Figure \(\PageIndex{1}\)). The tremor generated an immense tsunami (actually, a close series of individual waves) that gathered to a height up to 30 m when it impacted shallow-sloping coasts of countries fringing the Indian Ocean. The colossal tsunami waves were moving at speeds of about 60 kmhr when they impacted the shore. They caused widespread devastation and more than 225,000 deaths by drowning and injuries caused by floating debris and collapsing buildings. The hardest-hit places were Sumatra (which suffered at least 168,000 dead and missing), Sri Lanka (35,000), the eastern coast and islands of India (18,000), and Thailand (8,000). At least 7,000 of the deaths were tourists from developed countries who were visiting coastal resorts during their holiday break. In addition to the mortality, tens of millions of people were displaced from their homes and livelihoods by the flooding. In many of the worst-hit places, the damage was made much more severe because of increased coastal vulnerability caused by the removal of previously abundant mangrove forest, mostly to develop tourist resorts and brackish ponds for shrimp aquaculture. Where mangroves remained intact, the coastal forest provided a sea-wall that helped to absorb much of the force of the tsunami, providing a measure of protection to areas further inland.
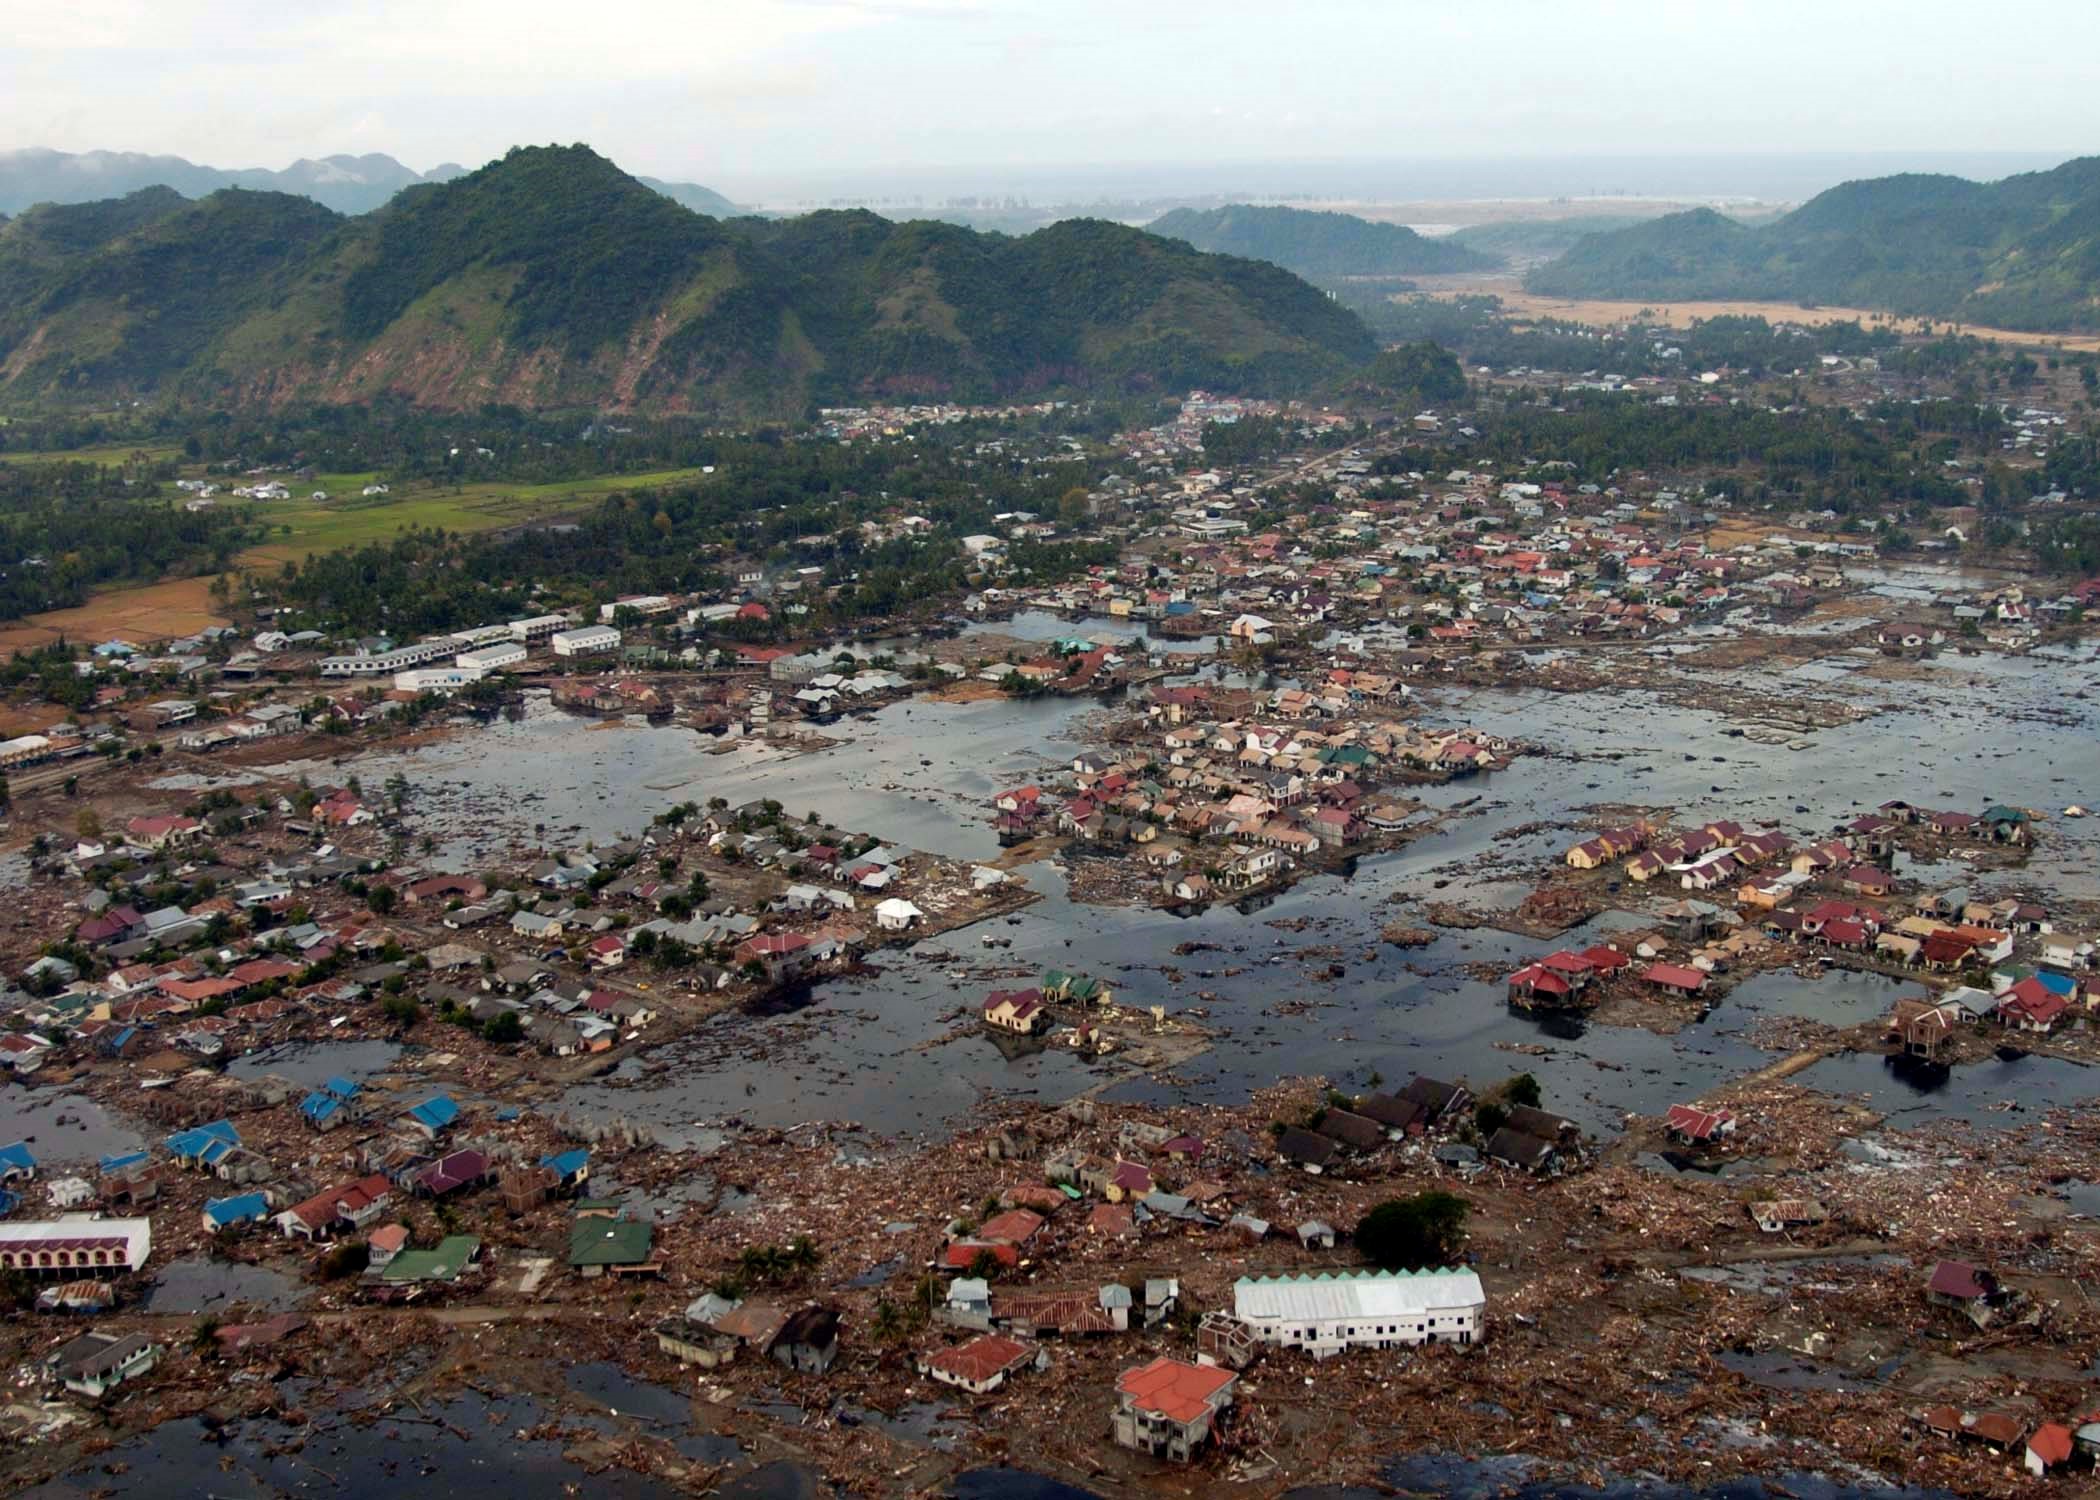
Figure \(\PageIndex{1}\): A devastated village on the coast of Aceh, Sumatra, after the killer tsunami of December 26, 2004. Source: image by P.A. McDaniel, United States Navy, ID 050102-N-9593M-040; https://commons.wikimedia.org/wiki/File%3AUS_Navy_050102-N-9593M-040_A_village_near_the_coast_of_Sumatra_lays_in_ruin_after_the_Tsunami_that_struck_South_East_Asia.jpg
Earthquake Processes
The engineering principle of elastic deformation, which can be used to understand earthquakes, is illustrated in Figure \(\PageIndex{2}\). The stress applied to a rock—typically because of ongoing plate movement—results in strain or deformation of the rock (Figure \(\PageIndex{2}\)b). Because most rock is strong (unlike loose sand, for example), it can withstand a significant amount of deformation without breaking. But every rock has a deformation limit and will rupture (break) once that limit is reached. At that point, in the case of rocks within the crust, the rock breaks and there is displacement along the rupture surface (Figure \(\PageIndex{2}\)c). The magnitude of the earthquake depends on the extent of the area that breaks (the area of the rupture surface) and the average amount of displacement (sliding).

The concept of a rupture surface, which is critical to understanding earthquakes, is illustrated in Figure \(\PageIndex{3}\). An earthquake does not happen at a point, it happens over an area within a plane, although not necessarily a flat plane. Within the area of the rupture surface, the amount of displacement is variable (Figure \(\PageIndex{3}\)), and, by definition, it decreases to zero at the edges of the rupture surface because the rock beyond that point isn’t displaced at all. The extent of a rupture surface and the amount of displacement will depend on a number of factors, including the type and strength of the rock, and the degree to which it was stressed beforehand.

Earthquake rupture doesn’t happen all at once; it starts at a single point and spreads rapidly from there. Depending on the extent of the rupture surface, the propagation of failures out from the point of initiation is typically completed within seconds to several tens of seconds (Figure \(\PageIndex{4}\)). The initiation point isn’t necessarily in the centre of the rupture surface; it may be close to one end, near the top, or near the bottom.
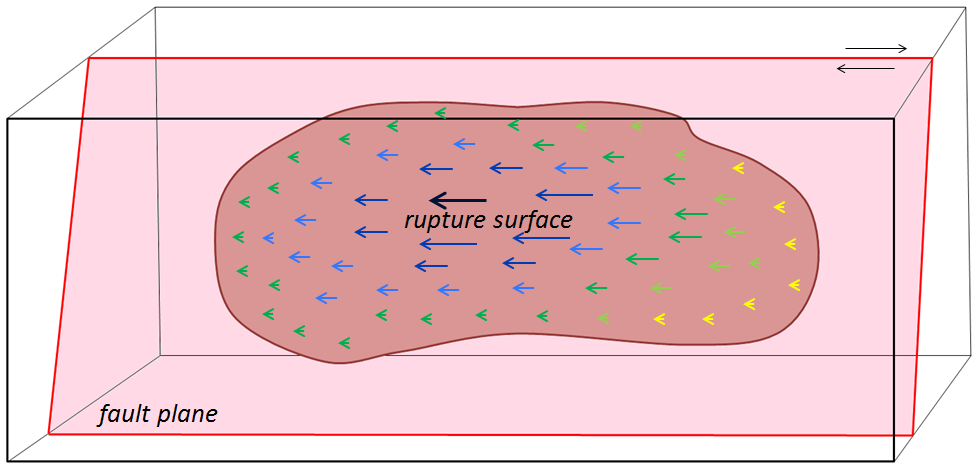
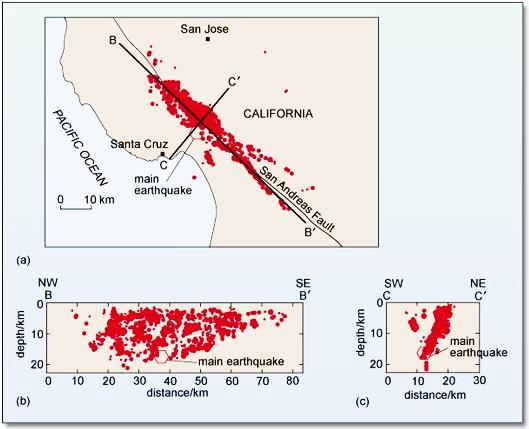
Figure \(\PageIndex{5}\) shows the distribution of immediate aftershocks associated with the 1989 Loma Prieta earthquake. Panel (b) is a section along the San Andreas Fault; this view is equivalent to what is shown in Figures \(\PageIndex{3}\) and \(\PageIndex{4}\). The area of red dots is the rupture surface; each red dot is a specific aftershock that was recorded on a seismometer. The hexagon labelled “main earthquake” represents the first or main shock. When that happened, the rock at that location broke and was displaced. That released the stress on that particular part of the fault, but it resulted in an increase of the stress on other nearby parts of the fault, and contributed to a cascade of smaller ruptures (aftershocks), in this case, over an area about 60 kilometers long and 15 kilometers wide.
So, what exactly is an aftershock then? An aftershock is an earthquake just like any other, but it is one that can be shown to have been triggered by stress transfer from a preceding earthquake. Within a few tens of seconds of the main Loma Prieta earthquake, there were hundreds of smaller aftershocks; their distribution defines the area of the rupture surface.
Aftershocks can be of any magnitude. Most are smaller than the earthquake that triggered them, but they can be bigger. The aftershocks shown in Figure \(\PageIndex{4}\) all happened within seconds or minutes of the main shock, but aftershocks can be delayed for hours, days, weeks, or even years. As already noted, aftershocks are related to stress transfer. For example, the main shock of the Loma Prieta earthquake triggered aftershocks in the immediate area, which triggered more in the surrounding area, eventually extending for 30 kilometers along the fault in each direction and for 15 kilometers toward the surface. But the earthquake as a whole also changed the stress on adjacent parts of the San Andreas Fault. This effect, which has been modelled for numerous earthquakes and active faults around the world, is depicted in Figure \(\PageIndex{6}\). Stress was reduced in the area of the rupture (blue), but was increased at either end of the rupture surface (red and yellow).

Stress transfer isn’t necessarily restricted to the fault along which an earthquake happened. It will affect the rocks in general around the site of the earthquake and may lead to increased stress on other faults in the region. The effects of stress transfer don’t necessarily show up right away. Segments of faults are typically in some state of stress, and the transfer of stress from another area is only rarely enough to push a fault segment beyond its limits to the point of rupture. The stress that is added by stress transfer accumulates along with the ongoing buildup of stress from plate motion and eventually leads to another earthquake.
Episodic Tremor and Slip
Episodic tremor and slip (ETS) is periodic slow sliding along part of a subduction boundary. It does not produce recognizable earthquakes, but does produce seismic tremor (rapid seismic vibrations on a seismometer). It was first discovered on the Vancouver Island part of the Cascadia subduction zone by Geological Survey of Canada geologists Herb Dragert and Garry Rogers.[1]
The boundary between the subducting Juan de Fuca Plate and the North America Plate can be divided into three segments (Figure \(\PageIndex{7}\)). The cold upper part of the Juan de Fuca Plate boundary is locked. The plates are stuck and don’t move, except with very large earthquakes that happen approximately every 500 years (the last one was approximately M9 on January 26, 1700). The warm lower part of the boundary is sliding continuously because the warm rock is weaker. The central part of the boundary isn’t cold enough to be stuck, but isn’t warm enough to slide continuously. Instead it slips episodically, approximately every 14 months for about 2 weeks, moving a few centimeters each time.

You might be inclined to think that it’s a good thing that there is periodic slip on this part of the plate because it releases some of the tension and reduces the risk of a large earthquake. In fact, the opposite is likely the case. The movement along the ETS part of the plate boundary acts like a medium-sized earthquake and leads to stress transfer to the adjacent locked part of the plate. Approximately every 14 months, during the two-week ETS period, there is a transfer of stress to the shallow locked part of the Cascadia subduction zone, and therefore an increased chance of a large earthquake. Since 2003, ETS processes have also been observed on subduction zones in Mexico, New Zealand and Japan.
Volcanoes
A volcano is any location where magma comes to the surface, or has done so within the past several million years (Figure \(\PageIndex{8}\)). This can include eruptions on the ocean floor (or even under the water of lake), where they are called subaqueous eruptions, or on land, where they are called subaerial eruptions. Volcanoes commonly occur near plate boundaries where the motion of the plates has created cracks in the lithosphere through which the magma can flow. About eighty percent of volcanoes occur at convergent plate boundaries where subducted material melts and rises through cracks in the crust. Not all volcanic eruptions produce the volcanic mountains with which we are familiar; in fact most of Earth’s volcanism takes place along the spreading ridges on the sea floor and does not produce volcanic mountains at all — not even sea-floor mountains.
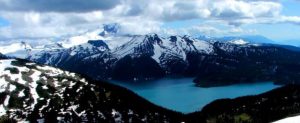
Figure \(\PageIndex{8}\): Mt. Garibaldi (background left, looking from the north) with Garibaldi Lake in the foreground. Mt. Garibaldi, near Squamish B.C., is one of Canada’s tallest (2,678 m) and most recently active volcanoes. [SE photo] The volcanic peak in the centre is Mt. Price and the dark flat–topped peak is The Table. All three of these volcanoes were active during the last glaciation. Mt. Garibaldi last erupted approximately 10,000 years ago. © Steven Earle. CC BY
The study of volcanoes is critical to our understanding of the geological evolution of Earth, and to our understanding of significant changes in climate. But, most important of all, understanding volcanic eruptions allows us to save lives and property. Over the past few decades, volcanologists have made great strides in their ability to forecast volcanic eruptions and predict the consequences — this has already saved thousands of lives.
The largest eruptions can literally explode a volcanic mountain, ejecting immense quantities of material into the environment and causing enormous damage and loss of life. For example, an eruption of Mount Vesuvius in the year 79 CE (Common Era) buried the Roman city of Pompeii, killing almost all of its inhabitants. A 1902 explosion of Mont Pelée on the Caribbean island of Martinique killed 30,000 people. Another famous Indonesian eruption was that of Krakatau in the Sunda Strait in 1883, which ejected 18-21 km3 of material as high as 50-80 km into the atmosphere. The 30-m tsunami associated with this eruption killed about 36,000 people in coastal villages.
The greatest eruption of modern times was that of Tambora, a volcano in Indonesia that exploded in 1815 and blew more than 300 km3 of material into the atmosphere (including the top 1,300 m of the mountain). Some of the finer particulates of this massive eruption were blown into the upper atmosphere (the stratosphere), causing an increase in Earth’s reflectivity that resulted in global cooling. The year 1816 became known as the “year without a summer” in Europe and North America because of its unusually cool and wet weather, including frost and snowfall during the summer months.
Large volcanic eruptions can also disturb great expanses of forest and other ecosystems. For instance, the 1980 explosion of Mount St. Helen’s in the state of Washington blew down about 21,000 hectares of coniferous forest and otherwise damaged another 40,000 ha. Mudslides also devastated large areas, and a vast region was covered by particulate debris (known as tephra) that settled from the atmosphere.
Some volcanoes produce chronic lava flows and venting of gases. These volcanoes tend to form distinctive, cone-shaped mountains from their accumulated lava, which solidifies into finely crystalline, glassy rocks. An active example of this spectacular process is Mount Kilauea in Hawaii, which sometimes erupts continuously for years. The slowly flowing lava from these volcanoes can destroy buildings and vegetation but is not otherwise dangerous because people and animals can avoid the molten streams.
Types of Volcanoes
Volcanoes can be classified according to the type and form of their ejecta. The basic types are: composite volcanoes, shield volcanoes, cinder cones, and lava domes. Composite volcanoes are steep-sided, symmetrical cones built of multiple layers of viscous lava and ash. Most composite volcanoes have a crater at the summit which contains the central vent. Lavas flow from breaks in the crater wall or from cracks on the flanks of the cone. Mt Fuji in Japan and Mt Ranier in Washington are examples of composite volcanoes.
Shield volcanoes are built almost entirely of highly fluid (low viscosity) lava flows. They form slowly from numerous flows that spread out over a wide area from a central vent. The resultant structure is a broad, gently sloping cone with a profile like a warrior’s shield. Mt Kilauea in Hawaii is an example of a shield volcano.
Cinder cones are the simplest type of volcano. They form when lava blown violently into the area breaks into small fragments that solidify and fall as cinders. A steep-sided cone shape is formed around the vent, with a crater at the summit. Sunset Crater in Arizona is a cinder cone that formed less than a thousand years ago, disrupting the lives of the native inhabitants of the region.
Lava domes are formed when highly viscous lava is extruded from a vent and forms a rounded, steep-sided dome. The lava piles up around and on the vent instead of flowing away, mostly growing by expansion from within. Lava domes commonly occur within the craters or on the flanks of composite volcanoes.
Volcanic Hazards
There are two classes of volcanic hazards, direct and indirect. Direct hazards are forces that directly kill or injure people, or destroy property or wildlife habitat. Indirect hazards are volcanism-induced environmental changes that lead to distress, famine, or habitat degradation. It is estimated that indirect effects of volcanism have accounted for approximately 8 million deaths during historical times, while direct effects have accounted for fewer than 200,000, or 2.5% of the total. Some of the more important types of volcanic hazards are summarized in Table \(\PageIndex{1}\).
| [Skip Table] | ||
| Type | Description | Risk |
|---|---|---|
| Tephra emissions | Small particles of volcanic rock emitted into the atmosphere |
|
| Gas emissions | The emission of gases before, during, and after an eruption |
|
| Pyroclastic density current | A very hot (several 100°C) mixture of gases and volcanic fragments (tephra) that flows rapidly (up to 100s of kilometers per hour (km/h)) down the side of a volcano | Extreme hazard — destroys anything in the way |
| Pyroclastic fall | Vertical fall of tephra in the area surrounding an eruption |
|
| Lahar | A flow of mud and debris down a channel leading away from a volcano, triggered either by an eruption or a severe rain event | Severe risk of destruction for anything within the channel—lahar mud flows can move at 10s of km/h |
| Sector collapse/ debris avalanche | The failure of part of a volcano, either due to an eruption or for some other reason, leading to the failure of a large portion of the volcano | Severe risk of destruction for anything in the path of the debris avalanche |
| Lava flow | The flow of lava away from a volcanic vent | People and infrastructure at risk, but lava flows tend to be slow (less than km/h) and are relatively easy to avoid |
Volcanic Gas and Tephra Emissions
Large volumes of tephra (rock fragments, mostly pumice) and gases are emitted during major plinian eruptions (large explosive eruptions with hot gas and tephra columns extending into the stratosphere) at composite volcanoes, and a large volume of gas is released during some very high-volume effusive eruptions. One of the major effects is cooling of the climate by 1° to 2°C for several months to a few years because the dust particles and tiny droplets and particles of sulfur compounds block the sun. The last significant event of this type was in 1991 and 1992 following the large eruption of Mount Pinatubo in the Philippines. A temperature decrease of 1° to 2°C may not seem like very much, but that is the global average amount of cooling, and cooling was much more severe in some regions and at some times.
Over an eight-month period in 1783 and 1784, a massive effusive eruption took place at the Laki volcano in Iceland. Although there was relatively little volcanic ash involved, a massive amount of sulfur dioxide was released into the atmosphere, along with a significant volume of hydrofluoric acid (HF). The sulphate aerosols that formed in the atmosphere led to dramatic cooling in the northern hemisphere. There were serious crop failures in Europe and North America, and a total of 6 million people are estimated to have died from famine and respiratory complications. In Iceland, poisoning from the HF resulted in the death of 80% of sheep, 50% of cattle, and the ensuing famine, along with HF poisoning, resulted in more than 10,000 human deaths—about 25% of the population.
Volcanic ash can also have serious implications for aircraft because it can destroy jet engines. For example, over 5 million airline passengers had their travel disrupted by the 2010 Eyjafjallajökull volcanic eruption in Iceland.
Pyroclastic Density Currents
In a typical explosive eruption at a composite volcano, the tephra and gases are ejected with explosive force and are hot enough to be forced high up into the atmosphere. As the eruption proceeds, and the amount of gas in the rising magma starts to decrease, parts will become heavier than air, and they can then flow downward along the flanks of the volcano (Figure \(\PageIndex{2}\)). As they descend, they cool more and flow faster, reaching speeds up to several hundred kilometers per hour. A pyroclastic density current (PDC) consists of tephra ranging in size from boulders to microscopic shards of glass (made up of the edges and junctions of the bubbles of shattered pumice), plus gases (dominated by water vapor, but also including other gases). The temperature of this material can be as high as 1000°C. Among the most famous PDCs are the one that destroyed Pompeii in the year 79 CE, killing an estimated 18,000 people, and the one that destroyed the town of St. Pierre, Martinique, in 1902, killing an estimated 30,000.
The buoyant upper parts of pyroclastic density currents can flow over water, in some cases for several kilometers. The 1902 St. Pierre PDC flowed out into the city’s harbour and destroyed several wooden ships anchored there.
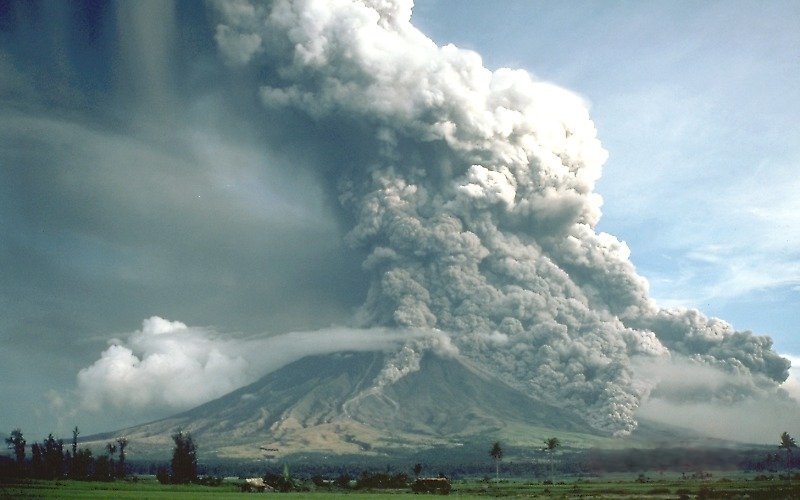
Source: “Pyroclastic flows at Mayon Volcano” by USGS. Public domain.
Pyroclastic Fall
Most of the tephra from an explosive eruption ascends high into the atmosphere, and some of it is distributed around Earth by high-altitude winds. The larger components (larger than 0.1 mm) tend to fall relatively close to the volcano, and the amount produced by large eruptions can cause serious damage and casualties. The large 1991 eruption of Mount Pinatubo in the Philippines resulted in the accumulation of tens of centimeters of ash in fields and on rooftops in the surrounding populated region. Heavy typhoon rains that hit the island at the same time added to the weight of the tephra, leading to the collapse of thousands of roofs and to at least 300 of the 700 deaths attributed to the eruption.
Lahar
A lahar is any mudflow or debris flow that is related to a volcano. Most are caused by melting snow and ice during an eruption, as was the case with the lahar that destroyed the Colombian town of Armero in 1985 (described earlier). Lahars can also happen when there is no volcanic eruption, and one of the reasons is that, as we’ve seen, composite volcanoes tend to be weak and easily eroded.
In October 1998, category 5 hurricane Mitch slammed into the coast of central America. Damage was extensive and 19,000 people died, not so much because of high winds but because of intense rainfall—some regions received almost 2 m of rain over a few days! Mudflows and debris flows occurred in many areas, especially in Honduras and Nicaragua. An example is at the Casita Volcano in Nicaragua, where the heavy rains weakened rock and volcanic debris on the upper slopes, resulting in a debris flow that rapidly built in volume as it raced down the steep slope, and then ripped through the towns of El Porvenir and Rolando Rodriguez killing more than 2,000 people (Figure \(\PageIndex{3}\)). El Porvenir and Rolando Rodriguez were new towns that had been built without planning approval in an area that was known to be at risk of lahars.
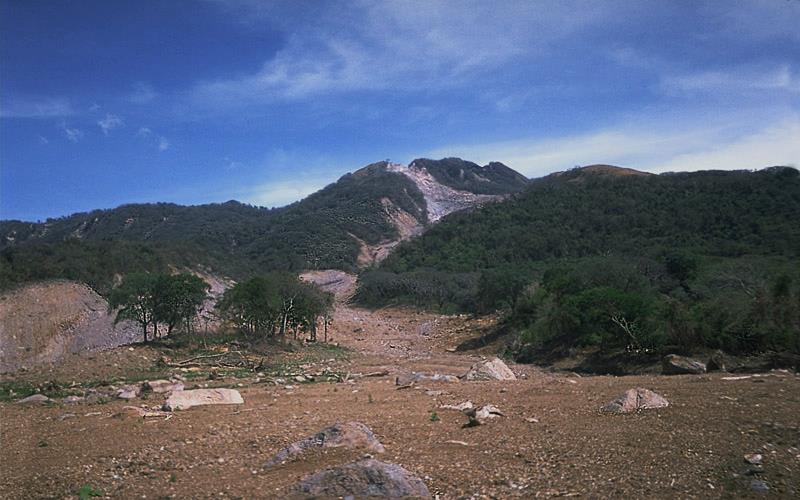
Source: “Casita Volcano” by USGS. Public domain.
Sector Collapse and Debris Avalanche
In the context of volcanoes, sector collapse or flank collapse is the catastrophic failure of a significant part of an existing volcano, creating a large debris avalanche. This hazard was first recognized with the failure of the north side of Mount St. Helens immediately prior to the large eruption on May 18, 1980. In the weeks before the eruption a large bulge had formed on the side of the volcano, the result of magma transfer from depth into a satellite magma body within the mountain itself. Early on the morning of May 18, a moderate earthquake struck nearby; this is thought to have destabilized the bulge, leading to Earth’s largest ever observed slope failure. The failure of this part of the volcano exposed the underlying satellite magma chamber, causing it to explode sideways, which then exposed the conduit leading to the magma chamber below. The resulting plinian eruption—with a 24 kilometre high eruption column—lasted for nine hours.
In August 2010, a massive part of the flank of B.C.’s Mount Meager gave way and about 48 million cubic meters (m3) of rock rushed down the valley, one of the largest slope failures in Canada in historical times. More than 25 slope failures have taken place at Mount Meager in the past 8,000 years, some of them more than 10 times larger than the 2010 failure.
Lava Flows
Lava flows at volcanoes like Kilauea do not advance very quickly, and in most cases, people can get out of the way. Of course, it is more difficult to move infrastructure, and so buildings and roads are typically the main casualties of lava flows.
Mass Wasting
Early in the morning on January 9, 1965, 47 million cubic metres of rock broke away from the steep upper slopes of Johnson Peak (16 km southeast of Hope) and roared 2,000 m down the mountain, gouging out the contents of a small lake at the bottom, and continuing a few hundred metres up the other side (Figure 15.1). Four people, who had been stopped on the highway by a snow avalanche, were killed. Many more might have become victims, except that a Greyhound bus driver, en route to Vancouver, turned his bus around on seeing the avalanche. The rock failed along weakened foliation planes of the metamorphic rock on Johnson Peak, in an area that had been eroded into a steep slope by glacial ice. There is no evidence that it was triggered by any specific event, and there was no warning that it was about to happen. Even if there had been warning, nothing could have been done to prevent it. There are hundreds of similar situations throughout British Columbia.
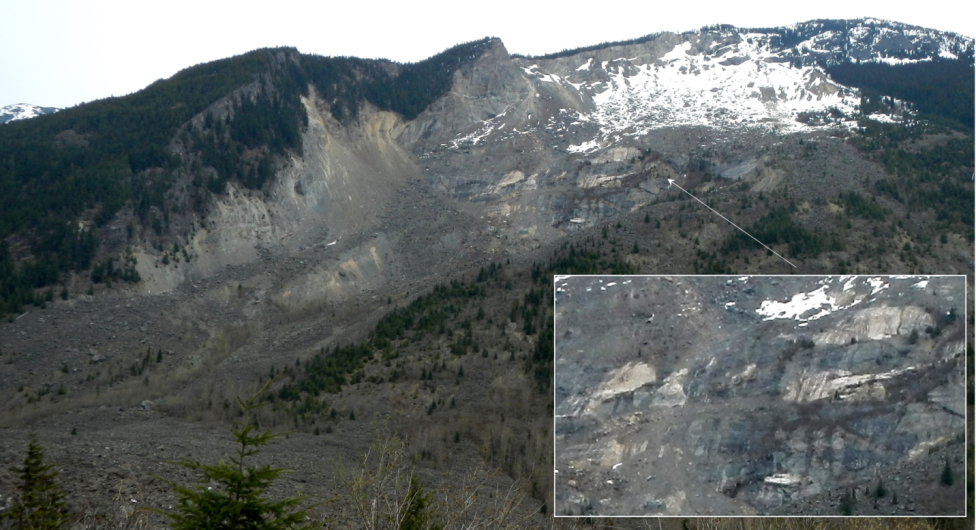
Figure \(\PageIndex{1}\): The site of the 1965 Hope Slide as seen in 2014. The initial failure is thought to have taken place along the foliation planes and sill within the area shown in the inset. © Steven Earle. CC BY
What can we learn from the Hope Slide? In general, we cannot prevent most mass wasting, and significant effort is required if an event is to be predicted with any level of certainty. Understanding the geology is critical to understanding mass wasting. Although failures are inevitable in a region with steep slopes, larger ones happen less frequently than smaller ones, and the consequences vary depending on the downslope conditions, such as the presence of people, buildings, roads, or fish-bearing streams.
An important reason for learning about mass wasting is to understand the nature of the materials that fail, and how and why they fail so that we can minimize risks from similar events in the future. For this reason, we need to be able to classify mass-wasting events, and we need to know the terms that geologists, engineers, and others use to communicate about them.
Mass wasting, which is synonymous with “slope failure,” is the failure and downslope movement of rock or unconsolidated materials in response to gravity. The term “landslide” is almost synonymous with mass wasting, but not quite because some people reserve “landslide” for relatively rapid slope failures, while others do not.
Classification of Mass Wasting Events
It’s important to classify slope failures so that we can understand what causes them and learn how to mitigate their effects. The three criteria used to describe slope failures are:
- The type of material that failed (typically either bedrock or unconsolidated sediment)
- The mechanism of the failure (how the material moved)
- The rate at which it moved
The type of motion is the most important characteristic of a slope failure, and there are three different types of motion:
- If the material drops through the air, vertically or nearly vertically, it’s known as a fall.
- If the material moves as a mass along a sloping surface (without internal motion within the mass), it’s a slide.
- If the material has internal motion, like a fluid, it’s a flow.
Unfortunately it’s not normally that simple. Many slope failures involve two of these types of motion, some involve all three, and in many cases, it’s not easy to tell how the material moved. The types of slope failure that we’ll cover here are summarized in Table \(\PageIndex{1}\).
| [Skip Table] | |||
| Failure Type | Type of Material | Type of Motion | Rate of Motion |
|---|---|---|---|
| Rock fall | Rock fragments | Vertical or near-vertical fall (plus bouncing in many cases) | Very fast (Greater than 10s of meters per second) |
| Rock slide | A large rock body | Motion as a unit along a planar surface (translational sliding) | Typically very slow (millimeters per year to centimeters per year), but some can be faster |
| Rock avalanche | A large rock body that slides and then breaks into small fragments | Flow (at high speeds the mass of rock fragments is suspended on a cushion of air) | Very fast (Greater than tens of meters per second) |
| Creep or solifluction | Soil or other overburden; in some cases, mixed with ice | Flow (although sliding motion may also occur) | Very slow (millimeters per year to centimeters per year) |
| Slump | Thick deposits (a metre to 10s of meters) of unconsolidated sediment | Motion as a unit along a curved surface (rotational sliding) | Slow (centimeters per year to meters per year) |
| Mudflow | Loose sediment with a significant component of silt and clay | Flow (a mixture of sediment and water moves down a channel) | Moderate to fast (centimeters per second to meters per second) |
| Debris flow | Sand, gravel, and larger fragments | Flow (similar to a mudflow, but typically faster) | Fast (meters per second) |
Rock Fall

Rock fragments can break off relatively easily from steep bedrock slopes, most commonly due to frost-wedging in areas where there are many freeze-thaw cycles per year. If you’ve ever hiked along a steep mountain trail on a cool morning, you might have heard the occasional fall of rock fragments onto a talus slope. This happens because the water between cracks freezes and expands overnight, and then when that same water thaws in the morning sun, the fragments that had been pushed beyond their limit by the ice fall to the slope below (Figure \(\PageIndex{2}\)).
A typical talus slope, near Keremeos in southern B.C., is shown in Figure \(\PageIndex{3}\). In December 2014, a large block of rock split away from a cliff in this same area. It broke into smaller pieces that tumbled down the slope and crashed into the road, smashing the concrete barriers and gouging out large parts of the pavement. Luckily no one was hurt.

Rock Slide
A rock slide is the sliding motion of rock along a sloping surface. In most cases, the movement is parallel to a fracture, bedding, or metamorphic foliation plane, and it can range from very slow to moderately fast. The word sackung describes the very slow motion of a block of rock (millimeters per year to centimeters per year) on a slope. A good example is the Downie Slide north of Revelstoke, B.C., which is shown in Figure \(\PageIndex{4}\). In this case, a massive body of rock is very slowly sliding down a steep slope along a plane of weakness that is approximately parallel to the slope. The Downie Slide, which was first recognized in the 1950s, prior to the construction of the Revelstoke Dam in the late 1970s, was moving very slowly at the time (a few centimeters per year). Geological engineers were concerned that the presence of water in the reservoir (visible in Figure \(\PageIndex{4}\)) could further weaken the plane of failure, leading to an acceleration of the motion. The result would have been a catastrophic failure into the reservoir that would have sent a wall of water over the dam and into the community of Revelstoke. During the construction of the dam they tunneled into the rock at the base of the slide and drilled hundreds of drainage holes upward into the plane of failure. This allowed water to drain out so that the pressure was reduced, which reduced the rate of movement of the sliding block. BC Hydro monitors this site continuously; the slide block is currently moving more slowly than it was prior to the construction of the dam.


In the summer of 2008, a large block of rock slid rapidly from a steep slope above Highway 99 near Porteau Cove (between Horseshoe Bay and Squamish). The block slammed into the highway and adjacent railway and broke into many pieces. The highway was closed for several days, and the slope was subsequently stabilized with rock bolts and drainage holes. As shown in Figure \(\PageIndex{5}\), the rock is fractured parallel to the slope, and this almost certainly contributed to the failure. However, it is not actually known what triggered this event as the weather was dry and warm during the preceding weeks, and there was no significant earthquake in the region.
Rock Avalanche

If a rock slides and then starts moving quickly (meters per second), the rock is likely to break into many small pieces, and at that point it turns into a rock avalanche, in which the large and small fragments of rock move in a fluid manner supported by a cushion of air within and beneath the moving mass. The 1965 Hope Slide (Figure \(\PageIndex{1}\)) was a rock avalanche, as was the famous 1903 Frank Slide in southwestern Alberta. The 2010 slide at Mount Meager (west of Lillooet) was also a rock avalanche, and rivals the Hope Slide as the largest slope failure in Canada during historical times (Figure \(\PageIndex{6}\)).
Creep or Solifluction

The very slow—millimeters per year to centimeters per year—movement of soil or other unconsolidated material on a slope is known as creep. Creep, which normally only affects the upper several centimeters of loose material, is typically a type of very slow flow, but in some cases, sliding may take place. Creep can be facilitated by freezing and thawing because, as shown in Figure \(\PageIndex{7}\), particles are lifted perpendicular to the surface by the growth of ice crystals within the soil, and then let down vertically by gravity when the ice melts. The same effect can be produced by frequent wetting and drying of the soil. In cold environments, solifluction is a more intense form of freeze-thaw-triggered creep.
Creep is most noticeable on moderate-to-steep slopes where trees, fence posts, or grave markers are consistently leaning in a downhill direction. In the case of trees, they try to correct their lean by growing upright, and this leads to a curved lower trunk known as a “pistol butt.” An example is shown on Figure \(\PageIndex{8}\).

Slump

Slump is a type of slide (movement as a mass) that takes place within thick unconsolidated deposits (typically thicker than 10 meters). Slumps involve movement along one or more curved failure surfaces, with downward motion near the top and outward motion toward the bottom (Figure \(\PageIndex{9}\)). They are typically caused by an excess of water within these materials on a steep slope.

An example of a slump in the Lethbridge area of Alberta is shown in Figure \(\PageIndex{10}\). This feature has likely been active for many decades, and moves a little more whenever there are heavy spring rains and significant snowmelt runoff. The toe of the slump is failing because it has been eroded by the small stream at the bottom.
Mudflows and Debris Flows

When a mass of sediment becomes completely saturated with water, the mass loses strength, to the extent that the grains are pushed apart, and it will flow, even on a gentle slope. This can happen during rapid spring snowmelt or heavy rains, and is also relatively common during volcanic eruptions because of the rapid melting of snow and ice. (A mudflow or debris flow on a volcano or during a volcanic eruption is a lahar.) If the material involved is primarily sand-sized or smaller, it is known as a mudflow, such as the one shown in Figure \(\PageIndex{11}\).
If the material involved is gravel sized or larger, it is known as a debris flow. Because it takes more gravitational energy to move larger particles, a debris flow typically forms in an area with steeper slopes and more water than does a mudflow. In many cases, a debris flow takes place within a steep stream channel, and is triggered by the collapse of bank material into the stream. This creates a temporary dam, and then a major flow of water and debris when the dam breaks. This is the situation that led to the fatal debris flow at Johnsons Landing, B.C., in 2012. A typical west-coast debris flow is shown in Figure \(\PageIndex{12}\). This event took place in November 2006 in response to very heavy rainfall. There was enough energy to move large boulders and to knock over large trees.

Factors that Control Slope Stability
Mass wasting happens because tectonic processes have created uplift. Erosion, driven by gravity, is the inevitable response to that uplift, and various types of erosion, including mass wasting, have created slopes in the uplifted regions. Slope stability is ultimately determined by two factors: the angle of the slope and the strength of the materials on it.

Figure \(\PageIndex{13}\) shows a block of rock situated on a rock slope. The block is being pulled toward Earth’s centre (vertically down) by gravity. We can split the vertical gravitational force into two components relative to the slope: one pushing the block down the slope (the shear force), and the other pushing into the slope (the normal force). The shear force, which wants to push the block down the slope, has to overcome the strength of the connection between the block and the slope, which may be quite weak if the block has split away from the main body of rock, or may be very strong if the block is still a part of the rock. This is the shear strength, and in Figure \(\PageIndex{13}\)a, it is greater than the shear force, so the block should not move. In Figure \(\PageIndex{13}\)b the slope is steeper and the shear force is approximately equal to the shear strength. The block may or may not move under these circumstances. In Figure \(\PageIndex{13}\)c, the slope is steeper still, so the shear force is considerably greater than the shear strength, and the block will very likely move.
As already noted, slopes are created by uplift followed by erosion. In areas with relatively recent uplift (such as most of British Columbia and the western part of Alberta), slopes tend to be quite steep. This is especially true where glaciation has taken place because glaciers in mountainous terrain create steep-sided valleys. In areas without recent uplift (such as central Canada), slopes are less steep because hundreds of millions of years of erosion (including mass wasting) has made them that way. However, as we’ll see, some mass wasting can happen even on relatively gentle slopes.
The strength of the materials on slopes can vary widely. Solid rocks tend to be strong, but there is a very wide range of rock strength. If we consider just the strength of the rocks, and ignore issues like fracturing and layering, then most crystalline rocks—like granite, basalt, or gneiss—are very strong, while some metamorphic rocks—like schist—are moderately strong. Sedimentary rocks have variable strength. Dolostone and some limestone are strong, most sandstone and conglomerate are moderately strong, and some sandstone and all mudstones are quite weak.
Fractures, metamorphic foliation, or bedding can significantly reduce the strength of a body of rock, and in the context of mass wasting, this is most critical if the planes of weakness are parallel to the slope and least critical if they are perpendicular to the slope. This is illustrated in Figure \(\PageIndex{14}\). At locations A and B the bedding is nearly perpendicular to the slope and the situation is relatively stable. At location D the bedding is nearly parallel to the slope and the situation is quite unstable. At location C the bedding is nearly horizontal and the stability is intermediate between the other two extremes.

Internal variations in the composition and structure of rocks can significantly affect their strength. Schist, for example, may have layers that are rich in sheet silicates (mica or chlorite) and these will tend to be weaker than other layers. Some minerals tend to be more susceptible to weathering than others, and the weathered products are commonly quite weak (e.g., the clay formed from feldspar). The side of Johnson Peak that failed in 1965 (Hope Slide) is made up of chlorite schist (metamorphosed sea-floor basalt) that has feldspar-bearing sills within it (they are evident within the inset area of Figure \(\PageIndex{1}\)). The foliation and the sills are parallel to the steep slope. The schist is relatively weak to begin with, and the feldspar in the sills, which has been altered to clay, makes it even weaker.
Unconsolidated sediments are generally weaker than sedimentary rocks because they are not cemented and, in most cases, have not been significantly compressed by overlying materials. This binding property of sediment is sometimes referred to as cohesion. Sand and silt tend to be particularly weak, clay is generally a little stronger, and sand mixed with clay can be stronger still. The deposits that make up the cliffs at Point Grey in Vancouver include sand, silt, and clay overlain by sand. As shown in Figure \(\PageIndex{15}\) (left) the finer deposits are relatively strong (they maintain a steep slope), while the overlying sand is relatively weak, and has a shallower slope that has recently failed. Glacial till—typically a mixture of clay, silt, sand, gravel, and larger clasts—forms and is compressed beneath tens to thousands of meters of glacial ice so it can be as strong as some sedimentary rock (Figure \(\PageIndex{15}\), right).
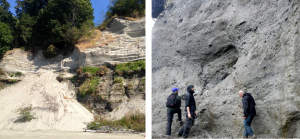 Figure \(\PageIndex{15}\) Left: Glacial outwash deposits at Point Grey, in Vancouver. The dark lower layer is made up of sand, silt, and clay. The light upper layer is well-sorted sand. Right: Glacial till on Quadra Island, B.C. The till is strong enough to have formed a near-vertical slope. © Steven Earle. CC BY
Apart from the type of material on a slope, the amount of water that the material contains is the most important factor controlling its strength. This is especially true for unconsolidated materials, like those shown in Figure \(\PageIndex{15}\), but it also applies to bodies of rock. Granular sediments, like the sand at Point Grey, have lots of spaces between the grains. Those spaces may be completely dry (filled only with air); or moist (often meaning that some spaces are water filled, some grains have a film of water around them, and small amounts of water are present where grains are touching each other); or completely saturated (Figure \(\PageIndex{16}\)). Unconsolidated sediments tend to be strongest when they are moist because the small amounts of water at the grain boundaries hold the grains together with surface tension. Dry sediments are held together only by the friction between grains, and if they are well sorted or well rounded, or both, that cohesion is weak. Saturated sediments tend to be the weakest of all because the large amount of water actually pushes the grains apart, reducing the mount friction between grains. This is especially true if the water is under pressure.

Water will also reduce the strength of solid rock, especially if it has fractures, bedding planes, or clay-bearing zones. This effect is even more significant when the water is under pressure, which is why you’ll often see holes drilled into rocks on road cuts to relieve this pressure. One of the hypotheses advanced to explain the 1965 Hope Slide is that the very cold conditions that winter caused small springs in the lower part of the slope to freeze over, preventing water from flowing out. It is possible that water pressure gradually built up within the slope, weakening the rock mass to the extent that the shear strength was no longer greater than the shear force.
Water also has a particular effect on clay-bearing materials. All clay minerals will absorb a little bit of water, and this reduces their strength. The smectite clays (such as the bentonite used in cat litter) can absorb a lot of water, and that water pushes the sheets apart at a molecular level and makes the mineral swell. Smectite that has expanded in this way has almost no strength; it is extremely slippery.
And finally, water can significantly increase the mass of the material on a slope, which increases the gravitational force pushing it down. A body of sediment that has 25% porosity and is saturated with water weighs approximately 13% more than it does when it is completely dry, so the gravitational shear force is also 13% higher. In the situation shown in Figure 15.2b, a 13% increase in the shear force could easily be enough to tip the balance between shear force and shear strength.
Mass-Wasting Triggers
In the previous section, we talked about the shear force and the shear strength of materials on slopes, and about factors that can reduce the shear strength. Shear force is primarily related to slope angle, and this does not change quickly. But shear strength can change quickly for a variety of reasons, and events that lead to a rapid reduction in shear strength are considered to be triggers for mass wasting.
An increase in water content is the most common mass-wasting trigger. This can result from rapid melting of snow or ice, heavy rain, or some type of event that changes the pattern of water flow on the surface. Rapid melting can be caused by a dramatic increase in temperature (e.g., in spring or early summer) or by a volcanic eruption. Heavy rains are typically related to major storms. Changes in water flow patterns can be caused by earthquakes, previous slope failures that dam up streams, or human structures that interfere with runoff (e.g., buildings, roads, or parking lots). An example of this is the deadly January 2005 debris flow in North Vancouver in the Riverside Drive area. The debris flow happened during a rainy period, but was likely triggered by excess runoff related to the roads at the top of this slope and by landscape features, including a pool. The 2005 failure took place in an area that had failed previously, and a report written in 1980 recommended that the municipal authorities and residents take steps to address surface and slope drainage issues. Little was done to improve the situation.
In some cases, a decrease in water content can lead to failure. This is most common with clean sand deposits (e.g., the upper layer in Figure \(\PageIndex{15}\) (left)), which lose strength when there is no water to hold the grains together.
Freezing and thawing can also trigger some forms of mass wasting. More specifically, the thawing can release a block of rock that was attached to a slope by a film of ice.
One other process that can weaken a body of rock or sediment is shaking. The most obvious source of shaking is an earthquake, but shaking from highway traffic, construction, or mining will also do the job. Several deadly mass-wasting events (including snow avalanches) were triggered by the M7.8 earthquake in Nepal in April 2015.
Saturation with water and then seismic shaking led to the occurrence of thousands of slope failures in the Sapporo area of Hokkaido, Japan in September 2018, as shown on Figure \(\PageIndex{18}\). The area was drenched with rain from tropical storm Jebi on September 4th. On September 6th it was shaken by a M6.6 earthquake which triggered debris flows in the water-saturated volcanic materials on steep slopes. There were 41 deaths related to the slope failures.
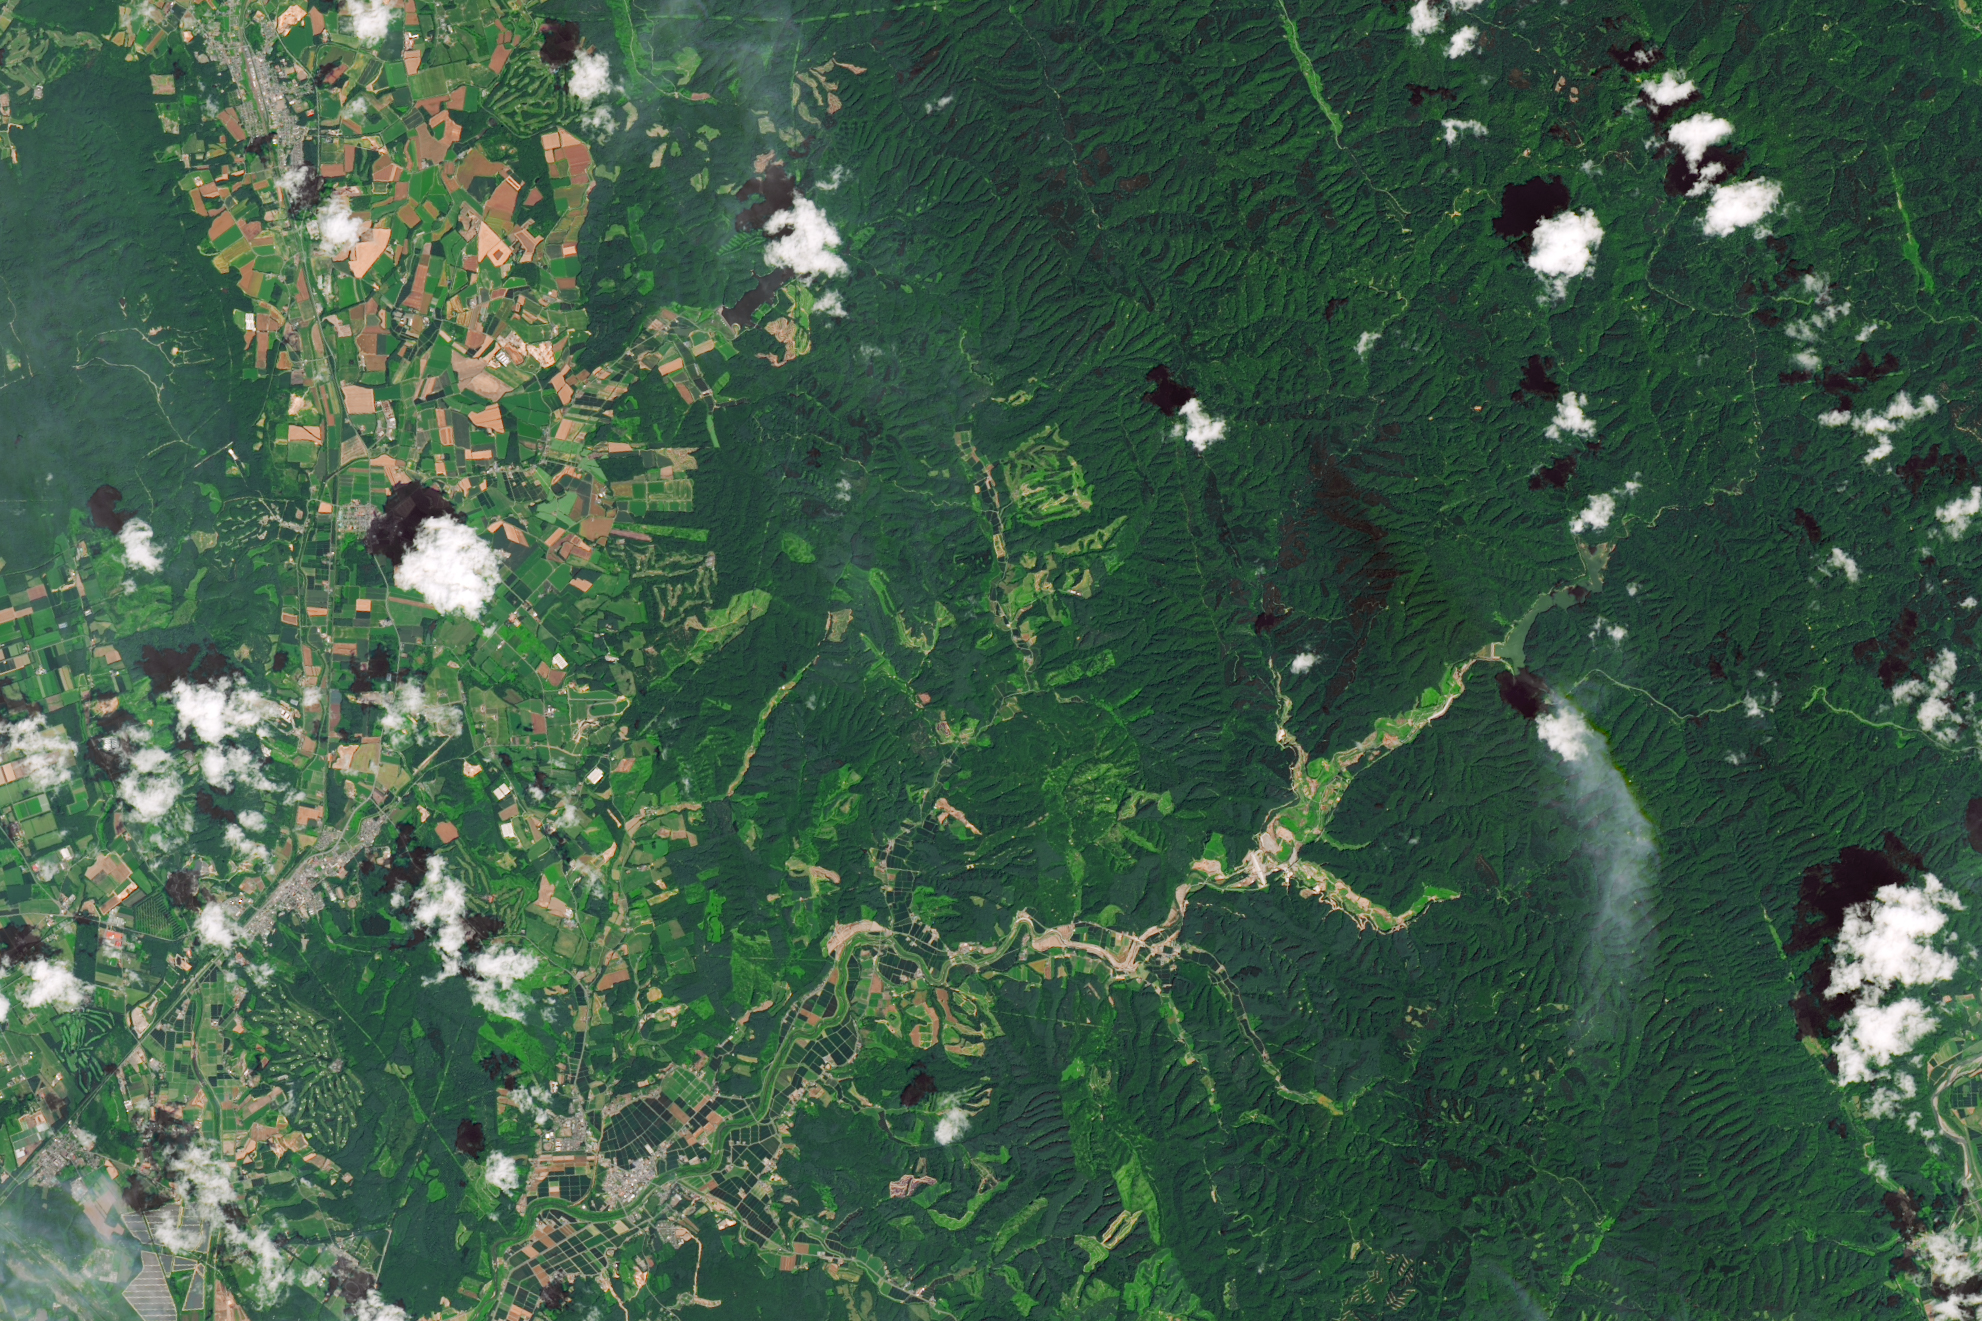
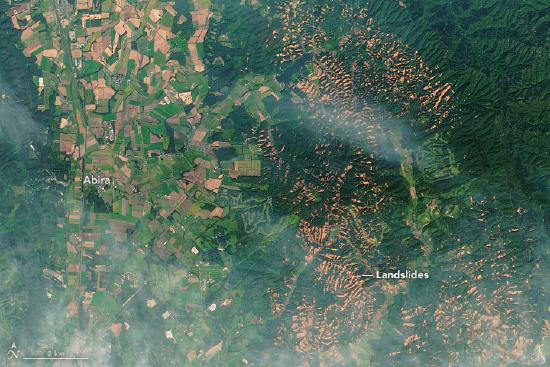 Figure \(\PageIndex{18}\) Slope failures in the Sapporo area of Japan following a typhoon (Sept. 4th, 2018) and earthquake (Sept. 6th, 2018) (Before and after Landsat 8 images: top: July 2017, bottom: September 2018). Source: “Landslides in Hokkaido” by Lauren Dauphin, NASA Earth Observatory. Public domain.
Contributors and Attributions
References
- Rogers, G. and Dragert, H., 2003, Episodic tremor and slip on the Cascadia subduction zone: the chatter of silent slip, Science, V. 300, p. 1942-1943. ↵
Contributors and Attributions
Modified by Kyle Whittinghill from the following sources
- What is an Earthquake from Physical Geology by Steven Earle (licensed under a Creative Commons Attribution 4.0 International License)
- The Physical World from Environmental Science: A Canadian Perspective by Bill Freedman (Creative Commons Attribution NonCommercial)
- Volcanism and Volcanic Hazards from Physical Geology by Steven Earle (licensed under a Creative Commons Attribution 4.0 International License)
- The Solid Earth from AP Environmental Science by University of California College Prep
- The Physical World from Environmental Science: A Canadian Perspective by Bill Freedman (Creative Commons Attribution NonCommercial)
- Mass Wasting, Factors that Control Slope Stability, and Classification of Mass Wasting from Physical Geology by Steven Earle (licensed under a Creative Commons Attribution . International License)