Biology LibreTexts

13.1: Food Security

  • Page ID
    69481
  • \( \newcommand{\vecs}[1]{\overset { \scriptstyle \rightharpoonup} {\mathbf{#1}} } \)

    \( \newcommand{\vecd}[1]{\overset{-\!-\!\rightharpoonup}{\vphantom{a}\smash {#1}}} \)

    \( \newcommand{\id}{\mathrm{id}}\) \( \newcommand{\Span}{\mathrm{span}}\)

    ( \newcommand{\kernel}{\mathrm{null}\,}\) \( \newcommand{\range}{\mathrm{range}\,}\)

    \( \newcommand{\RealPart}{\mathrm{Re}}\) \( \newcommand{\ImaginaryPart}{\mathrm{Im}}\)

    \( \newcommand{\Argument}{\mathrm{Arg}}\) \( \newcommand{\norm}[1]{\| #1 \|}\)

    \( \newcommand{\inner}[2]{\langle #1, #2 \rangle}\)

    \( \newcommand{\Span}{\mathrm{span}}\)

    \( \newcommand{\id}{\mathrm{id}}\)

    \( \newcommand{\Span}{\mathrm{span}}\)

    \( \newcommand{\kernel}{\mathrm{null}\,}\)

    \( \newcommand{\range}{\mathrm{range}\,}\)

    \( \newcommand{\RealPart}{\mathrm{Re}}\)

    \( \newcommand{\ImaginaryPart}{\mathrm{Im}}\)

    \( \newcommand{\Argument}{\mathrm{Arg}}\)

    \( \newcommand{\norm}[1]{\| #1 \|}\)

    \( \newcommand{\inner}[2]{\langle #1, #2 \rangle}\)

    \( \newcommand{\Span}{\mathrm{span}}\) \( \newcommand{\AA}{\unicode[.8,0]{x212B}}\)

    \( \newcommand{\vectorA}[1]{\vec{#1}}      % arrow\)

    \( \newcommand{\vectorAt}[1]{\vec{\text{#1}}}      % arrow\)

    \( \newcommand{\vectorB}[1]{\overset { \scriptstyle \rightharpoonup} {\mathbf{#1}} } \)

    \( \newcommand{\vectorC}[1]{\textbf{#1}} \)

    \( \newcommand{\vectorD}[1]{\overrightarrow{#1}} \)

    \( \newcommand{\vectorDt}[1]{\overrightarrow{\text{#1}}} \)

    \( \newcommand{\vectE}[1]{\overset{-\!-\!\rightharpoonup}{\vphantom{a}\smash{\mathbf {#1}}}} \)

    \( \newcommand{\vecs}[1]{\overset { \scriptstyle \rightharpoonup} {\mathbf{#1}} } \)

    \( \newcommand{\vecd}[1]{\overset{-\!-\!\rightharpoonup}{\vphantom{a}\smash {#1}}} \)

    \(\newcommand{\avec}{\mathbf a}\) \(\newcommand{\bvec}{\mathbf b}\) \(\newcommand{\cvec}{\mathbf c}\) \(\newcommand{\dvec}{\mathbf d}\) \(\newcommand{\dtil}{\widetilde{\mathbf d}}\) \(\newcommand{\evec}{\mathbf e}\) \(\newcommand{\fvec}{\mathbf f}\) \(\newcommand{\nvec}{\mathbf n}\) \(\newcommand{\pvec}{\mathbf p}\) \(\newcommand{\qvec}{\mathbf q}\) \(\newcommand{\svec}{\mathbf s}\) \(\newcommand{\tvec}{\mathbf t}\) \(\newcommand{\uvec}{\mathbf u}\) \(\newcommand{\vvec}{\mathbf v}\) \(\newcommand{\wvec}{\mathbf w}\) \(\newcommand{\xvec}{\mathbf x}\) \(\newcommand{\yvec}{\mathbf y}\) \(\newcommand{\zvec}{\mathbf z}\) \(\newcommand{\rvec}{\mathbf r}\) \(\newcommand{\mvec}{\mathbf m}\) \(\newcommand{\zerovec}{\mathbf 0}\) \(\newcommand{\onevec}{\mathbf 1}\) \(\newcommand{\real}{\mathbb R}\) \(\newcommand{\twovec}[2]{\left[\begin{array}{r}#1 \\ #2 \end{array}\right]}\) \(\newcommand{\ctwovec}[2]{\left[\begin{array}{c}#1 \\ #2 \end{array}\right]}\) \(\newcommand{\threevec}[3]{\left[\begin{array}{r}#1 \\ #2 \\ #3 \end{array}\right]}\) \(\newcommand{\cthreevec}[3]{\left[\begin{array}{c}#1 \\ #2 \\ #3 \end{array}\right]}\) \(\newcommand{\fourvec}[4]{\left[\begin{array}{r}#1 \\ #2 \\ #3 \\ #4 \end{array}\right]}\) \(\newcommand{\cfourvec}[4]{\left[\begin{array}{c}#1 \\ #2 \\ #3 \\ #4 \end{array}\right]}\) \(\newcommand{\fivevec}[5]{\left[\begin{array}{r}#1 \\ #2 \\ #3 \\ #4 \\ #5 \\ \end{array}\right]}\) \(\newcommand{\cfivevec}[5]{\left[\begin{array}{c}#1 \\ #2 \\ #3 \\ #4 \\ #5 \\ \end{array}\right]}\) \(\newcommand{\mattwo}[4]{\left[\begin{array}{rr}#1 \amp #2 \\ #3 \amp #4 \\ \end{array}\right]}\) \(\newcommand{\laspan}[1]{\text{Span}\{#1\}}\) \(\newcommand{\bcal}{\cal B}\) \(\newcommand{\ccal}{\cal C}\) \(\newcommand{\scal}{\cal S}\) \(\newcommand{\wcal}{\cal W}\) \(\newcommand{\ecal}{\cal E}\) \(\newcommand{\coords}[2]{\left\{#1\right\}_{#2}}\) \(\newcommand{\gray}[1]{\color{gray}{#1}}\) \(\newcommand{\lgray}[1]{\color{lightgray}{#1}}\) \(\newcommand{\rank}{\operatorname{rank}}\) \(\newcommand{\row}{\text{Row}}\) \(\newcommand{\col}{\text{Col}}\) \(\renewcommand{\row}{\text{Row}}\) \(\newcommand{\nul}{\text{Nul}}\) \(\newcommand{\var}{\text{Var}}\) \(\newcommand{\corr}{\text{corr}}\) \(\newcommand{\len}[1]{\left|#1\right|}\) \(\newcommand{\bbar}{\overline{\bvec}}\) \(\newcommand{\bhat}{\widehat{\bvec}}\) \(\newcommand{\bperp}{\bvec^\perp}\) \(\newcommand{\xhat}{\widehat{\xvec}}\) \(\newcommand{\vhat}{\widehat{\vvec}}\) \(\newcommand{\uhat}{\widehat{\uvec}}\) \(\newcommand{\what}{\widehat{\wvec}}\) \(\newcommand{\Sighat}{\widehat{\Sigma}}\) \(\newcommand{\lt}{<}\) \(\newcommand{\gt}{>}\) \(\newcommand{\amp}{&}\) \(\definecolor{fillinmathshade}{gray}{0.9}\)

    Progress continues in the fight against hunger, yet an unacceptably large number of people lack the food they need for an active and healthy life. In 2019, 690 million people in the world (8.9%) were undernourished (lacked sufficient calories; see The State of Food Security...), and 8.2% of the global population lived in poverty (see Goal 1...). Poverty is internationally defined as living on less than $1.90 per day. Poverty—not food availability—is the major driver of food insecurity. Improvements in agricultural productivity are necessary to increase rural household incomes and access to available food but are insufficient to ensure food security. Evidence indicates that poverty reduction and food security do not necessarily move in tandem. The main problem is lack of economic (social and physical) access to food at national and household levels and inadequate nutrition. Food security not only requires an adequate supply of food but also entails availability, access, and utilization by all—people of all ages, gender, ethnicity, religion, and socioeconomic levels.

    From Agriculture to Food Security

    Agriculture and food security are inextricably linked. The agricultural sector in each country is dependent on the available natural resources, as well as the politics that govern those resources. Staple food crops are the main source of dietary energy in the human diet and include things such as rice, wheat, sweet potatoes, maize (corn), and cassava (figure \(\PageIndex{a}\)).

    Cassava tubers are long, brown roots. One is broken open revealing broken interior.
    Figure \(\PageIndex{a}\): Cassava tubers are a staple food crop in tropical regions. Image by Renatosjoao (CC-BY-SA).

    Food Security

    An individual must have access to food in ample quantity and of sufficient nutritional quality at all times to be food secure. Those who never have sufficient quality food are chronically food insecure. Food security is determined by availability, access, and utilization.

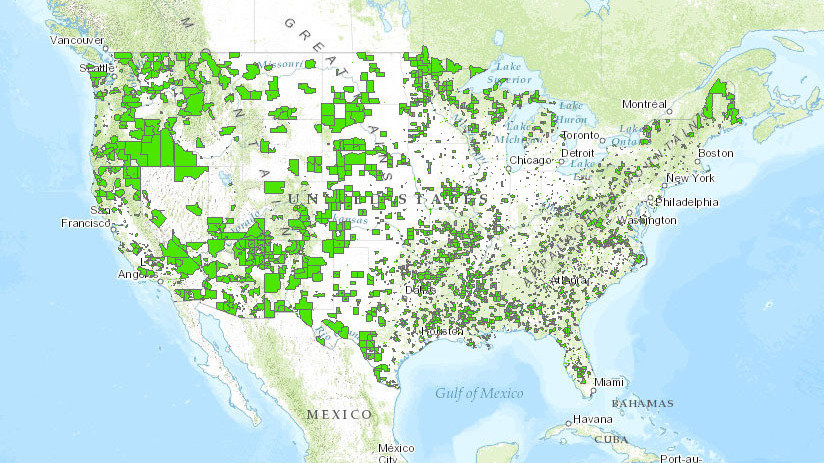
    Food availability refers to whether enough food is produced globally to feed the world's population. In fact, enough food is produced globally, but it is not accessible to everyone who needs it. Food access refers to the ability to obtain food in ample quantity and of nutritional quality. In the United States, residents of food deserts face limited access to nutritious foods, particularly fresh produce (figure \(\PageIndex{b}\)). This problem is compounded when residents do not own a vehicle or have access to public transportation to obtain foods from surrounding areas or lack the funds to do so.

    Map of the contiguous United States shading food deserts.
    Figure \(\PageIndex{b}\): Food deserts in the contiguous United States are shaded in bright green. Food deserts are distributed over the United States. Examples of large food deserts are in southeastern Oregon and northeastern Arizona. Image by Economic Research Services, USDA (public domain).

    Food utilization essentially translates the food available to a household into nutritional security for its members. One aspect of utilization is analyzed in terms of distribution according to need. Nutritional standards exist for the actual nutritional needs, which differ by gender, age, and life phase (for example, pregnancy), but these “needs” are often socially constructed based on culture. For example, in South Asia evidence shows that women eat after everyone else has eaten and are less likely than men in the same household to consume preferred foods such as meats and fish.

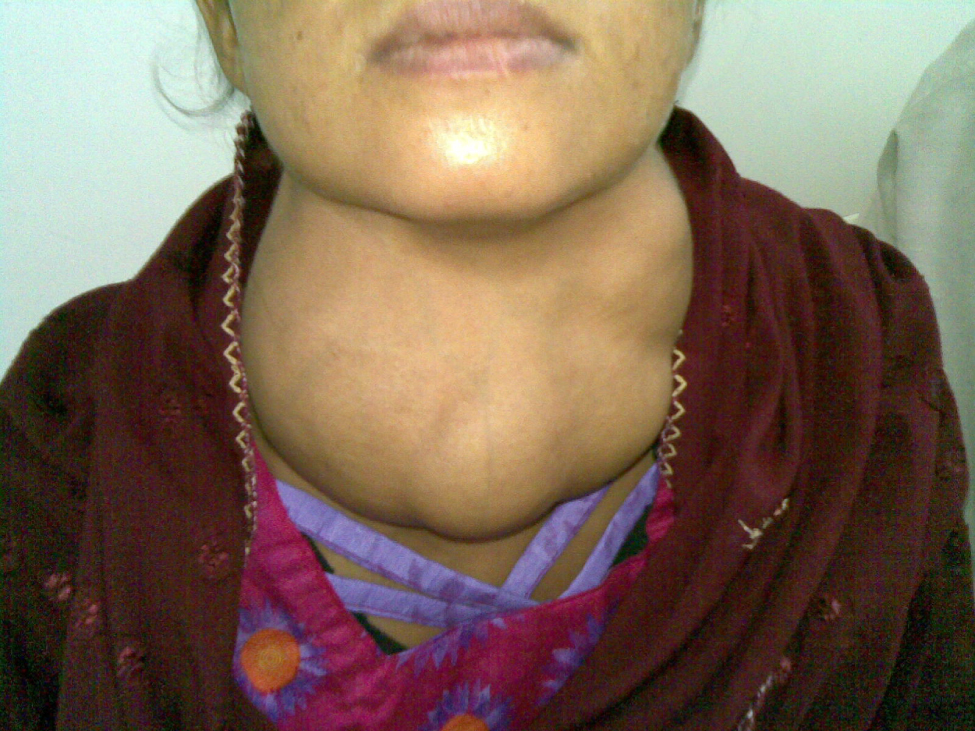
    Food insecurity can result in undernourishment and malnutrition (a lack of essential nutrients; figure \(\PageIndex{c}\)). The economic costs of undernourishment and malnutrition are substantial, potentially costing individuals 10% of their lifetime earnings and costing nations 2-3% of gross domestic product (GDP) in the worst-affected countries (Alderman 2005). This in part due to the reduced ability of under- and malnourished individuals to work. Additionally, without proper nutrition, children can develop disabilities that make it more difficult for them to join to workforce as adults. The economic costs reported here do not even account for the healthcare costs associated with under- and malnutrition.

    A goiter on a woman's neck. It is an expanded, lumpy structure.
    Figure \(\PageIndex{c}\): A goiter is an enlarged thyroid gland that can result from deficiency of iodine, an essential nutrient. Iodized salt, commonly used in the United States, is one strategy to prevent iodine deficiencies. Image by Almazi/OpenStax (CC-BY). Access for free at openstax.org.

    Obesity

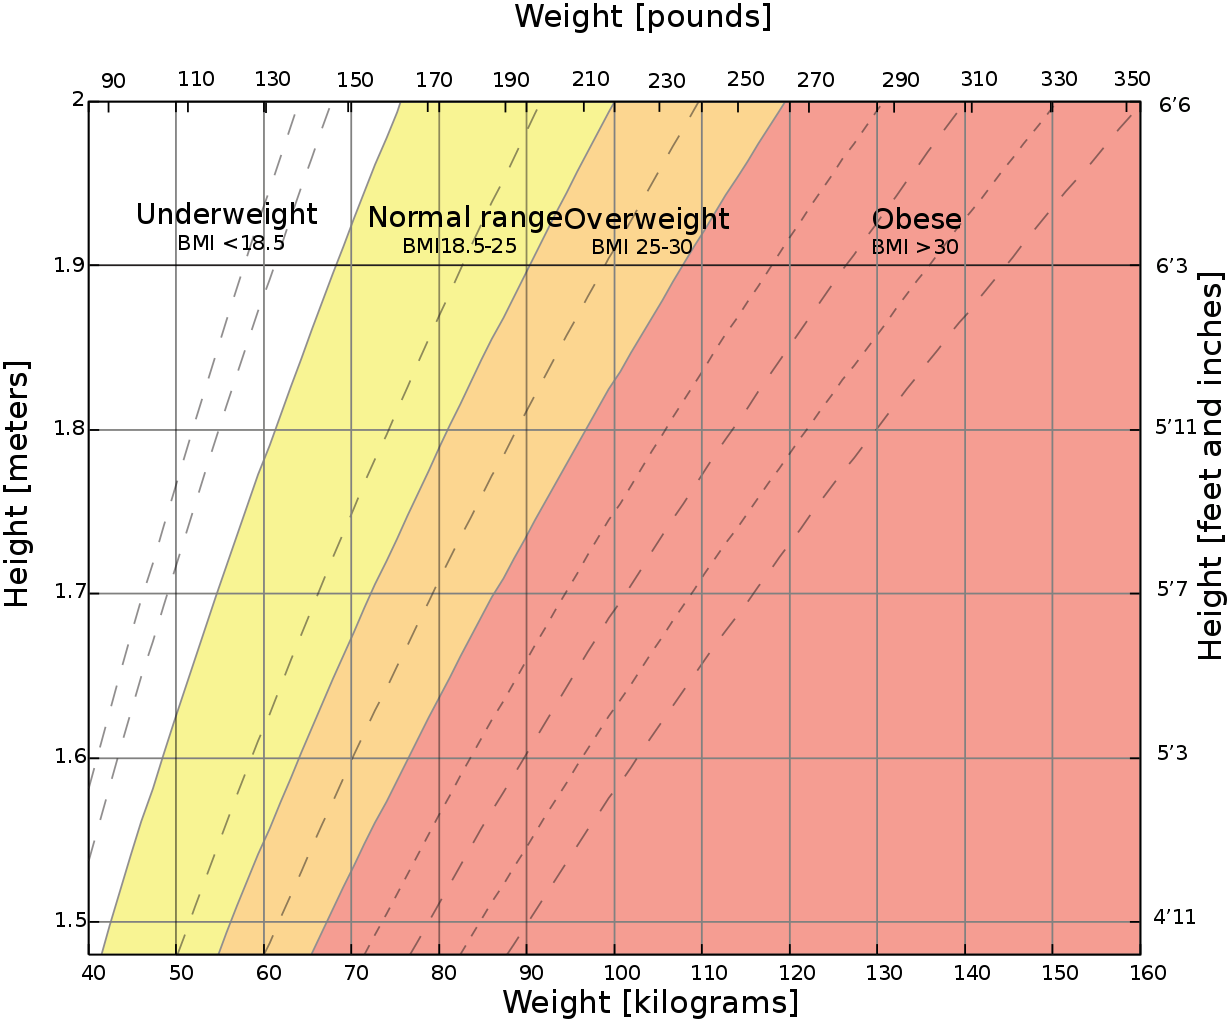
    Obesity means having excess body fat resulting in a body mass index (BMI) of 30 or higher, and overweight individuals have a BMI of 25 or higher (figure \(\PageIndex{d}\)). BMI is a common metric for obesity because it is determined based on weight and height; however, an individual with a big bone structure and/or high muscle mass could have a high BMI without facing the health risks associated with obesity. Likewise, an individual with excess body fat but little muscle mass might have a "healthy" BMI, but their excess body fat could still compromise their health. For these reasons, some experts rely on other metrics, such as relative fat mass (RFM). Relative fat mass is equal to height divided by waist circumference multiplied by 76 for females or 64 for males. An RFM of 32% or higher for females and 25% or higher for males is considered obese. Harvard Chan School of Public Health provides a thorough discussion of the advantages and disadvantages of various obesity metrics.

    Graph of weight and height. Areas of the graph are shaded in different colors indicating body mass index categories.
    Figure \(\PageIndex{d}\): This graph shows BMI categories based on height and weight. Height in feet and inches is on the right axis, and weight in pounds is on the top axis. There are four BMI categories: underweight (< 18.5), normal (18.5-25), overweight (25-30), and obese (> 30). BMI is calculated as mass divided by height squared (kg/m2). Image by InvictaHOG (public domain).

    Obesity has become a significant global health challenge, yet is preventable and reversible. Since the 1970s, obesity rates have rapidly increased, resulting in a global obesity epidemic. Thirty-nine percent of the world's adults, or 1.9 billion people, are overweight in 2016. Of these, 650 million are obese (Obesity and Overweight). Obesity was linked to 4.7 million premature deaths in 2017 (about 8% of all deaths that year; Hannah/Our World in Data). The economic cost of obesity has been estimated at $2 trillion (Tremmel et al.).

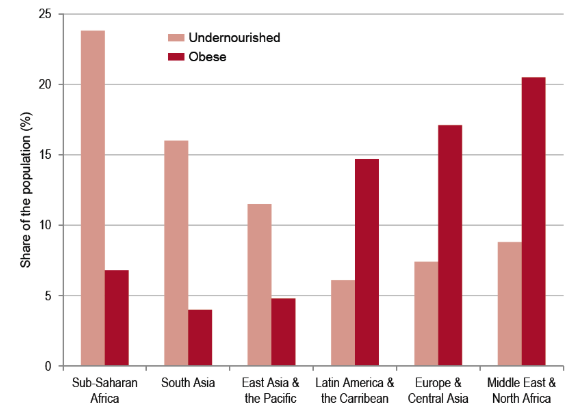
    Initially centered in developed countries, the obesity epidemic now affects countries of all economic statuses. In low-income countries, this results in a triple burden of undernourishment, malnutrition, and obesity. There is significant variation by region; some have very high rates of undernourishment and low rates of obesity, while in other regions the opposite is true (figure \(\PageIndex{e}\)).

    Bar graph of undernourishment and obesity in six regions of the world. The two are not necessarily correlated.
    Figure \(\PageIndex{e}\): Obesity (red bars on the right) and undernourishment (pink bars on the left) by region. The share of the population (%) that is undernourished is approximately 24% in Sub-Saharan Africa while approximately 7% of the population in this region is obese. For South Asia 16% of the population is undernourished, and 4% is obese. These percentages 11% and 5% for East Asia and the Pacific, 5% and 15% for Latin America and the Caribbean, 7% and 17% for Europe and Central Asia, and 9% and 20% for the Middle East and North Africa, respectively.

    Obesity accounts for a growing level and share of worldwide noncommunicable diseases, including diabetes, heart disease, and certain cancers that can reduce quality of life and increase public health costs of already under-resourced developing countries. Driven primarily by increasing availability of processed, affordable, and effectively marketed food, the global food system is falling short with rising obesity and related poor health outcomes. Due to established health implications and rapid increase in prevalence, obesity is now a recognized major global health challenge.

    References

    Alderman, H. 2005. Linkages between Poverty Reduction Strategies and Child Nutrition: An Asian PerspectiveEconomic and Political Weekly, 40(46), 4837-4842. Accessed 2021-01-03.

    Hannah Ritchie. 2017. Obesity. Our World in Data. Accessed 2021-01-03.

    Goal 1: End poverty in all its forms everywhere. Sustainable Development. Department of Economic and Social Affairs. United Nations. Accessed 2021-01-03.

    Obesity and Overweight. 2020. World Health Organization. Accessed 2021-01-03.

    The State of Food Security and Nutrition in the World in 2020. Food and Agriculture Organization of the United Nations. Accessed 2021-01-03.

    Tremmel, M., Gerdtham, U. G., Nilsson, P. M., & Saha, S. 2017. Economic Burden of Obesity: A Systematic Literature ReviewInternational journal of environmental research and public health14(4), 435. Accessed 2021-01-03.

    Attribution

    Modified by Melissa Ha from Food Security from Environmental Biology by Matthew R. Fisher (licensed under CC-BY)


    This page titled 13.1: Food Security is shared under a CC BY-NC-SA license and was authored, remixed, and/or curated by Melissa Ha and Rachel Schleiger (ASCCC Open Educational Resources Initiative) .