
10.2: Environmental Challenges of Urbanization
- Page ID
- 76237
\( \newcommand{\vecs}[1]{\overset { \scriptstyle \rightharpoonup} {\mathbf{#1}} } \)
\( \newcommand{\vecd}[1]{\overset{-\!-\!\rightharpoonup}{\vphantom{a}\smash {#1}}} \)
\( \newcommand{\dsum}{\displaystyle\sum\limits} \)
\( \newcommand{\dint}{\displaystyle\int\limits} \)
\( \newcommand{\dlim}{\displaystyle\lim\limits} \)
\( \newcommand{\id}{\mathrm{id}}\) \( \newcommand{\Span}{\mathrm{span}}\)
( \newcommand{\kernel}{\mathrm{null}\,}\) \( \newcommand{\range}{\mathrm{range}\,}\)
\( \newcommand{\RealPart}{\mathrm{Re}}\) \( \newcommand{\ImaginaryPart}{\mathrm{Im}}\)
\( \newcommand{\Argument}{\mathrm{Arg}}\) \( \newcommand{\norm}[1]{\| #1 \|}\)
\( \newcommand{\inner}[2]{\langle #1, #2 \rangle}\)
\( \newcommand{\Span}{\mathrm{span}}\)
\( \newcommand{\id}{\mathrm{id}}\)
\( \newcommand{\Span}{\mathrm{span}}\)
\( \newcommand{\kernel}{\mathrm{null}\,}\)
\( \newcommand{\range}{\mathrm{range}\,}\)
\( \newcommand{\RealPart}{\mathrm{Re}}\)
\( \newcommand{\ImaginaryPart}{\mathrm{Im}}\)
\( \newcommand{\Argument}{\mathrm{Arg}}\)
\( \newcommand{\norm}[1]{\| #1 \|}\)
\( \newcommand{\inner}[2]{\langle #1, #2 \rangle}\)
\( \newcommand{\Span}{\mathrm{span}}\) \( \newcommand{\AA}{\unicode[.8,0]{x212B}}\)
\( \newcommand{\vectorA}[1]{\vec{#1}} % arrow\)
\( \newcommand{\vectorAt}[1]{\vec{\text{#1}}} % arrow\)
\( \newcommand{\vectorB}[1]{\overset { \scriptstyle \rightharpoonup} {\mathbf{#1}} } \)
\( \newcommand{\vectorC}[1]{\textbf{#1}} \)
\( \newcommand{\vectorD}[1]{\overrightarrow{#1}} \)
\( \newcommand{\vectorDt}[1]{\overrightarrow{\text{#1}}} \)
\( \newcommand{\vectE}[1]{\overset{-\!-\!\rightharpoonup}{\vphantom{a}\smash{\mathbf {#1}}}} \)
\( \newcommand{\vecs}[1]{\overset { \scriptstyle \rightharpoonup} {\mathbf{#1}} } \)
\(\newcommand{\longvect}{\overrightarrow}\)
\( \newcommand{\vecd}[1]{\overset{-\!-\!\rightharpoonup}{\vphantom{a}\smash {#1}}} \)
\(\newcommand{\avec}{\mathbf a}\) \(\newcommand{\bvec}{\mathbf b}\) \(\newcommand{\cvec}{\mathbf c}\) \(\newcommand{\dvec}{\mathbf d}\) \(\newcommand{\dtil}{\widetilde{\mathbf d}}\) \(\newcommand{\evec}{\mathbf e}\) \(\newcommand{\fvec}{\mathbf f}\) \(\newcommand{\nvec}{\mathbf n}\) \(\newcommand{\pvec}{\mathbf p}\) \(\newcommand{\qvec}{\mathbf q}\) \(\newcommand{\svec}{\mathbf s}\) \(\newcommand{\tvec}{\mathbf t}\) \(\newcommand{\uvec}{\mathbf u}\) \(\newcommand{\vvec}{\mathbf v}\) \(\newcommand{\wvec}{\mathbf w}\) \(\newcommand{\xvec}{\mathbf x}\) \(\newcommand{\yvec}{\mathbf y}\) \(\newcommand{\zvec}{\mathbf z}\) \(\newcommand{\rvec}{\mathbf r}\) \(\newcommand{\mvec}{\mathbf m}\) \(\newcommand{\zerovec}{\mathbf 0}\) \(\newcommand{\onevec}{\mathbf 1}\) \(\newcommand{\real}{\mathbb R}\) \(\newcommand{\twovec}[2]{\left[\begin{array}{r}#1 \\ #2 \end{array}\right]}\) \(\newcommand{\ctwovec}[2]{\left[\begin{array}{c}#1 \\ #2 \end{array}\right]}\) \(\newcommand{\threevec}[3]{\left[\begin{array}{r}#1 \\ #2 \\ #3 \end{array}\right]}\) \(\newcommand{\cthreevec}[3]{\left[\begin{array}{c}#1 \\ #2 \\ #3 \end{array}\right]}\) \(\newcommand{\fourvec}[4]{\left[\begin{array}{r}#1 \\ #2 \\ #3 \\ #4 \end{array}\right]}\) \(\newcommand{\cfourvec}[4]{\left[\begin{array}{c}#1 \\ #2 \\ #3 \\ #4 \end{array}\right]}\) \(\newcommand{\fivevec}[5]{\left[\begin{array}{r}#1 \\ #2 \\ #3 \\ #4 \\ #5 \\ \end{array}\right]}\) \(\newcommand{\cfivevec}[5]{\left[\begin{array}{c}#1 \\ #2 \\ #3 \\ #4 \\ #5 \\ \end{array}\right]}\) \(\newcommand{\mattwo}[4]{\left[\begin{array}{rr}#1 \amp #2 \\ #3 \amp #4 \\ \end{array}\right]}\) \(\newcommand{\laspan}[1]{\text{Span}\{#1\}}\) \(\newcommand{\bcal}{\cal B}\) \(\newcommand{\ccal}{\cal C}\) \(\newcommand{\scal}{\cal S}\) \(\newcommand{\wcal}{\cal W}\) \(\newcommand{\ecal}{\cal E}\) \(\newcommand{\coords}[2]{\left\{#1\right\}_{#2}}\) \(\newcommand{\gray}[1]{\color{gray}{#1}}\) \(\newcommand{\lgray}[1]{\color{lightgray}{#1}}\) \(\newcommand{\rank}{\operatorname{rank}}\) \(\newcommand{\row}{\text{Row}}\) \(\newcommand{\col}{\text{Col}}\) \(\renewcommand{\row}{\text{Row}}\) \(\newcommand{\nul}{\text{Nul}}\) \(\newcommand{\var}{\text{Var}}\) \(\newcommand{\corr}{\text{corr}}\) \(\newcommand{\len}[1]{\left|#1\right|}\) \(\newcommand{\bbar}{\overline{\bvec}}\) \(\newcommand{\bhat}{\widehat{\bvec}}\) \(\newcommand{\bperp}{\bvec^\perp}\) \(\newcommand{\xhat}{\widehat{\xvec}}\) \(\newcommand{\vhat}{\widehat{\vvec}}\) \(\newcommand{\uhat}{\widehat{\uvec}}\) \(\newcommand{\what}{\widehat{\wvec}}\) \(\newcommand{\Sighat}{\widehat{\Sigma}}\) \(\newcommand{\lt}{<}\) \(\newcommand{\gt}{>}\) \(\newcommand{\amp}{&}\) \(\definecolor{fillinmathshade}{gray}{0.9}\)Impacts of Urban Sprawl
Urban sprawl is the extension of low-density residential, commercial, and industrial development into areas beyond a city's boundaries that occurs in an unplanned or uncoordinated manner. It is generally characterized by:
- low-density development that is dispersed and situated on large lots (greater than one acre)
- geographic separation of essential places such as work, home, school, and shopping
- high dependence on automobiles for travel
- increased impervious surface area in watersheds
- habitat fragmentation and degradation
Urban sprawl combines low density (Figure \(\PageIndex{1}\)) and fragmentation of the urban area (Figure \(\PageIndex{2}\)), increases the average travel distances for daily trips, and hinders a shift toward less energy-intensive transportation modes. The sprawling nature of cities is critically important because of the major impacts that are evident in increased energy, land and soil consumption. These impacts threaten both the natural and rural environments, raising greenhouse gas emissions that cause climate change, and elevated air and noise pollution levels which often exceed the agreed human safety limits. Thus, urban sprawl produces many adverse impacts that have direct effects on the quality of life.
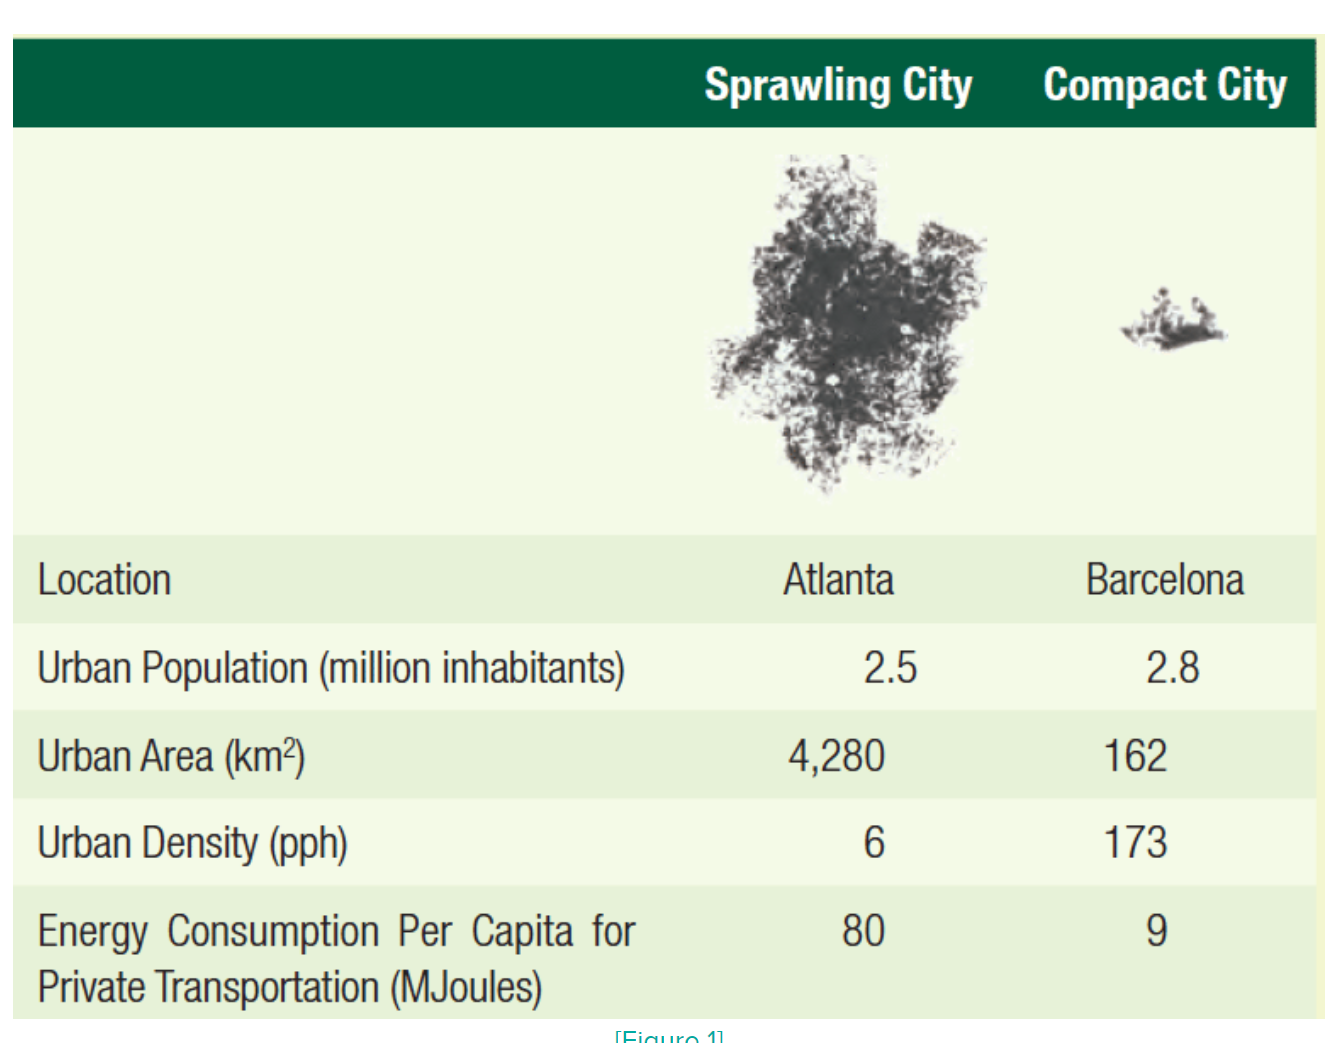
Figure \(\PageIndex{1}\): Sprawl vs. Compact Cities. An often cited example of urban sprawl is Atlanta, GA (US), which has a similar population as Barcelona but occupies an urban area that is 26 times as large
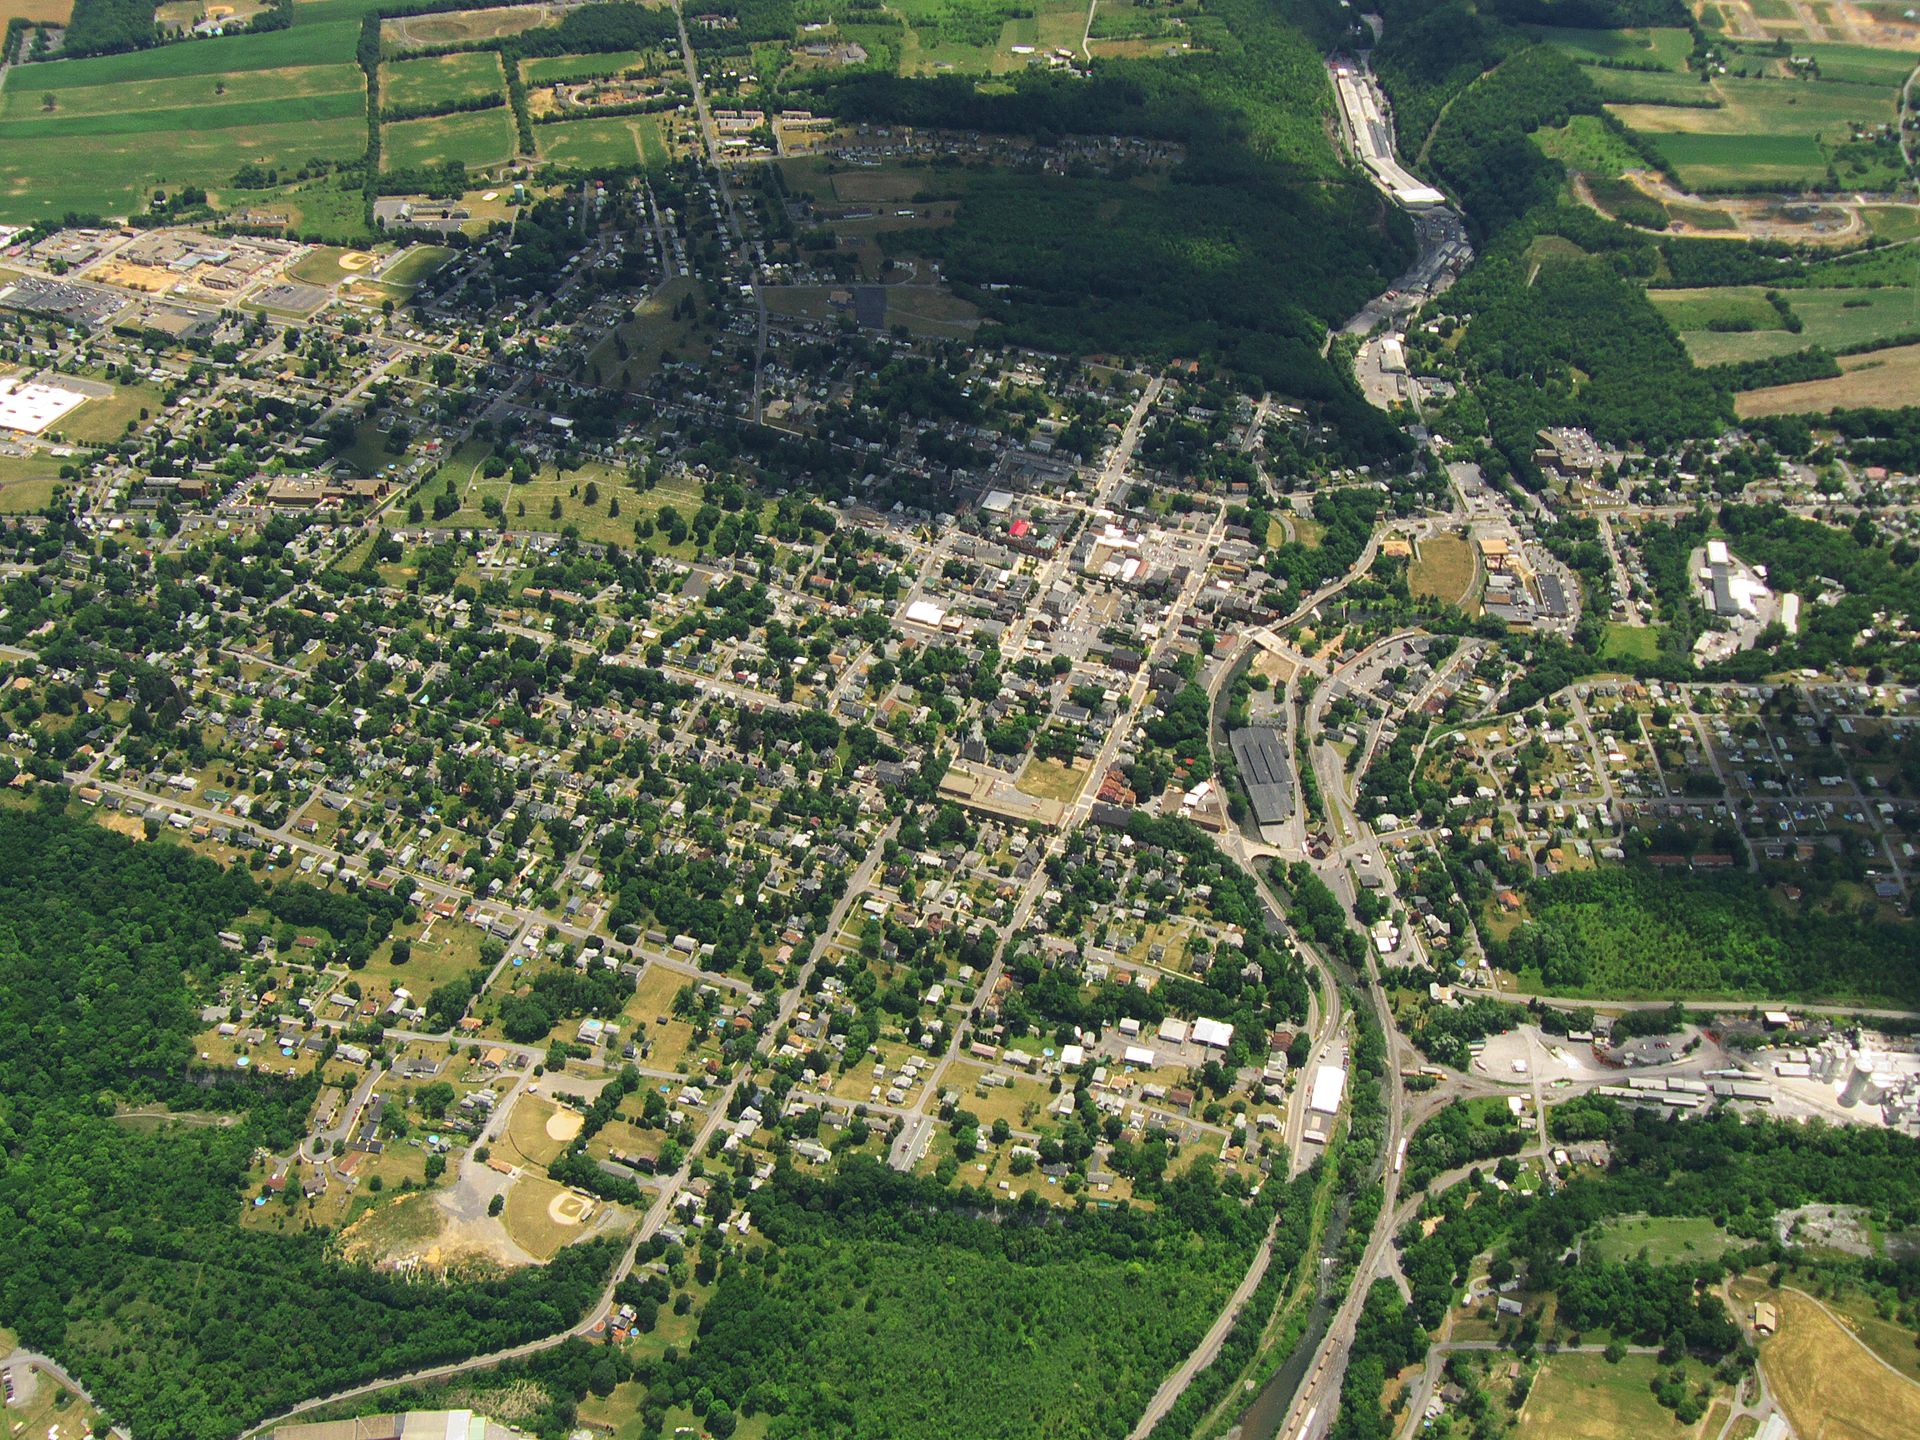
Figure \(\PageIndex{2}\): Sprawling area. An aerial photo of Bellefonte, Pennsylvania, USA. Looking southeast taken from a glider on July 1, 2007 by Dhaluza at English Wikipedia
Health
If communities are not walkable or bikeable, we need to drive to schools, shops, parks, entertainment, play dates, etc. Thus we become more sedentary. Residents of sprawling counties were likely to walk less during leisure time and weigh more than residents of compact counties. A sedentary lifestyle increases the risk of overall mortality, cardiovascular disease, and some types of cancer. The effect of low physical fitness is comparable to that of hypertension, high cholesterol and diabetes.
Transportation and Consumption of Energy
A consequence of the increasing consumption of land and reductions in population densities as cities sprawl is the growing consumption of energy. Generally, compact urban developments with higher population densities are more energy efficient. Evidence from 17 cities around the world shows a consistent link between population density and energy consumption (Figure \(\PageIndex{3}\)), and in particular high energy consumption rates that are associated with lower population densities, characteristic of sprawling environments, dependent on lengthy distribution systems that undermine efficient energy use.
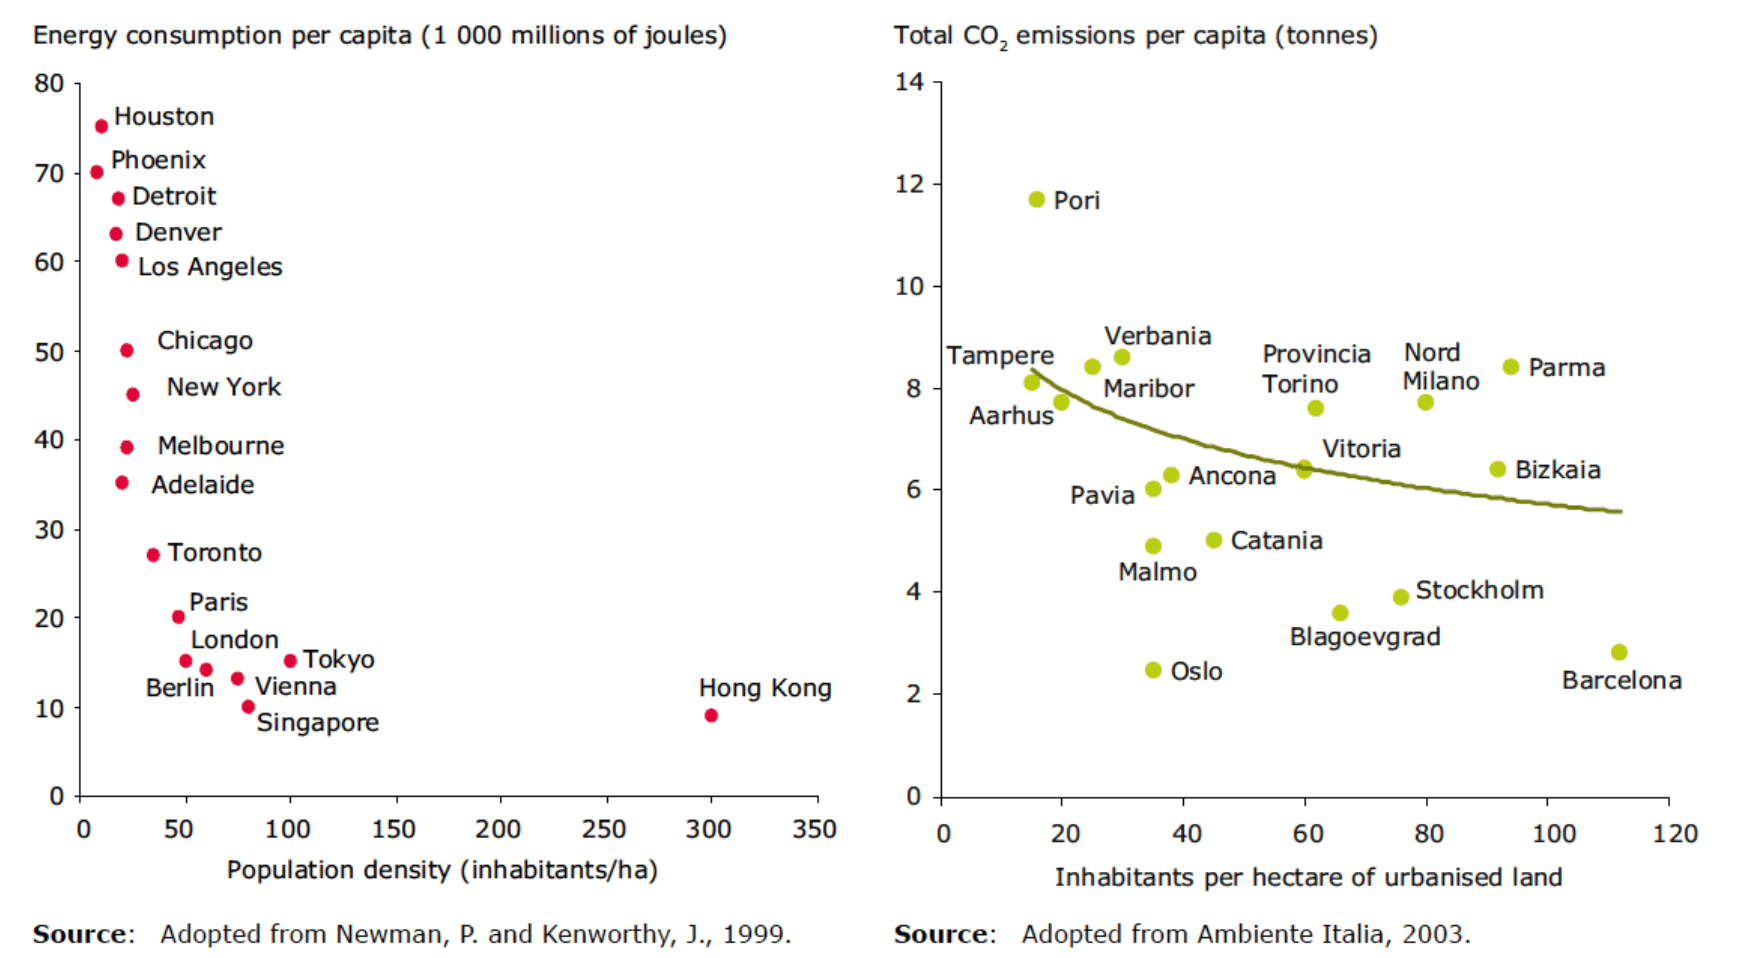
Figure \(\PageIndex{3}\): Left: Population density and energy consumption, selected World cities. Right: Population density and CO2 emissions, selected European cities.
Transport related energy consumption in cities depends on a variety of factors including the nature of the rail and road networks, the extent of the development of mass transportation systems, and the modal split between public and private transport. From the turn of the twentieth century to the 1950s, public transit systems were the most commonly used means of longer-distance personal transportation in North American cities. Public transit is still an important means of transportation in cities, although its growth is moderate and not nearly as impressive as that of automobile use. Evidence shows that there is a significant increase in travel related energy consumption in cities as densities fall. Essentially, the sprawling city is dominated by relatively energy inefficient car use, as the car is frequently the only practical alternative to more energy efficient, but typically inadequate, relatively and increasingly expensive public transportation systems. Increased transport related energy consumption is in turn leading to an increase in the emission of CO2 to the atmosphere. Urban sprawl therefore poses significant threats to the commitments to reduce GHG gas emissions.
Although owning a car or truck is widely viewed as a desirable aspect of our lifestyle, the reliance on personal motor vehicles seriously affects environmental quality in cities and towns. Compared with other means of urban transportation, personal motor vehicles emit more air pollution, require more physical infrastructure (such as roads and parking space), use more material and energy resources, and are more costly to own and operate.
Air pollution
Using fossil fuels also results in the emission of other gases and particulates that degrade air quality (note that commuters generate emissions of air pollution, which lowers the ambient quality of the air in areas they pass through and causes health problems for other people). Longer transportation distances intensify traffic congestion, resulting in lost productivity, and increase the need for more extensive infrastructure (such as more highways) that negatively impact the environment by increasing the amount of impervious cover and by requiring more natural resources. Finally, traffic congestion and air pollution from driving contribute to an estimated 900,000 fatalities per year worldwide.
Urban air pollution can cause life-threatening health problems for many people, particularly the old or very young and those with respiratory diseases. Severe pollution by sulphur dioxide and particulates was once common in North American and European cities, when coal was burned as an industrial and residential fuel. This problem has, however, been greatly alleviated since the early 1960s because of clean-air regulations. However, this kind of reducing smog is still severe and even worsening in many rapidly developing countries, where a lower priority is given to enforcing clean-air laws. Cities in developed countries continue to be affected by significant levels of air pollution. The following are particularly important.
- SO2 and NOx gases: Although so-called reducing smog is much less of a problem than before, urban atmospheres still have higher concentrations of SO2 and NOx than rural areas. The dry deposition of these gases damages marble, limestone, sandstone, and other acid-sensitive building materials and statues, and it contributes to the acidification of aquatic habitats (Chapter 19). In addition, these gases may be directly toxic to sensitive urban plants and lichens.
- Suspended particulates: Largely originating from emissions from vehicles, furnaces, and other combustion sources, suspended particulates are mostly fine aerosols of ammonium sulphate, ammonium nitrate, and sooty organics. At high concentrations they form a haze that interferes with visibility and is a hazard to people with respiratory problems. In general, air pollution by particulates has decreased markedly during the past several decades, mainly because of better emission controls on power plants, other industrial sources, and vehicles, and because of widespread switching to natural gas as a fuel.
- Oxidants: Cities with a sunny climate and a large number of motor vehicles often develop a photochemical smog during the day, characterized by high concentrations of ozone, peroxy acetyl nitrate (PAN), NOx, and volatile organic compounds (Chapter 16). The ozone component is responsible for most of the oxidant damage because it is toxic to many plants, irritates people’s eyes and respiratory tracts, and degrades many materials and pigments. The worst photochemical smog occurs in southern Ontario and Quebec, extending from Windsor to Quebec City, and to a lesser degree in the greater Vancouver area and around Saint John. The air-quality objective for ozone (63 ppb) is exceeded on many summer days in the Quebec-Windsor corridor, where maximum hourly concentrations can exceed 160 ppb. Niagara Falls, Sarnia, Windsor, and Guelph are among the smoggiest cities in Canada, exceeding ozone guidelines for more than 50 days per year. The photochemical smog in this region occurs because of local emissions of NOx and volatile organics (these are precursors in the photochemical production of ozone; see Chapter 16), as well as those blowing in from urban areas in the nearby United States. In contrast, local emissions are the major cause of ozone smog in the Vancouver area.
Natural and Protected areas
The impacts of sprawl on natural areas are significant. The considerable impact of urban sprawl on natural and protected areas is exacerbated by the increased proximity and accessibility of urban activities to natural areas, imposing stress on ecosystems and species through noise and air pollution. Immediate impacts such as the loss of natural land or the fragmentation of forests, wetlands and other habitats are well known direct and irreversible impacts. Urban land fragmentation, with the disruption of migration corridors for wildlife species, isolates these populations and can reduce natural habitats to such an extent that the minimum area required for the viability of species populations is no longer maintained.
The environmental impacts of sprawl are evident in a number of ecologically sensitive areas located in coastal zones and mountain areas. The Mediterranean coast, one of the world's 34 biodiversity hotspots, is particularly affected, and the increased demand for water for urban use, competes with irrigation water for agricultural land. This problem has been exacerbated by the increased development of golf courses in Spain, where the over-extraction of groundwater has led to salt water intrusion into the groundwater. Increased transit and tourist traffic, particularly day tourism from the big cities, also adds to the exploitation of the mountain areas as a natural resource for 'urban consumption' by the lowland populations.
In another example, the area around Victoria is the only place in Canada where dry forest dominated by Garry oak (Quercus garryana) occurs. This is habitat to many rare species and is one of our most endangered natural ecosystems. The expansion of residential areas is the greatest risk to this coastal oak forest. Conservation agencies in government and the private sector, including the Nature Conservancy of Canada, are trying to protect the surviving patches of this rare forest.
Agricultural Land Area
The growth of European cities in recent years has primarily occurred on former agricultural land. Typically, urban development and agriculture are competing for the same land, as agricultural lands adjacent to existing urban areas are also ideal for urban expansion. The loss of agricultural land has major impacts on biodiversity with the loss of valuable habitat for many animals, and particularly birds. Sprawling cities also threaten to consume the best agricultural lands, displacing agricultural activity to both less productive areas (requiring higher inputs of water and fertilisers) and more remote upland locations (with increased risk of soil erosion).
Soil
Urban sprawl and the development of urban land dramatically transform the properties of soil, reducing its capacity to perform its essential functions. These impacts are evident in the extent of compaction of soil leading to impairment of soil functions; loss of water permeability (soil sealing) which dramatically decreases; loss of soil biodiversity, and reductions of the capacity for the soil to act as a carbon sink. In Germany, for example, it is estimated that 52 % of the soil in built-up areas is sealed (or the equivalent of 15 m2 per second over a decade). In addition, rainwater which falls on sealed areas is heavily polluted by tire abrasion, dust and high concentrations of heavy metals, which when washed into rivers degrade the hydrological system.
Urban soil can become polluted by metals in many ways. For example, people who live near metal-recycling factories may be exposed to pollution through dustfall from the atmosphere. In one case, severe pollution was found in a downtown Toronto residential neighborhood near a car-battery recycling factory. Lead in surface soil near the factory exceeded several thousand ppm (one sample had >5% lead), and some residents had elevated lead in their blood and hair. This astonishing land-use conflict occurred because of earlier, inappropriate land-use zoning, when less attention was placed on environmental concerns. However, the battery-recycling factory still remains in the residential neighborhood, although it operates much more cleanly than in the past. Lead pollution of urban soil has also been caused by residues of old paint, which often had very high concentrations of lead-containing pigments (commonly reaching 38% in the dried residue), especially in white and red colours. (Lead is now mostly replaced in household paints by titanium and other less-toxic metals). Soil close to busy highways is also affected by leaded gasoline (this problem has dissipated some since the ban on leaded gasoline).
Water Quality
Increasing numbers of roads and parking lots are needed to support an automobile transportation system, which lead to increased non-point source water pollution and contamination of water supplies (road runoff of oil/gas, metals, nutrients, organic waste, to name a few) with possible impacts on human health. Increased erosion and stream siltation causes environmental damage and may affect water treatment plants and thus affect water quality.
Eutrophication is another kind of urban pollution. Lakes and rivers in urban areas often have an enriched nutrient supply, which results in increased productivity and eutrophication. The nutrient inputs originate from fertilizer use in horticulture, leaching from septic fields, and sometimes the dumping of sewage. Urban waterbodies are also commonly polluted with coliform bacteria and other intestinal pathogens and parasites that originate with sewage and surface runoff contaminated by pet and bird feces. Lakes and rivers may also be affected by spilled fuel, metals, garbage dumping, and sedimentation by soil eroded during construction activities. Any of these influences on urban lakes may render them less suitable or even unfit as a source of drinking water or for recreational purposes. Eutrophication and sedimentation also cause significant ecological damage in many urban waterbodies.
Urban sprawl can also be a threat to the ability of landscapes to provide key environmental “services,” such as clean water. One such case involves an area known as the Oak Ridges Moraine, which has become a rallying point for habitat protection against further urbanization in the Greater Toronto Area. The moraine is a 160-km-long, 1950-km2 ridge located north of the city, and it is composed of hilly terrain underlain by glacial sand and gravel. Because of its rough topography and poor fertility, much of its area has remained forested or is used for pasture or other low-intensity agricultural purposes. Groundwater originating in the moraine is a source of well-water recharge for about 250-thousand people and is a source of 65 rivers and streams and many wetlands. However, with the rapid growth of the greater Toronto region, the moraine has been subjected to increasing pressure from residential and commercial development. Extensive clearing of its forested and pasture areas would degrade the ability of the moraine to provide clean groundwater for use by people and to support streams and wetlands. Loss of the remaining forest would also destroy habitat for native species that are rare in the region. In response to intense lobbying from groups seeking to limit new developments on the moraine, the Government of Ontario formed an advisory panel to provide advice about the regulation of land-use. The panel provided many recommendations, including the need to protect 92% of the moraine from intensive development, and these were key in the preparation of The Oak Ridges Moraine Conservation Act, 2001. The Act was used to prepare a land-use plan, including provisions for core natural areas and linkages among them, comprising about 62% of the moraine. In 2002, the premier of Ontario announced the formation of a non-profit Oak Ridges Moraine Foundation and provided it with $15 million to fund public education, monitor the moraine, develop trails, and secure natural habitats. The federal government also announced that land it owns on the moraine, about 30 km2, would be kept as greenspace. In addition, the Nature Conservancy of Canada has been acquiring properties of high conservation value and is setting them aside as protected areas.
Noise Pollution
Urban areas are typically much noisier than rural ones. Most of the noise comes from the operation of various kinds of machines that are abundant in urban places, such as air conditioners, lawnmowers, automobiles, heavy trucks, and air compressors. Loud music may also be important. Noise pollution begins when the level of ambient sound becomes distracting to the normal activities of people, for example, by making it difficult to understand a conversation or to have a restful sleep.
Noise intensity (also called sound pressure or loudness) is measured in units of decibels (dB). An increase of 10 dB is approximately equivalent to a doubling of the loudness. When the distance from a point source is doubled, the noise level decreases by about 6 dB. However, when the distance from a linear source of noise (such as a busy highway) is doubled, the sound level decreases by only about 3 dB.
At a high intensity, noise pollution can cause a progressive and enduring hearing impairment, which begins with a decreased ability to perceive higher-pitched sound. Under prolonged exposure, the hearing loss may progress through much of the auditory range. Hearing loss is caused by both the duration and intensity of exposure. For example, an occupational exposure to 115 dB may be permitted for no longer than 15 minutes, while exposure to 100 dB may be allowed for two hours and 90 dB for up to eight hours. Noise becomes painful at about 140 dB, although prolonged exposure to levels above 80-90 dB can result in long-term hearing loss. The noise levels typically associated with various sources are shown in Figure 25.7.
People may be exposed to excessive noise in various ways. Non-voluntary exposures occur in the ambient environment, such as near a road with heavy traffic. Occupational exposures occur in noisy factories or in hangars where jet engines are serviced. Voluntary exposures to excessive noise are also common, such as when people attend thunderous rock concerts or use headphones to listen to loud music. It is well known that permanent hearing loss is common among rock musicians as well as people who regularly listen to loud music at concerts, clubs, or using headphones. Frequent target-shooting with firearms can also result in long-term hearing loss unless effective ear protection is used.
Urban Biodiversity
Some non-native animals and plants have found good habitat in urban areas, where they have wild, self-maintaining populations and can out-compete native species. Urban habitats tend to be dominated by alien species of plants, which were introduced in various ways including:
- as seeds contained in soil carried by ships as ballast, which was dumped in a port when the cargo was discharged (this was particularly important before the twentieth century)
- as seeds that contaminated the seedstock of crop plants (this is now less of a problem because weed seeds are “cleaned” from commercial seedstock)
- or as plants used in agriculture, forestry, or horticulture.
Some animals, such as the house mouse (Mus musculus) and Norway rat (Rattus norvegicus), were introduced accidentally when they escaped from infested ships and cargoes. Others were deliberately introduced. For example, the rock dove (pigeon; Columba livea), starling (Sturnus vulgaris), and house sparrow (Passer domesticus) were introduced by a nineteenth-century society of gentlemen who were dedicated to bringing all of the birds mentioned in the plays of William Shakespeare to North America. Of course, the domestic dog (Canis familiaris), domestic cat (Felis catus), and other pets are also common non-natives in our cities and towns.
Some other examples of these invasive plants and animals and the ecological problems that are associated with them include the following:
- The dandelion (Taraxacum officinale) is a perennial, herbaceous plant that was originally native to alpine habitat in Europe, but now occurs in temperate regions throughout the world, probably having been introduced in marine ballast. The dandelion is considered an important weed of lawns and pastures.
- Japanese knotweed (Polygonum cuspidatum) is a perennial, herbaceous plant that grows up to 2-m tall and is native to Japan. It has attractive foliage and was widely introduced for horticultural use. It can be invasive in disturbed areas.
- The sticky touch-me-not (Impatiens glandulifera) is an annual wildflower native to the Himalayas. It was introduced through horticulture and can be invasive in gardens and wetlands.
- Purple loosestrife (Lythrum salicaria) is a perennial, herbaceous plant of Eurasia that was introduced through ships’ ballast and horticulture and is a serious invader of wetlands.
- St. John’s wort (Hypericum perforatum) is a perennial, herbaceous plant of Europe that was introduced probably through marine ballast and is now a serious weed of pastures that causes a photosensitivity disease in cattle.
- Norway maple (Acer platanoides) is a native tree of Europe that was introduced for horticultural use. It invades natural hardwood forest.
- The oriental cockroach (Blatta orientalis) is an insect native to eastern Asia. It was probably introduced accidentally with ship cargo and is a serious pest in homes and other places where food is stored.
Many urban habitats are highly disturbed and are managed to keep them in an early stage of succession (Figure \(\PageIndex{4}\)). Urban lawns, for example, are mown frequently to prevent their vegetation from developing beyond a stage that is dominated by low-growing, herbaceous plants. Moreover, because most lawn-growers want a monoculture of only one or two species of grasses, they may apply herbicide to kill unwanted dicotyledonous plants, such as clovers, dandelion, and other “weeds.” The most commonly grown grass in lawns in temperate-zone countries is the Kentucky blue grass (Poa pratensis), which, despite its common name, is actually a Eurasian species. Other aspects of the intensive management of lawns include the use of fertilizer, insecticide, and irrigation. Some ecologists recommend less-intensive systems of lawn management, including tolerance of such non-grass plants as red clover (Trifolium pratense), black medic (Medicago lupulina), and other legumes, which fix atmospheric nitrogen and so reduce the need for fertilizer.
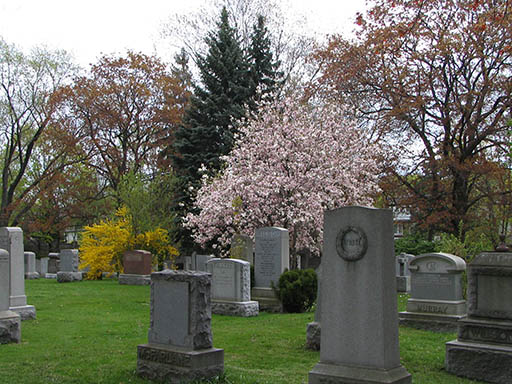
Figure \(\PageIndex{4}\): Urban biodiversity can be pleasant, but it is often managed in a highly contrived manner and is dominated by alien plants and animals. Almost none of the species in this cemetery in Toronto are native to Canada. Source: B. Freedman.
Urban Climate
The climate of urban regions is different from that of nearby rural areas. Compared with rural areas, cities typically exhibit the following characteristics:
- they are warmer by 3-6°C
- have 5-10% more cloud cover
- receive about 20% less solar radiation
- have 20-30% lower wind speeds (although wind-tunnelling may increase windspeeds near large buildings)
- have 5-15% lower relative humidity
- receive 5-15% more precipitation The best known of the climatic differences, called the “heat-island” effect, refers to the warmer temperature of cities, which occurs because of the following influences on the urban energy budget:
- an emission of large amounts of heat (thermal energy) from buildings and machines (including motor vehicles)
- interference by buildings with the dispersal of warmed air by wind
- the absorption of solar radiation by dark surfaces (especially asphaltic roads and parking lots ), followed by the re-radiation of long-wave infrared
- a relative lack of plant foliage in urban areas (the atmosphere is cooled by the evaporation of water from foliage, also known as transpiration)
Socio-economic Impacts
From a social perspective urban sprawl generates greater segregation of residential development according to income. Consequently, it can exacerbate urban social and economic divisions. The socio‑economic character of suburban and peripheral areas is typified by middle and upper income families with children, who have the necessary mobility and lifestyle to enable them to function effectively in these localities. However, the suburban experience for other groups, including the young and old, who lack mobility and resources can be very different and can reduce social interaction. Furthermore, large segments of urban society are excluded from living in such areas.
From an economic perspective urban sprawl is at the very least a more costly form of urban development due to:
- increased household spending on commuting from home to work over longer and longer distances;
- the cost to business of the congestion in sprawled urban areas with inefficient transportation systems;
- the additional costs of the extension of urban infrastructures including utilities and related services, across the urban region.
Urban sprawl inhibits the development of public transport and solutions based on the development of mass transportation systems, and the provision of alternative choices in transportation that are essential to ensure the efficient working of urban environments. These conclusions are reinforced by experience from both Munich and Stockholm where the efficient control of urban sprawl and resulting increase in population densities fosters the use of public transport and reduces the growth of car use.
Social Capital
On the social sustainability side, we can look at social capital otherwise defined as the “connectedness” of a group built through behaviors such as social networking and civic engagement, along with attitudes such as trust and reciprocity. Greater social capital has been associated with healthier behaviors, better self-rated health, and less negative results such as heart disease. However, social capital has been diminishing over time. Proposed causes include long commute times, observed in sprawling metropolitan areas. As of 2011, according to an article in the Chicago Tribune, Chicago commuting times are some of the worst – with Chicagoans spending 70 hours per year more on the road than they would if there was no congestion – up from 18 hours in 1982. They have an average commute time of 34 minutes each way. These drivers also use 52 more gallons per year per commuter.
Urban Environmental Problems of the Developing World
Global urbanization reached the 50 percent mark in 2008, meaning that more than half of the global population was living in cities compared to only 30 percent 50 years ago. The access to basic services— clean water, sanitation, electricity, and roads—are some of the main urbanization challenges facing the developing world.
Municipal waste management is a crucial service provided by cities around the world, but is often inefficient and underperforming in developing countries. Low income countries face the most acute challenges with solid waste management. In low income countries, cities collect less than half the waste stream. Of this, only about half is processed to minimum acceptable standards. Improper waste management, especially open dumping and open burning, has significant adverse effects on water bodies, air and land resources. People who live near or work with solid waste have increased disease burdens. Unmanaged waste also frequently blocks drainage systems and worsens flooding. Even when collected and transported, waste in dumpsites and landfills contributes to greenhouse gas emissions.
Roughly 2.6 billion people in the developing world are without adequate sanitation, and facilities are often overloaded, in disrepair, or unused. Even though the sanitation gap is twice as large as that of water supply, investments in sanitation and hygiene have lagged far behind those in water and other “social” sectors, such as health and education. The main costs of urban sanitation services are those of sewers and sewage treatment. Whereas sewers contribute to public health through reducing everyday contact with sewage (especially by children), wastewater treatment is designed largely to meet ecological objectives and not those of public health. Urban utilities, by and large, are not well designed or staffed to address off-network solutions for water supply or sanitation, yet those solutions are likely to be the most important first steps of progress in environmental health for many of the urban poor.
Experience suggests that demand for car ownership increases dramatically at annual household incomes of $6,000–$8,000. If history repeats itself, an additional 2.3 billion cars will be added by 2050, mostly in developing countries, given expected economic growth and past patterns of motorization. For instance, in the six largest cities in India, the population doubled between 1981 and 2001, but the number of motor vehicles increased eight times over the same period. Between 2000 and 2013, car ownership in China increased more than six times. Similar trends are seen in other fast growing economies. Increased income levels and the availability of cheaper personal vehicles, coupled with increased travel distances and inadequate public transport systems, have made the personal motorcar an increasingly attractive travel option. The associated health costs are high—in Beijing, the health costs from local air pollution are estimated at $3.5 billion annually. In Pakistan, more than 22,600 adult deaths were attributable to urban ambient air pollution in 2005 where air pollution alone causes more than 80,000 hospital admissions per year, nearly 8,000 cases of chronic bronchitis, and almost 5 million cases of lower respiratory cases among children under five.
References Cited and Further Reading
American Public Transportation Association (APTA). 2014. Public Transportation Fact Book, Appendix A: Historical Tables. APTA, Washington, DC.
Berkowitz, A.R., C.H. Nilon, and K.S. Hollweg. 2002. Understanding Urban Ecosystems. Springer Verlag, Berlin, Germany.
Breuste, J., H. Feldmann, and O. Ohlmann (eds.). 1998. Urban Ecology. Springer Verlag, Berlin, Germany.
Brinkhoff, T. 2015. Major Agglomerations of the World. http://www.citypopulation.de/world/Agglomerations.html
Environment Canada. 1996. The State of Canada’s Environment. Government of Canada, Ottawa, ON.
Environment Canada. 1999. Air Quality Trends in Canadian Cities, 1979–1992. Ottawa, ON: State of the Environment Reporting, Environment Canada. https://web.archive.org/web/20010214040646/http://www.ec.gc.ca/pdb/uaqt/aqfact_e.html
Environment Canada. 2007. Municipal population served by wastewater treatment. State of Environment Infobase Ottawa, ON. https://web.archive.org/web/20040621114650/http://www.ec.gc.ca:80/soer-ree/English/Indicators/Issues/Urb_H2O/Bulletin/uwind3_e.cfm
Environment Canada. 2014. Air Quality Indicators. Environment Canada, Ottawa, ON. http://www.ec.gc.ca/indicateurs-indicators/default.asp?lang=en&n=7DCC2250-1
Ewing, B., D. Moore, A. Ourser, A. Reed, and M. Wackernagel. 2010. Ecological Footprint Atlas 2010. Global Footprint Network, Oakland, CA. https://www.footprintnetwork.org/content/images/uploads/Ecological_Footprint_Atlas_2010.pdf
Federation of Canadian Municipalities (FCM). 2009. Waste Diversion Success Stories from Canadian Municipalities. FCM, Ottawa, ON. http://www.fcm.ca/Documents/tools/GMF/Getting_to_50_percent_en.pdf
Fincher, R. and J.M. Jacobs (eds.). 1998. Cities of Difference. Guilford Press, New York, NY.
Freedman, B., S. Love, and B. O’Neil. 1996. Tree species, biomass, and carbon storage in stands of urban forest of varying character in Halifax, Nova Scotia, Canada. Canadian Field-Naturalist, 110: 675–682.
Gill, D. and P. Bonnett. 1973. Nature in the Urban Landscape: A Study of City Ecosystems. York Press, Baltimore, MD.
Global Footprint Network. 2007. Canadian Living Planet Report. World Wildlife Fund Canada, Toronto, ON, and the Global Footprint Network, Oakland, CA. https://web.archive.org/web/20180618150932/https://www.footprintnetwork.org/content/documents/2007_Canadian_Living_Planet_Report.pdf
Holcomb, M.C. 1987. Transportation Energy Data Book, 9th ed. Oak Ridge National Laboratory, Oak Ridge, TN.
Jacobs, J. 1961. The Death and Life of Great American Cities. Random House, New York, NY.
Jacobs, J. 1969. The Economy of Cities. Random House, New York, NY.
Kreith, F. (ed.). 1994. Handbook of Solid Waste Management. McGraw-Hill, New York, NY.
Kryter, K.D. 1985. The Effects of Noise. 2nd ed. Academic Press, Orlando, FL.
Landsberg, H.E. 1981. The Urban Climate. Academic Press, New York, NY.
Langford, T.E.L. 1990. Ecological Effects of Thermal Discharges. Elsevier Science, Amsterdam, The Netherlands.
Lowe, M.D. 1989. The Bicycle: Vehicle for a Small Planet. Worldwatch Institute, Washington, DC. Nathanson, J.A. 2002. Basic Environmental Technology: Water Supply, Waste Management, and Pollution Control. 3rd ed. Prentice Hall, Upper Saddle River, NJ.
National Round Table on the Environment and the Economy (NRTEE). 1998. Greenhouse Gas Emissions from Urban Transportation: Backgrounder. NRTEE, Ottawa, ON.
Platt, R.H., R.A. Rowntree, and P.C. Muick. 1994. The Ecological City: Preserving and Restoring Urban Biodiversity. University of Massachusetts Press Amherst, MA.
Ponting, C. 1991. A Green History of the World. Sinclair-Stevenson London, UK.
Rees, W.E. 1992. Ecological footprints and appropriated carrying capacity: What urban economics leaves out. Environment and Urbanization, 4: 121–130.
Rees, W.E. 1997. Is “sustainable city” an oxymoron? Local Environment, 2: 303–310.
Rees, W.E. 2010. The Human Nature of Unsustainability. The Post Carbon Institute, Santa Rosa, CA.
Savard, J.-P. 1978. Birds in Metropolitan Toronto: Distribution, Relationships with Habitat Features, and Nesting Sites. Unpublished M.Sc. Thesis, University of Toronto.
Statistics Canada. 2006. Human Activity and the Environment. Annual Statistics 2006. www.statcan.ca/english/freepub/16-201-XIE/16-201-XIE2006000.pdf
Statistics Canada. 2006. Road motor vehicle, trailer and snowmobile registration, annual (registrations). Table 405-0001, Statistics Canada, Ottawa, ON. http://www5.statcan.gc.ca/cansim/a26?lang=eng&retrLang=eng&id=4050001&pattern=automobiles&tabMode=dataTable&srchLan=-1&p1=1&p2=50
Statistics Canada. 2012. Human Activity and the Environment, Waste Management in Canada. Statistics Canada, Ottawa, ON. http://www5.statcan.gc.ca/olc-cel/olc.action?ObjId=16-201-X&ObjType=2&lang=en&limit=0
Statistics Canada. 2017. Road motor vehicle registrations, by type of vehicle. Table 23-10-0067-01 (formerly CANSIM 405-0004), Statistics Canada, Ottawa, ON. https://www150.statcan.gc.ca/t1/tbl1/en/tv.action?pid=2310006701
Statistics Canada. 2014b. Leading causes of death, by sex. CANSIM Table 102-0561, Statistics Canada, Ottawa, ON. http://www.statcan.gc.ca/tables-tableaux/sum-som/l01/cst01/hlth36a-eng.htm Accessed November, 2014.
Timerson, B.J. 1999. A Guide to Noise Control in Minnesota. Minnesota Pollution Control Agency. Minneapolis, MN.
Transport Canada. 2012. Canadian Motor Vehicle Traffic Collision Statistics, 2004. Transport Canada, Ottawa, ON. http://www.tc.gc.ca/eng/roadsafety/tp-tp3322-2004-menu-691.htm
Transport Canada. 2017. Annual Reports: Transportation in Canada. Transport Canada Ottawa, ON. https://www.tc.gc.ca/eng/policy/anre-menu.htm
Turner, K., L. Lefler, and B. Freedman. 2004. Plant communities of selected urbanized areas of Halifax, Nova Scotia, Canada. Landscape and Urban Planning, 71: 191–206.
Wackernagel, M. and W.E. Rees. 1996. Our Ecological Footprint: Reducing Human Impact on the Earth. New Society, Gabriola Island, BC.
Attribution
Modified by Kyle Whittinghill from the following sources:
- Impacts of Urban Sprawl from Essentials of Environmental Science by Kamala Dorsner and CK-12 (CC-BY)
- Urbanization around the World from Essentials of Environmental Science by Kamala Dorsner and CK-12 (CC-BY)
- Chapter 12: Urban Ecology from Environmental Science: A Canadian Perspective by Bill Freedman (Creative Commons Attribution NonCommercial)