
S2024_Bis2A_Namekawa_Genomics
- Page ID
- 132381
\( \newcommand{\vecs}[1]{\overset { \scriptstyle \rightharpoonup} {\mathbf{#1}} } \)
\( \newcommand{\vecd}[1]{\overset{-\!-\!\rightharpoonup}{\vphantom{a}\smash {#1}}} \)
\( \newcommand{\id}{\mathrm{id}}\) \( \newcommand{\Span}{\mathrm{span}}\)
( \newcommand{\kernel}{\mathrm{null}\,}\) \( \newcommand{\range}{\mathrm{range}\,}\)
\( \newcommand{\RealPart}{\mathrm{Re}}\) \( \newcommand{\ImaginaryPart}{\mathrm{Im}}\)
\( \newcommand{\Argument}{\mathrm{Arg}}\) \( \newcommand{\norm}[1]{\| #1 \|}\)
\( \newcommand{\inner}[2]{\langle #1, #2 \rangle}\)
\( \newcommand{\Span}{\mathrm{span}}\)
\( \newcommand{\id}{\mathrm{id}}\)
\( \newcommand{\Span}{\mathrm{span}}\)
\( \newcommand{\kernel}{\mathrm{null}\,}\)
\( \newcommand{\range}{\mathrm{range}\,}\)
\( \newcommand{\RealPart}{\mathrm{Re}}\)
\( \newcommand{\ImaginaryPart}{\mathrm{Im}}\)
\( \newcommand{\Argument}{\mathrm{Arg}}\)
\( \newcommand{\norm}[1]{\| #1 \|}\)
\( \newcommand{\inner}[2]{\langle #1, #2 \rangle}\)
\( \newcommand{\Span}{\mathrm{span}}\) \( \newcommand{\AA}{\unicode[.8,0]{x212B}}\)
\( \newcommand{\vectorA}[1]{\vec{#1}} % arrow\)
\( \newcommand{\vectorAt}[1]{\vec{\text{#1}}} % arrow\)
\( \newcommand{\vectorB}[1]{\overset { \scriptstyle \rightharpoonup} {\mathbf{#1}} } \)
\( \newcommand{\vectorC}[1]{\textbf{#1}} \)
\( \newcommand{\vectorD}[1]{\overrightarrow{#1}} \)
\( \newcommand{\vectorDt}[1]{\overrightarrow{\text{#1}}} \)
\( \newcommand{\vectE}[1]{\overset{-\!-\!\rightharpoonup}{\vphantom{a}\smash{\mathbf {#1}}}} \)
\( \newcommand{\vecs}[1]{\overset { \scriptstyle \rightharpoonup} {\mathbf{#1}} } \)
\( \newcommand{\vecd}[1]{\overset{-\!-\!\rightharpoonup}{\vphantom{a}\smash {#1}}} \)
Genomes as organismal blueprints
A genome is an organism's complete collection of heritable information stored in DNA. Differences in information content help to explain the diversity of life we see all around us. Changes to the information encoded in the genome are the primary drivers of the phenotypic diversity we see (and some we can't) around us that are filtered by natural selection, and they are thus the drivers of evolution. This leads to questions. If every cell in a multicellular organism contains the same sequence of DNA, how can there be different cell types (e.g., how can a cell in a liver be so different from a cell in the brain if they both carry the same DNA)? How do we read the information? How do we interpret what we read? How do we understand how all the "parts" we identify in the genome functionally interrelate? How is all of this related to the expression of traits? How do changes in the genome lead to changes in traits?
Determining a genome sequence
The information encoded in genomes provides important data for understanding life, its functions, its diversity, and its evolution. Therefore, a reasonable place to begin studies in biology would be to read the information content encoded in the genome(s) in question. A good starting point is to determine the sequence of nucleotides (A, G, C, T) and their organization into one or more independently replicating units of DNA (e.g., think chromosomes and/or plasmids ). For 30+ years after the discovery that DNA is the hereditary material, this was a daunting proposition. In the late 1980s, however, the advent of semi-automated tools for DNA sequencing were pioneered, and this began a revolution that has dramatically changed how we approach the study of life. Twenty years later, in the mid-2000s, we entered a period of accelerated technological progress in which advances in materials sciences (particularly, advances in our ability to make things on a tiny scale), optics, electrical and computer engineering, bioengineering, and computer sciences have all converged to bring us dramatic increases in our capacity to sequence DNA and correspondingly dramatic decreases in the cost of sequencing DNA. A famous example to illustrate this point is to compare the changes in cost to sequence the human genome. The first draft of the human genome took nearly 15 years and $3 billion dollars to complete. Today, 10's of human genomes can be sequenced in a single day on a single instrument at a cost of less than $1000 each (the cost and time continue to decrease). Today, companies like Illumina, Pacific Biosciences, Oxford Nanopore, and others offer competing technologies that are driving down the cost and increasing the volume, quality, speed, and portability of DNA sequencing.
One of the very exciting elements of the DNA sequencing revolution is that it has required and continues to require contributions from biologists, chemists, materials scientists, electrical engineers, mechanical engineers, computer scientists and programmers, mathematicians and statisticians, product developers, and many other technical experts. The potential applications and implications of unlocking barriers to DNA sequencing have also engaged investors, business people, product developers, entrepreneurs, ethicists, policy makers, and many others to pursue new opportunities and to think about how to best and most responsibly use this growing technology.
The technological advances in genome sequencing have resulted in a virtual flood of complete genome sequences being determined and deposited into publicly available databases. You can find many of them at the National Center for Biotechnology Information. The number of available, completely sequenced genomes numbers in the tens of thousands—over 2,000 eukaryotic genomes, over 600 archaeal genomes, and nearly 12,000 bacterial genomes at the time of this writing. Tens of thousands of additional genome sequencing projects are in progress. With this many genome sequences available—or soon to be available—we can start asking many questions about what we see in these genomes. What patterns are common to all genomes? How many genes are encoded in genomes? How are these organized? How many types of features can we find? What do the features we find do? How different are the genomes from one another? Is there evidence that can tell us how genomes evolve? Let's briefly examine a few of these questions.
Diversity of genomes
Diversity of sizes, number of genes, and chromosomes
Let's start by examining the range of genome sizes. In the table below, we see a sampling of genomes from the database. We can see that the genomes of free-living organisms range tremendously in size. The smallest known genome is encoded by 580,000 base pairs while the largest is 150 billion base pairs—for reference, recall that the human genome is 3.2 billion base pairs. That's a huge range of sizes. Similar disparities in the number of genes also exist.
Table 1. This table shows some genome data for various organisms. 2n = diploid number. Attribution: Marc T. Facciotti (own work—reproduced from http://book.bionumbers.org/how-big-are-genomes/)
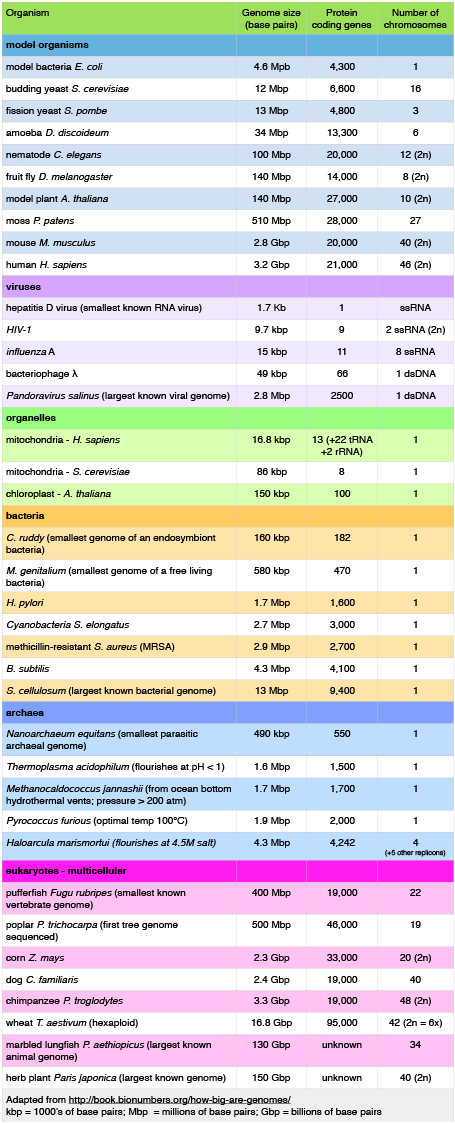
Examining Table 1 also reveals that some organisms carry with them more than one chromosome. Some genomes are also polyploid, meaning that they maintain multiple copies of similar but not identical (homologous) copies of each chromosome. A diploid organism carries in its genome two homologous copies (usually one from Mom and one from Dad) of each chromosome. Humans are diploid. Our somatic cells carry 2 homologous copies of 23 chromosomes. We received 23 copies of individual chromosomes from our mother and 23 copies from our father, for a total of 46. Some plants have a higher ploidy. For example, we term a plant with four homologous copies of each chromosome tetraploid. We term an organism with a single copy of each chromosome haploid.
Structure of genomes
Table 1 also provides clues to other points of interest. For instance, if we compare the pufferfish genome to the chimpanzee genome, we note that they encode roughly the same number of genes (19,000), but they do so on dramatically differently sized genomes—400 million base pairs versus 3.3 billion base pairs, respectively. That implies that the pufferfish genome must have much less space between its genes than what we might expect to find in the chimpanzee genome. This is the case, and the difference in gene density is not unique to these two genomes. If we look at Figure 1, which attempts to represent a 50-kb part of the human genome, we notice that besides the protein-coding regions (indicated in red and pink) that many other so-called "features" can be read from the genome. Many of these elements contain highly repetitive sequences.
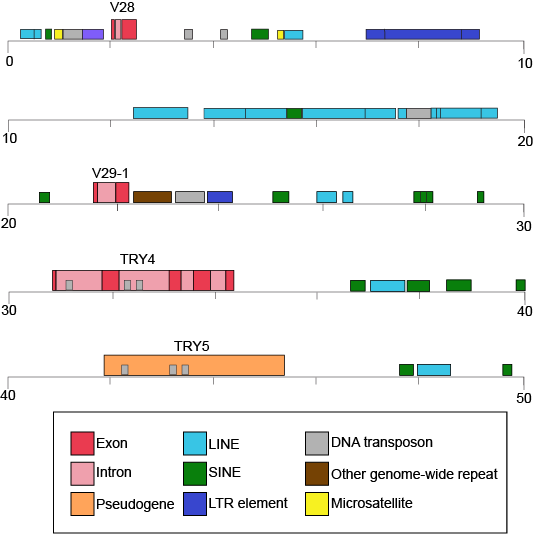
Figure 1. This figure shows a 50-kb segment of the human β T-cell receptor locus on chromosome 7. This figure depicts a small region of the human genome and the types of "features" that can be read and decoded in the genome, including, but also besides, protein-coding sequences. Red and pink correspond to regions that encode proteins. Other colors represent different types of genomic elements. Attribution: Marc T. Facciotti (own work—reproduced from www.ncbi.nlm.nih.gov/books/NBK21134/)
If we now look at what fraction of the whole human genome each of these types of elements makes up (see Figure 2), we see that protein-coding genes only make up 48 million of the 3.2 billion bases of the haploid genome.
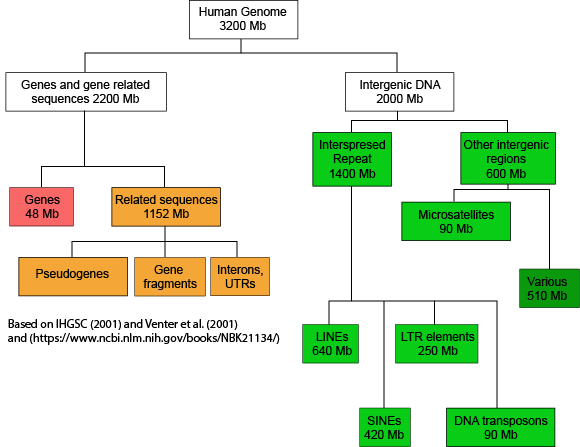
Figure 2. This graph depicts how the many base pairs of DNA in the human haploid genome are distributedbetween various identifiable features. Note that only a small fraction of the genome is associated directly with protein-coding regions. Attribution: Marc T. Facciotti (own work—reproduced from sources noted in figure)
When we examine the frequency of repeat regions versus protein-coding regions in different species, we note large differences in protein-coding versus non-coding regions.
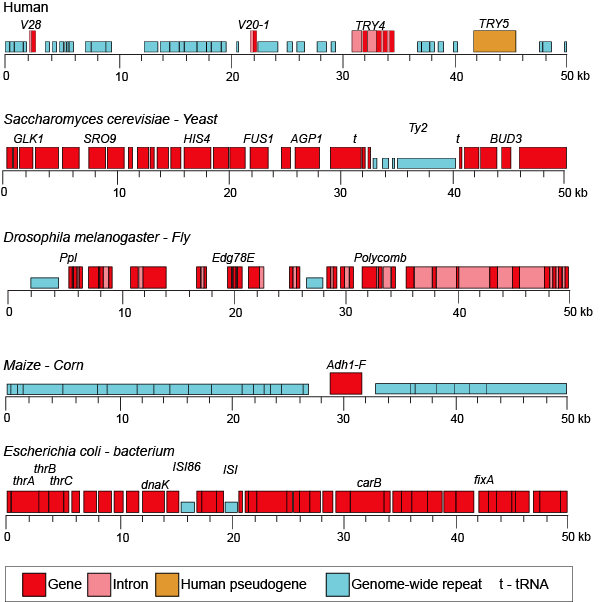
Figure 3. This figure shows 50-kb segments of different genomes, illustrating the highly variable frequency of repeat versus protein-coding elements in different species.
Attribution: Marc T. Facciotti (own work—reproduced from www.ncbi.nlm.nih.gov/books/NBK21134/)
Possible NB Discussion Point
Propose a hypothesis for why you think some genomes might have more or fewer noncoding sequences.
Dynamics of genome structure
Genomes change over time, and many events can change their sequence.
1. Mutations are accumulated during DNA replication or through environmental exposure to chemical mutagens or radiation. These changes typically occur at the level of single nucleotides.
2. Genome rearrangements describe a class of large-scale changes that can occur, and they include: (a) deletions—where segments of the chromosome are lost; (b) duplication—where regions of the chromosome are inadvertently duplicated; (c) insertions—the insertion of genetic material (note that sometimes this is acquired from viruses or the environment, and deletion/insertion pairs may happen across chromosomes); (d) inversions—where regions of the genome are flipped within the same chromosome; and (e) translocations—where segments of the chromosome are translocated (moved elsewhere in the chromosome).
These changes happen at different rates, and some are facilitated by the activity of enzyme catalysts (e.g., transposases).
Possible NB Discussion Point
How might mutations and genome rearrangements complicate studying/analyzing genomes? Conversely, can you think of interesting questions we can ask by comparing variation between genomes that occur because of events like mutation and genome rearrangements?
Genomics
The study of nucleic acids began with the discovery of DNA, progressed to the study of genes and small fragments, and has now exploded to the field of genomics. Genomics is the study of entire genomes, including the complete set of genes, their nucleotide sequence and organization, and their interactions both within a species and with other species. The advances in genomics have been made possible by DNA sequencing technology. Just as information technology has led to Google Maps, enabling us to get detailed information about locations around the globe, genomic information is used to create similar maps of the DNA of different organisms.
Whole genome sequencing
Although there have been significant advances in the medical sciences in recent years, doctors are still confounded by many diseases, and researchers are using whole genome sequencing to get to the bottom of the problem. Whole genome sequencing is a process that determines the DNA sequence of an entire genome. Whole genome sequencing is a brute-force approach to problem solving when there is a genetic basis at the core of a disease. Several laboratories now provide services to sequence, analyze, and interpret entire genomes.
In 2010, whole genome sequencing was used to save a young boy whose intestines had multiple mysterious abscesses. The child had several colon operations with no relief. Finally, a whole genome sequence revealed a defect in a pathway that controls apoptosis (programmed cell death). A bone marrow transplant was used to overcome this genetic disorder, leading to a cure for the boy. He was the first person to be successfully diagnosed using whole genome sequencing.
The first genomes to be sequenced, such as those belonging to viruses, bacteria, and yeast, were smaller in terms of the number of nucleotides than the genomes of multicellular organisms. The genomes of other model organisms, such as the mouse (Mus musculus), the fruit fly (Drosophila melanogaster), and the nematode (Caenorhabditis elegans) are now known. A great deal of basic research is performed in model organisms because the information can be applied to other organisms. A model organism is a species that is studied as a model to understand the biological processes in other species that can be represented by the model organism. For example, fruit flies are able to metabolize alcohol like humans, so the genes affecting sensitivity to alcohol have been studied in fruit flies in an effort to understand the variation in sensitivity to alcohol in humans. Having entire genomes sequenced helps with the research efforts in these model organisms.
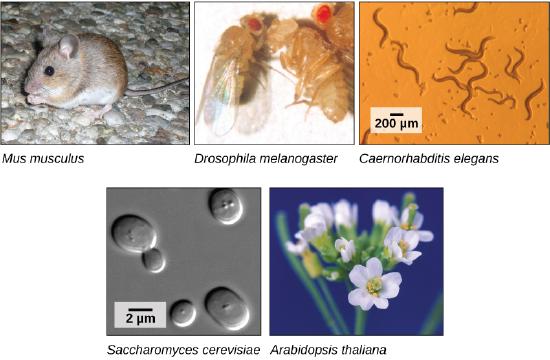
Figure 4. Much basic research is done with model organisms, such as the mouse, Mus musculus; the fruit fly, Drosophila melanogaster; the nematode, Caenorhabditis elegans; the yeast, Saccharomyces cerevisiae; and the common weed, Arabidopsis thaliana. Credit: "mouse": modification of work by Florean Fortescuecredit; "nematodes": modification of work by "snickclunk"/Flickr; "common weed": modification of work by Peggy Greb, USDA; scale-bar data from Matt Russell
The first human genome sequence was published in 2003. The number of whole genomes that have been sequenced steadily increases and now includes hundreds of species and thousands of individual human genomes.
Sanger sequencing
Let's review how DNA sequencing was initially invented. The polymerization of nucleic acids occurs in a 5′ → 3′ direction. The 5′ position has a phosphate group while the 3′ position of the hexose has a hydroxyl group. Polymerization depends on these 2 functional groups in order for a dehydration synthesis reaction to occur and extend the sugar-phosphate backbone of the nucleic acid. In the 1970s, Fred Sanger’s group discovered a fundamentally new method of ‘reading’ the linear DNA sequence using special bases called chain terminators or dideoxynucleotides. The absence of a hydroxyl group at the 3′ position blocks the polymerization, resulting in termination. This method is still in use today and is called "Sanger dideoxynucleotide chain-termination method". This method originally used a radioactively labeled primer to initiate the sequencing reaction. Four reactions take place where each reaction is intentionally “poisoned” with a dideoxy chain terminator. For example, one reaction will have all 4 dNTPs (deoxynucleotide triphosphates) with the addition to a small amount of ddATP (dideoxyadenosine triphosphate). This reaction will result in a series of premature terminations of the polymerization specifically at different locations where an Adenine would be incorporated.

dATP is a natural monomer used in the polymerization of DNA. The 3′-OH is the attachment point of the next subsequent nucleotide.

The lack of a 3′-OH in this molecule of ddATP makes it a chain terminator that will prohibit the addition of another nucleotide to the DNA polymer.
The product of these 4 separate sequencing reactions is run on a large polyacrylamide sequencing gels. The smallest fragments run through the gel the fastest and create a ladder-like pattern. This can be visualized through the use of an x-ray film that is sensitive to the radioactivity. Each lane of the gel corresponds to one of the four chain-terminating reactions. The bases are read sequentially from the bottom up and reveal the sequence of the DNA.
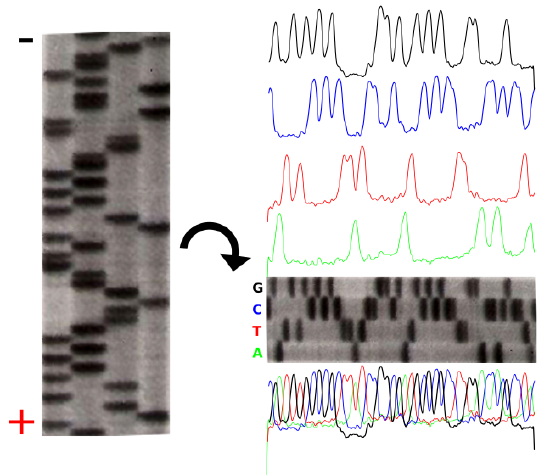
The sequencing gel can be manually scored. The profiles of each lane have been created using ImageJ to illustrate the banding pattern and subsequent sequence.
Credit: John Schmidt & Jeremy Seto (CC-BY-SA 3.0)
Fluorescent Chain Termination and Capillary Electrophoresis
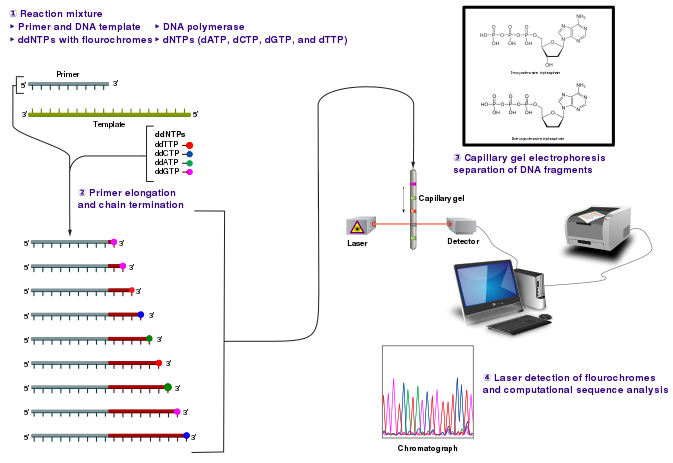
Credit: Estevezj (CC-BY-SA 3.0)
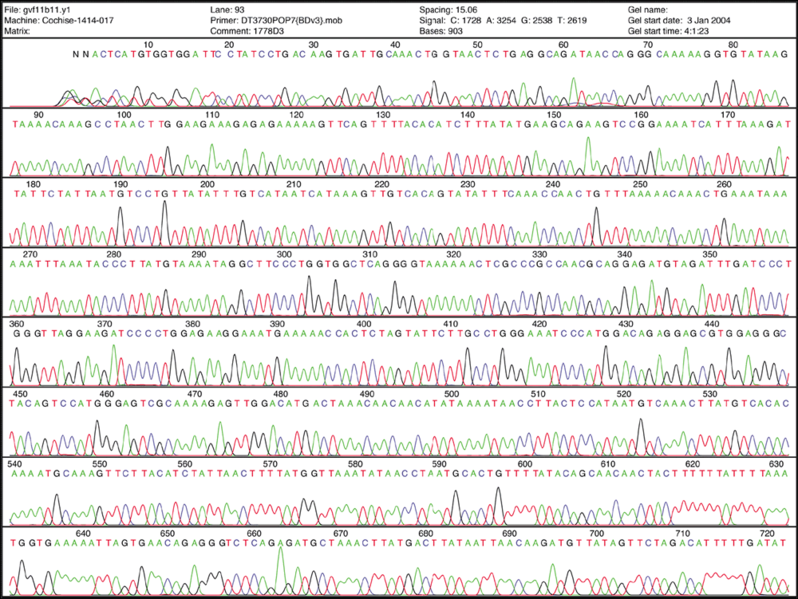
Radioactivity is dangerous and undesirable to work with so chain terminators with fluorescent tags were developed. This method synthesizes a series of DNA strands that are specifically fluorescent at the termination that is passed through a capillary electrophoresis system. As the fragments of DNA pass a laser and detector, the different fluorescent signal attributed to each ddNTP is identified and generates a chromatogram to represent the sequence. Fluorescent Chain Terminators are now used in reactions and run through a small capillary. The smallest fragments run through first and are detected to reveal a chromatogram.
Fluorescent Chromatograms are used to score the nucleotide chain termination. The amplitude of each peak corresponds to the strength or certainty of the nucleotide call. Chromatogram files are usually provided alongside the sequence file with the extension *.ab1 while the sequence files are provided as a text file in the fasta format. More about these files can be found here. The ab1 files are extremely important to analyze when there are ambiguity or sequencing errors. These ab1 files can also be used to ascribe a quality score on the base call.
Section summary
Whole genome sequencing is the latest available resource to treat genetic diseases. Some doctors are using whole genome sequencing to save lives. Genomics has many industrial applications including biofuel development, agriculture, pharmaceuticals, and pollution control.
Imagination is the only barrier to the applicability of genomics. Genomics is being applied to most fields of biology; it can be used for personalized medicine, prediction of disease risks at an individual level, the study of drug interactions before the conduction of clinical trials, and the study of microorganisms in the environment as opposed to the laboratory. It is also being applied to the generation of new biofuels, genealogical assessment using mitochondria, advances in forensic science, and improvements in agriculture.
Link to external resources
What is Genomics - Full Length
https://www.youtube.com/watch?v=mmgIClg0Y1k
How does Sanger Sequencing Work? – Seq It Out #1