

1.6: Diffusion and Osmosis
- Page ID
- 222588

\( \newcommand{\vecs}[1]{\overset { \scriptstyle \rightharpoonup} {\mathbf{#1}} } \)
\( \newcommand{\vecd}[1]{\overset{-\!-\!\rightharpoonup}{\vphantom{a}\smash {#1}}} \)
\( \newcommand{\dsum}{\displaystyle\sum\limits} \)
\( \newcommand{\dint}{\displaystyle\int\limits} \)
\( \newcommand{\dlim}{\displaystyle\lim\limits} \)
\( \newcommand{\id}{\mathrm{id}}\) \( \newcommand{\Span}{\mathrm{span}}\)
( \newcommand{\kernel}{\mathrm{null}\,}\) \( \newcommand{\range}{\mathrm{range}\,}\)
\( \newcommand{\RealPart}{\mathrm{Re}}\) \( \newcommand{\ImaginaryPart}{\mathrm{Im}}\)
\( \newcommand{\Argument}{\mathrm{Arg}}\) \( \newcommand{\norm}[1]{\| #1 \|}\)
\( \newcommand{\inner}[2]{\langle #1, #2 \rangle}\)
\( \newcommand{\Span}{\mathrm{span}}\)
\( \newcommand{\id}{\mathrm{id}}\)
\( \newcommand{\Span}{\mathrm{span}}\)
\( \newcommand{\kernel}{\mathrm{null}\,}\)
\( \newcommand{\range}{\mathrm{range}\,}\)
\( \newcommand{\RealPart}{\mathrm{Re}}\)
\( \newcommand{\ImaginaryPart}{\mathrm{Im}}\)
\( \newcommand{\Argument}{\mathrm{Arg}}\)
\( \newcommand{\norm}[1]{\| #1 \|}\)
\( \newcommand{\inner}[2]{\langle #1, #2 \rangle}\)
\( \newcommand{\Span}{\mathrm{span}}\) \( \newcommand{\AA}{\unicode[.8,0]{x212B}}\)
\( \newcommand{\vectorA}[1]{\vec{#1}} % arrow\)
\( \newcommand{\vectorAt}[1]{\vec{\text{#1}}} % arrow\)
\( \newcommand{\vectorB}[1]{\overset { \scriptstyle \rightharpoonup} {\mathbf{#1}} } \)
\( \newcommand{\vectorC}[1]{\textbf{#1}} \)
\( \newcommand{\vectorD}[1]{\overrightarrow{#1}} \)
\( \newcommand{\vectorDt}[1]{\overrightarrow{\text{#1}}} \)
\( \newcommand{\vectE}[1]{\overset{-\!-\!\rightharpoonup}{\vphantom{a}\smash{\mathbf {#1}}}} \)
\( \newcommand{\vecs}[1]{\overset { \scriptstyle \rightharpoonup} {\mathbf{#1}} } \)
\(\newcommand{\longvect}{\overrightarrow}\)
\( \newcommand{\vecd}[1]{\overset{-\!-\!\rightharpoonup}{\vphantom{a}\smash {#1}}} \)
\(\newcommand{\ket}[1]{\left| #1 \right>}\)
\(\newcommand{\bra}[1]{\left< #1 \right|}\)
\(\newcommand{\braket}[2]{\left< #1 \vphantom{#2} \right| \left. #2 \vphantom{#1} \right>}\)
\(\newcommand{\braopket}[3]{\left< #1 \vphantom{#2}\vphantom{#3} \right| #2 \vphantom{#1}\vphantom{#3} \left| #3 \vphantom{#1}\vphantom{#2} \right>}\)
\(\newcommand{\qmvec}[1]{\mathbf{\vec{#1}}}\)
\(\newcommand{\op}[1]{\hat{\mathbf{#1}}}\)
\(\newcommand{\expect}[1]{\langle #1 \rangle}\)
\(\newcommand{\dfn}[1]{\emph{\textbf{#1}}}\)
Purpose:
This lab investigates the processes of diffusion and osmosis and focuses on the movement of molecules across selectively permeable membranes. Students will explore the effects of solute concentration (tonicity) on osmosis and understand how cells maintain homeostasis.
In this laboratory, students will:
- Conduct experiments to observe diffusion and osmosis using agar plates, diffusion in dialysis tubing, and osmosis in potato strips, Elodea cells, and red blood cells.
- Measure and analyze the effects of tonicity on cells.
- Use collected data to determine relationships between the properties of molecules and the rate of diffusion.
Student Learning Objectives:
- Accurately collect and record data for each experiment.
- Interpret experimental results to explain the behavior of cells in isotonic, hypertonic, and hypotonic solutions.
- Present findings in well-labeled tables and optional graphs.
Background
Cell theory states that all living things are composed of cells and that cells only arise from other cells. Some cells are simple in structure, while others are extremely complex. All cells share some common properties: the presence of DNA, intracellular proteins that enable the cell to perform its functions, and a plasma membrane. Eukaryotic cells also contain membrane-bound organelles that allow a more complex level of functioning.
Homeostasis is defined as the maintenance of a stable internal environment. To maintain homeostasis, cells continually transport substances in and out across their cell (plasma) membrane.
The cell membrane serves as a “gatekeeper” and is the cellular structure that regulates the transport of materials into and out of the cell. The phospholipid bilayer architecture of the cell membrane allows certain molecules to pass through while keeping others out, therefore the cell membrane is selectively permeable (or semipermeable). Things that need to enter a cell for it to function properly include ions, nucleotides, sugars, oxygen, amino acids, water, vitamins, and some hormones. Cells also allow certain molecules like water, ions, and secreted proteins to leave. Additionally, cells must eliminate waste products like urea and carbon dioxide
In the following exercises, you will examine the semi-permeable nature of the cell membrane. You will also explore the concept of tonicity, which refers to the solute concentration of a solution, and its ability to influence the rate and direction of osmosis, or the movement of water into or out of the cell.
Diffusion and Osmosis
Diffusion is the movement of molecules from an area in which they are high in concentration to an area in which they are low in concentration. Molecules move down a concentration gradient until they are equally distributed, or equilibrium is reached (Fig.1). At equilibrium, there is no concentration gradient. Molecules still move once equilibrium is reached, but there is no net movement in any one direction.
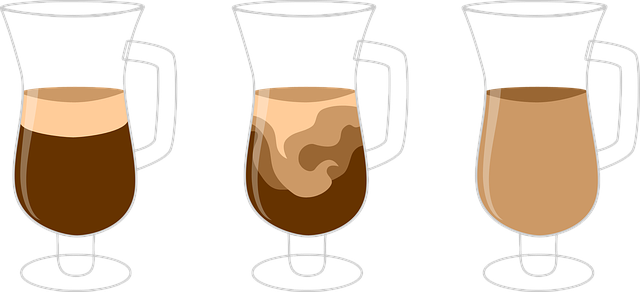
Osmosis is a specific type of diffusion: the diffusion of water molecules across a semi-permeable membrane. Like other molecules, water molecules diffuse down a concentration gradient, from an area of higher free water concentration to an area of lower free water concentration. This means that water will move across a semipermeable membrane, like the cell membrane, in the direction of the higher solute concentration. (In solution, high solute concentration = low free water concentration; conversely, low solute concentration = high free water concentration.) You will observe this concept in Part 2: Osmosis & Tonicity.
Many substances surrounding a cell are dissolved in water. Substances dissolved in water are called solutes. The water is the solvent. For example, in salt water, salt is the solute and water is the solvent. The cell membrane is selectively permeable: it allows some substances to cross more easily than others.
Lab Safety
Safety Guidelines for Handling Solutions and Materials:
- Wear personal protective clothing as instructed by your instructor
- Handle glass slides with care to avoid injuries.
- Dispose of biological samples (e.g., blood, plant materials) as instructed.
- Wash hands thoroughly after completing the lab.
PART 1: DIFFUSION & OSMOSIS
Exercise 1: Diffusion Through a Semisolid Medium
The purpose of this lab is to demonstrate diffusion of a molecule through a semisolid medium. You will investigate the movement of an acid through agar gel media containing the dye bromothymol blue. This dye is blue under neutral pH conditions but changes to yellow when exposed to an acid which allows us to follow the extent of diffusion over time.
Materials:
- Petri dish of bromothymol blue agar
- Straw
- Vinegar
Procedure:
- Obtain a petri dish of agar
- Take the plastic straw and gently stick it down into the center of the agar without pushing the straw to the bottom of the plate. We want a layer of agar left on the bottom of the dish. Lift the straw to remove a small plug of agar.
- Using the dropper bottle or a 1mL transfer pipet, place two drops of vinegar into the agar well you just created. (Fig. 2).

4. Place a small metric ruler underneath the Petri dish with the zero mark centered on the well to measure the distance (diameter) that the acid moves.
5. As the acid diffuses, the blue dye will turn yellow. This serves as an indication for the rate of diffusion. Record the distance traveled every 10 minutes in Table 1.
Table 1 - Diffusion results
|
Diameter after 10 min. (mm) |
Diameter after 20 min. (mm) |
Diameter after 30 min. (mm) |
Diameter after 40 min. (mm) |
|
|---|---|---|---|---|
|
Acetic acid (vinegar) |
Exercise 2: Diffusion Across a Membrane
In these experiments dialysis tubing is used to simulate the cell membrane. Dialysis tubing is semi-permeable because the tubing has tiny pores that allow some materials to enter and exit the tubing. You will perform experiments that ask if various molecules are able to enter or exit the tubing. Read about the experiments below and complete the following questions.
Employing Steps in the Scientific Method:
- Record the Question that is being investigated in this experiment. ________________________________________________________________
- Record a Hypothesis for the question stated above. ________________________________________________________________
- Predict the results of the experiment based on your hypothesis (if/then). ________________________________________________________________
- Perform the experiment below and collect your data.
Materials:
| Equipment | Materials |
| Dialysis tubing | 15% Sucrose solution (MW sucrose = 342 g/mol) |
| Plastic clips or string | 30% Sucrose solution (MW sucrose = 342 g/mol) |
| 10mL graduated cylinder | 30% Dextrose solution (MW dextrose = 180 g/mol) |
| 4 x 600 mL beakers (or plastic cups) | 15% starch solution (MW = variable) |
| Electronic balance | Iodine solution (MW = 166 g/mol) |
| Weigh boats | Benedict’s reagent |
| Graduated cylinders (10 mL and 100 mL) | |
| Sharpie | |
| Hot plate or heat block |
Procedure:
- Cut 4 pieces of dialysis membrane approximately 20 cm long. Soak the pieces in water until they are soft and pliable (3-5 minutes). *This step may already be done.*
- Obtain 4, 600 ml beakers and label them #1 - 4. Fill each beaker with 400 mL of solution as shown below:
- Beaker #1 – H2O
- Beaker #2 – H2O
- Beaker #3 – H2O
- Beaker #4 - H2O and 1mL Iodine solution
- Set beakers aside. Remove one piece of dialysis membrane from the soaking water and open it, forming a tube.
- Close one end of the tube with dialysis tubing clips.
- Fill the bag with 10 mL of H2O using a pipet. Remove excess air and close the other end of the bag with a plastic clip. Set aside on a paper towel and ensure it doesn’t leak. This is bag 1.

Figure 3: Dialysis tube "bag" (By MG) - Repeat steps 4 and 5 for the 4 remaining dialysis tubes, filling them with 10 mL of the solutions listed below as follows: Use a fresh or different pipet for each solution
- Bag #2 – 10mL 15% sucrose
- Bag #3 – 10mL 30% sucrose
- Bag #4 –5 mL 30% dextrose solution and 5 mL 15% starch.
-
-

Figure 4: Completed bag and beaker setup (By MG) 
Figure 5: Completed bag and beaker setup (By MG)
-
- Rinse off the outside of the bags with water and carefully blot dry with paper towel.
- Weigh bags #1 - 3 to the nearest 0.5g. Record the weights in Table 1 below, in the column labeled “0 min.” NOTE: We will be doing a slightly different experiment with bag 4 so weighing it isn’t necessary. Go to step 15 for more about bag 4.
- Place all 4 bags in their corresponding beakers (Bag #1 in Beaker #1, etc.). Make sure each bag is fully submerged in the solution.
- Set a timer for 5 minutes.
- At the end of 5 minutes, remove bags 1 - 3 from their beakers, blot excess fluid, and record the mass (in grams) in Table 2.
- Return the bags to the appropriate beaker and wait another 5 minutes.
- Repeat steps 11 - 13 every 5 minutes and record the weights in Table 1. You will only observe bag #4 once at the end of the 20-minute observation.
-
Table 2. Osmosis - mass (g) over time for dialysis bags Time (min.)
0 5 10 15 20 Beaker #1 (water)
Bag #1 (water) Beaker #2 (water)
Bag #2 (15 % sucrose) Beaker #3 (water)
Bag #3 (30% sucrose)
-
- Calculate the total weight change (weight change = final weight – initial weight) for each bag. Record the values in Table 3. Calculate the rate (g/min) of osmosis for each bag by dividing the weight change by the time change. Since all 3 bags were recorded for a total of 20 minutes, the time change for all 3 bags is 20 minutes. Record the rate of osmosis for all 3 bags in Table 3.
-
Table 3. Rate of osmosis Weight Change (g)
Time (min)
Rate (g/min)
Bag #1 (water)
Bag #2 (15% sucrose)
Bag #3 (30% sucrose)
-
- Make observations about what you see in bag #4 and beaker #4 in Table 3.
- Remove 2 mL of liquid from bag #4 and beaker #4 with a pipette and add the contents to separate test tubes. Be sure to label the test tubes.
- Add 10 drops of Benedict's solution to each of the two test tubes and heat to 100 degrees Celsius in a boiling water bath or heat block for 2 - 5 minutes. Record the test results in Table 4. You are measuring the concentration of glucose in the beaker.
- Alternatively, measure the concentration of glucose in the beaker using a Urine Test Strip. Dip the test strip in the beaker and remove. Determine the glucose concentration by comparing the color on the tip of the strip with the scale provided with the test strips.
|
Appearance of liquid after 20 minutes |
Appearance of liquid after heating with Benedicts Solution Or after testing with a urine strip | |
|---|---|---|
|
Bag #4 (5 mL 30% dextrose solution and 5 mL 15% starch solution) |
||
|
Beaker 4 (H2O and 1mL Iodine solution) |
Questions
- Did the weight of each bag (#1 - #3) change significantly over 20 minutes? Explain why.
- In which bag(s) did water move into the dialysis bag?
- What can you conclude about the movement of Iodine, dextrose, and starch across the dialysis membrane based on your results in Table 3? Support your answers for each with the observation from bag #4 and beaker #4.
- Iodine -
- dextrose -
- Starch -
- Iodine -
- In terms of solvent (water) concentration, water moved from the area of _______________ concentration to the area of __________________ concentration through the selectively permeable membrane. This is defined as _______________.
- We used the dialysis tubing to simulate a cell membrane. How is the dialysis tubing functionally the same as a cell membrane?
- We used the dialysis tubing to simulate a cell membrane. How is the dialysis tubing functionally different from a cell membrane?
PART 2: OSMOSIS & TONICITY
Tonicity describes how a solution affects the net movement of water into and out of the cell.
An isotonic solution has the same concentration of solute (and therefore of free water) as the cell. When cells are placed in an isotonic solution, there is no net movement of water.
- A hypertonic solution has a higher solute (therefore, lower free water) concentration than the cell. When cells are placed in a hypertonic solution, water moves out of the cell into the lower free water solution.
- A hypotonic solution has a lower solute (therefore, higher free water) concentration than the cell. When cells are placed in a hypotonic solution, water moves into the cell from the higher free water solution.
Exercise 1: Observing Osmosis in Potato Strips
Employing Steps in the Scientific Method:
Read about this experiment and answer the following questions.
- Record the Question that is being investigated in this experiment. ________________________________________________________________
- Record a Hypothesis for the question stated above. ________________________________________________________________
- Predict the results of the experiment based on your hypothesis (if/then). ________________________________________________________________
- Perform the experiment below and collect your data.
Materials:
| Equipment | Materials |
| Cork borer | 10% NaCl solution |
| Petri dish | 0.9% NaCl solution |
| Sharpie | Potatoes |
| Metric ruler | |
| Forceps and scalpel |
Procedure:
- Obtain a potato and use a cork borer to prepare 3 cylinders of potato. Push the borer through the length of the potato. When the borer is filled, use the flat end of a glass rod to gently push out the potato cylinder into the petri dish. Use the scalpel to cut each potato cylinder into a length of 5 cm.
- With Sharpie, label 3 test tubes (1, 2, 3).
- Using the metric ruler, mark each tube at the 10 ml (cm) level from the bottom of the tube.
- Set up three test tubes with 10 ml of solutions as follows:
- Tube #1 - distilled water
- Tube #2 - 10% sodium chloride (NaCl)
- Tube #3 - 0.9% NaCl
- Place one potato cylinder into each test tube and allow them to soak for about 15 minutes in the solutions.
- You can now move on to Exercises 2 and 3 while your potatoes soak.
- When time is up, remove the potato cylinders from the test tubes and make observations about relative limpness (water loss, flaccid) or stiffness (water gain, turgor).
Questions
- Which tube contained the limp (flaccid) potato strip? Explain.
- Which tube contained the stiff (turgid) potato strip? Explain.
- In which solution did the potato strip change the least the? What does this result suggest?
A plant cell is surrounded by a rigid cell wall, so when the cell is placed in a hypotonic environment, the net flow of water is from the surrounding medium into the cell, and it simply expands to the cell wall and becomes turgid. When the same plant cell is placed in a hypertonic environment, water leaves the central vacuole and the cytoplasm shrinks. This causes the cell membrane to pull away from the cell wall. In this situation, the plant cell will undergo plasmolysis and die. Animal cells have no cell wall so when they are in a hypotonic environment they will expand and fill with water until they burst or lyse. Figures 5 and 6 demonstrate these conditions.
Figure 5 - Plant cell tonicity. The turgor pressure within a plant cell depends on the solution's tonicity in which it is bathed. (credit: modification of work by Mariana Ruiz Villareal CCBY)
Figure 6 - Red blood cells in varied osmotic environments.(Diffusion and Osmosis. (2021, February 28). Retrieved April 1, 2021, from https://chem.libretexts.org/@go/page/34826 CCBY)
Exercise 2: Observing Osmosis in Elodea Cells
Employing Steps in the Scientific Method:
Read the experiment below and answer the following questions.
- Record the Question that is being investigated in this experiment.
- Record a Hypothesis for the question stated above.
- Predict the results of the experiment based on your hypothesis (if/then).
- Perform the experiment below and collect your data.
Materials
| Equipment | Materials |
| Microscope | 10% salt solution |
| Blank slides and coverslips | DI water |
| Forceps | Elodea leaf |
Procedure
- Place a drop of water onto a clean microscope slide. Gently tear off a small leaf from the Elodea plant. The greener, the better.
- Prepare a wet mount by placing the Elodea leaf into the drop of water on your slide.
- Place a coverslip onto the slide.
- Use the scanning (4x) objective to bring the Elodea cells into focus. You may not be able to observe individual cells at this power.
- Switch to the low power (10x) objective. The Elodea cell walls should be visible. They will look like dark green grid lines. Use the fine focus adjustment to focus the specimen.
- Once you think you have located an Elodea cell, switch to the high power (40x) objective and refocus using the fine focus adjustment.
- Next, add a drop of 10% salt (NaCl) solution to the edge of the coverslip to allow the salt to diffuse under the coverslip. Clean any excess water from around the coverslip with a Kimwipe or paper towel.
- Observe what happens to the cells. Look for cells that have been visibly altered.
- Record your observations in the following table. The cells in distilled water should look similar to the figure below.
|
Solution |
Appearance of Elodea Cells |
|---|---|
|
Distilled water (0% NaCl) |
|
|
10% NaCl |

Questions
- Which solution is hypertonic to an Elodea cell? Use your observations to support your answer.
_______________________________________________________________________
- Would you expect pond water to be isotonic, hypotonic, or hypertonic to Elodea cells? Explain your answer.
_______________________________________________________________________
- Explain what happens to a plant cell that undergoes plasmolysis.
_______________________________________________________________________
Exercise 3: Observing Osmosis in Red Blood Cells (Erythrocytes)
- Predict the results of the observations of red blood cells in different solutions. (This experiment may be set up as a demonstration for observation and recording of data)
Materials
| Equipment | Materials |
| Microscope | DI water |
| Blank slides and coverslips | 10% NaCl solution |
| Sharpie | 0.9% NaCl solution |
|
Fresh supply of red blood cells (Sheep RBCs) |
Procedure
- Obtain 3 test tubes and label them (1, 2, 3) with a Sharpie.
- Set up the three test tubes with 5 mL of solutions as follows:
- Tube 1 - Distilled water
- Tube 2 - 10% NaCl
- Tube 3 - 0.9% NaCl
- Using a new transfer pipette, add 2 drops of blood to each tube and swirl gently to mix the contents.
- Hold each test tube up to a sheet of paper with printed text. Attempt to read the print through each tube and record your results in the following table.
|
Test Tube / Solution |
Appearance of Solution |
Can you read print? |
|---|---|---|
|
#1 - Distilled water |
||
|
#2 - 10% NaCl |
||
|
#3 - 0.9% NaCl |
- Label 3 microscope slides (1, 2, 3) with a Sharpie.
- Prepare wet mounts of each tube by placing a drop of the solution in each tube (1 - 3) on the appropriate microscope slide.
- Add a coverslip to each slide.
- View slide 1 through the microscope using the scanning (4x) objective first. Focus the image using the coarse adjustment. Then view the blood cells under low power and then high power. Only use the fine focus adjustment to focus the specimen.
- Observe slide 2 and slide 3 in the same manner.
- Record the appearance of the red blood cells in each solution in the following table.
|
Solution |
Appearance of RBCs |
|---|---|
|
#1 - Distilled water |
|
|
#2 - 10% NaCl |
|
|
#3 - 0.9% NaCl |
- Which solution allowed you to read print through the solution? Explain.
__________________________________________________________________ - Which solution is hypertonic to the RBCs? Use your observations to support your answer.
__________________________________________________________________ - Which solution is hypotonic to the RBCs? How did you know? Use your observations to support your answer.
__________________________________________________________________ - Which solution is isotonic to the RBCs? How do you know? Use your observations to support your answer.
__________________________________________________________________
Questions for Review
- Define diffusion. What is the energy source for diffusion? Is diffusion considered an active or passive process? Explain.
- Name a molecule that diffused through the artificial membrane (dialysis tubing) that we used in the laboratory. Can diffusion occur without a membrane? Give an example to support your answer.
- What is osmosis? Is it an active or a passive process? Explain.
- Fill in the blank in the following statements.
- A solution that has a lower solute concentration than another solution is said to be ______________________ when compared with the second solution.
- A solution that has the same solute concentration as another solution is said to be ______________________ when compared with the second solution.
- A solution that has a higher solute concentration than another solution is said to be ______________________ when compared with the second solution.
- What does it mean when a membrane is selectively permeable?
Practical Challenge
- Briefly explain what happens to a red blood cell when placed into the following solutions.
- Isotonic solution –
- Hypertonic solution –
- Hypotonic solution -
- Isotonic solution –
- Seawater contains a high concentration of dissolved salts. Using the concept of osmosis, explain why marine organisms are sometimes said to live in a desert environment.
Licensing and Attributions
Adapted from 5: Osmosis Lab which is shared under a CC BY 4.0 license and was authored, remixed, and/or curated by Brad Basehore, Michelle A. Bucks, & Christine M. Mummert via source content that was edited to the style and standards of the LibreTexts platform.
1.4: Diffusion and Osmosis by Brad Basehore, Michelle A. Bucks, & Christine M. Mummert is licensed CC BY 4.0. Original source: https://oer.galileo.usg.edu/biology-textbooks/18