2.2.2: B2. Sequence Determination Using Mass Spectrometry
- Last updated
- Save as PDF
- Page ID
- 64208
Mass spectrometry is supplanting more tradition methods (see above) as the choice to determine the molecular mass and structure of a protein. Its power comes from its exquisite sensitivity and modern computational methods to determine structure through comparisons of ion fragment data with computer databases of known protein structures. In mass spectrometry, a molecule is first ionized in an ion source. The charged particles are then accelerated by an electric field into a mass analyzer where they are subjected to an external magnetic field. The external magnetic field interacts with the magnetic field arising from the movement of the charged particles, causing them to deflect. The deflection is proportional to the mass to charge ratio, m/z. Ions then enter the detector which is usually a photomultiplier. Sample introduction into the ion source occurs though simple diffusion of gases and volatile liquids from a reservoir, by injection of a liquid sample containing the analyte by spraying a fine mist, or for very large proteins by desorbing a protein from a matrix using a laser. Analysis of complex mixtures is done by coupling HPLC with mass spectrometry in a LCMS.
Ion source: There are many methods to ionize molecules, including atmospheric pressure chemical ionization (APCI), chemical ionization (CI), or electron impact (EI). The most common methods for protein/peptide analyzes are electrospray ionization (ESI) and matrix assisted laser desorption ionization (MALDI).
Electrospray ionization (ESI) - The analyte, dissolved in a volatile solvent like methanol or acetonitrile, is injected through a fine stainless steel capillary at a slow flow rate into the ion source. A high voltage (3-4 kV) is maintained on the capillary giving it a positive charge with respect to the other oppositely charged electrode. The flowing liquid becomes charged with same polarity as the polarity of the positively charged capillary. The high field leads to the emergence of the sample as a charged aerosol spray of charged microdrops which reduces electrostatic repulsions in the liquid. This method essentially uses electrical energy to produce the aerosol instead of mechanical energy to produce a liquid aerosol, as in the case of a perfume atomizer. Surrounding the capillary is a flowing gas (nitrogen) which helps to move the aerosol towards the mass analyzer. The microdrops become smaller in size as the volatile solvent evaporates, increasing the positive charge density on the drops. Eventually electrostatic repulsions cause the drops to explode in a series of steps, ultimately producing analyte devoid of solvent. This gentle method of ionization produces analytes that are not cleaved but ready for introduction into the mass analyzer. Protein emerge from this process with a roughly Gaussian distribution of positive charges on basic side chains. In organic chemistry you studied mass spectrums of small molecules induced by electron bombardment. This produces ions of +1 charge as an electron is stripped away from the neutral molecule. The highest m/z peak in the spectrum is the parent ion or M+ ion. The highest m/z ratio detectable in the mass spectrum is in the thousands. However, large peptides and proteins with large molecular masses can be detected and resolved since the charge on the ions are great than +1. In 2002, John Fenn was awarded a Noble Prize in Chemistry for the development and use of ESI to study biological molecules.
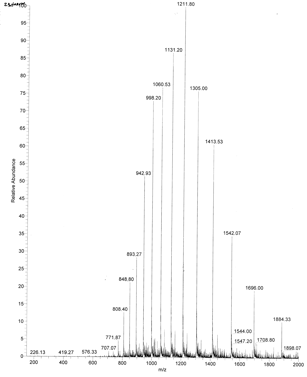
An example of an ESI spectrum of apo-myoglobin is shown below. Note the roughly Gaussian distribution of the peaks, each of which represents the intact protein with charges differing by +1. Protein have positive charges by virtue of both protonation of amino acid side chains as well as charges induced during the electrostray process itself. Based on the amino acid sequence of myoglobin and the assumption that the pKa of the side chains are the same in the protein as for isolated amino acids, the calculated average net charges of apoMb would be approximately +30 at pH 3.5, +20 at pH 4.5, +9 at pH 6, and 0 at pH 7.8 (the calculated pI). The mass spectrum below was taken by direct injection into the MS of apoMb in 0.1% formic acid (pH 2.8). Charges on the peptide are a combined results of charges present on the peptide before the electrospray and changes in charges induced during the process. www.chm.bris.ac.uk/ms/theory/...onisation.html. .
Figure: ESI Mass Spectrum of Apo-Myoglobin

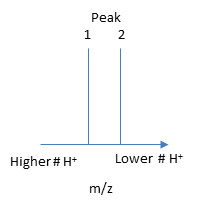
The molecular mass of the protein can be determined by analyzing two adjacent peaks, as shown in the figure below.

If M is the molecular mass of the analyte protein, and n is the number of positive charges on the protein represented in a given m/z peak, then the following equations gives the molecular mass M of the protein for each peak:
\[Mpeak2 = n(m/z)peak 2 - n(1.008)\]
\[Mpeak1 = (n + 1) (m/z)peak 1 - (n +1) (1.008)\]
where 1.008 is the atomic weight of H. Since there is only one value of M, the two equations can be set equal to each other, giving:
\[n(m/z)peak 2 - n(1.008) = (n + 1) (m/z)peak 1 - (n +1) (1.008)\]
Solving for n gives:
\[n = [(m/z)peak 1- 1.008]/[(m/z)peak 2 -(m/z)peak 1]. \]
Knowing n, the molecular mass M the protein can be calculated for each m/z peak. The best value of M can then be determined by averaging the M values determined from each peak (16,956 from the above figure). For peaks from m/z of 893-1542, the calculated values of n ranged from +18 to +10.
Matrix assisted laser desorption ionization (MALDI): In this technique, used for larger biomolecules like proteins and polysaccharides, the analyte is mixed with an absorbing matrix material. Laser excitation is used to excite the matrix, leading to energy transfer that results in ionization and "launching" of the matrix and analyte in ion form from the solid mixture. Parent ion peaks of (M+H)+ and (M-H)- are formed.
Mass Analyzer
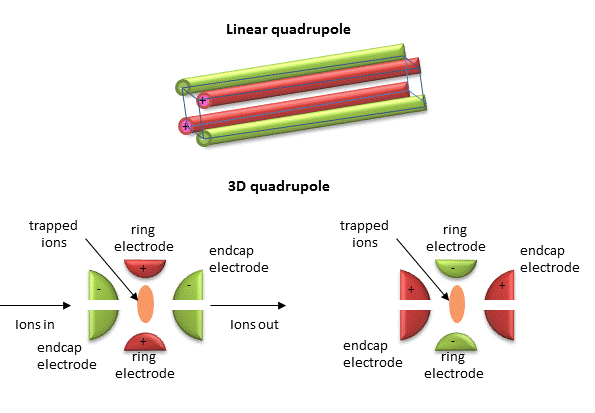
Quadrupole ion trap (used in ESI) - A complex mixture of ions can be contained (or trapped) in this type of mass analyzer. Two common type are linear and 3D quadrupoles.
Figure: Linear and 3D Quadrupoles

As dipoles display positive and negative charge separation on a linear axis, quadrupoles have either opposite electrical charges or opposite magnetic fields at the opposing ends of a square or cube. In charge separation, the monopole (sum of the charges) and dipoles cancel to zero, but the quadrupole moment does not. The quadrupole traps ions using a combination of fixed and alternating electric fields. The trap contains He at 1 mTorr. For the 3D trap, The ring electrode has a oscillating RF voltage which keeps the ions trapped. The end caps also have an AC voltage. Ions oscillate in the trap with a "secular" frequency determined by the frequency of the RF voltage, and of course, the m/z ratio. By increasing the the amplitude of the RF field across the ring electron, ion motion in the trap becomes destabilized and leads to ion ejection into the detector. When the secular frequency of ion motion matches the applied AC voltage to the endcap electrodes, resonance occurs and the amplitude of motion of the ions increases, also allowing leakage out of the ion trap into the detector.
 Ion Trap Tutorial
 Ion Trap Animation (requires download) from Thermo Scientific
Time of Flight (TOF) tube (used in MALDI) - a long tubes is used and the time required for ion detection is determined. The small molecular mass ions take the shortest time to reach the detector.
Tandem Mass Spectrometry (MS/MS)
Quadrupole mass analyzers which can select ions of varying m/z ratios in the ion traps are commonly used in for tandem mass spectrometry (MS/MS). In this technique, the selected ions are further fragmented into smaller ions by a process called collision induced dissociation (CID). When performed on all of the initial ions present in the ion trap, the sequence of a peptide/protein can be determined. This techniques usually requires two mass analyzers with a collision cell in-between where selected ions are fragmented by collision with an inert gas. It can also be done in a single mass analyzer using a quadrupole ion trap.
In a typical MS/MS experiment to determine a protein sequence, a protein is cleaved into protein fragments with an enzyme such as trypsin, which cleaves on carboxyl side of positively charge Lys and Arg side chains. The average size of proteins in the human proteome is approximately 50,000. If the average molecular mass of an amino acid in a protein is around 110 (18 subtracted since water is released on amide bond formation), the average number of amino acids in the protein would be around 454. If 10% of the amino acids are Arg and Lys, the on average there would be approximately 50 Lys and Arg, and hence 50 tryptic peptides of average molecular mass of 1000. The fragments are introduced in the MS where a peptide fragment fingerprint analysis can be performed. The MWs of the fragments can be identified and compared to known peptide digestion fragments from known proteins to identify the analyte protein.
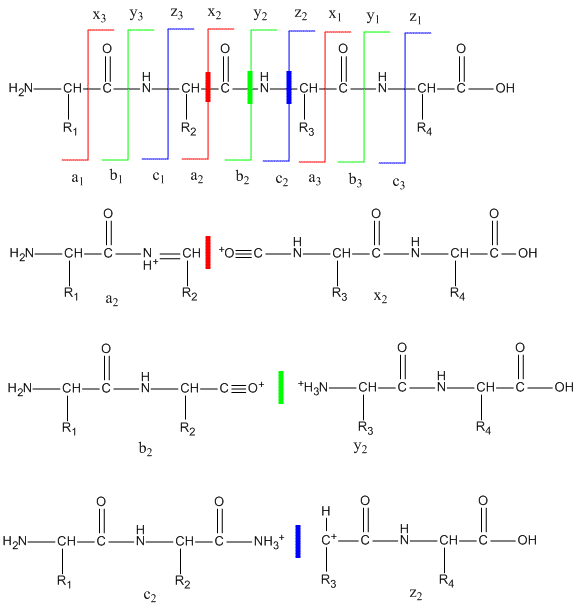
To get sequence information, a tryptic peptide with a specific m/z ratio (optimally with a single +1 charge) is further selected in the ion trap and fragmented on collision with an inert agent (MS/MS). Since the m/e range of mass spectrometers is in the thousands, tryptic fragments with a single charge can easily be detected and targeted for MS/MS. The likely and observed cleavages for a tetrapeptide and the resulting ions with a +1 charge are illustrated below. Ions with the original N terminus are denoted as a, b, and c, while ions with the original C terminus are denoted as x, y, and z. c and y ions gain an extra proton from the peptide to form positively charged -NH3+ groups. The actual ions observed depend on many factors including the sequence of the peptide, its original charge, the energy of the collision inducing the fragmentation, etc. Low energy fragmentation of peptides in ion traps usually produce a, b, and y ions, along with peaks resulting from loss of NH3 (a*, b* and y*) or H2O (ao, bo and yo). No peaks resulting from fragmentation of side chains are observed. Fragmentation at two sites in the peptide (usually at b and y sites in the backbone) form an internal fragment.
Figure: Peptide Fragmentation and Sequencing by MS/MS

The y1 peak represents the C-terminal Lys or Arg (in this example) of the tryptic peptide. Peak y2 has one addition amino acid compared to y1 and the molecular mass difference identifies the extra amino acid. Peak y3 is likewise one amino acid larger than y2. All three y fragments peaks have a common Lys/Arg C-terminal and the charged fragment contains the C-terminal end of the original peptide. All b fragment peaks for a given peptide contain a common N terminal amino acid with b1 the smallest. Note that the subscript represents the number of amino acids in the fragment. By identifying b and y peaks the actual sequence of small peptide can be determined. Usually spectra are match to databases to identify the structure of each peptide and ultimately that of the protein. The actual m values for fragments can be calculated as follows, where (N is the molecular mass of the neutral N terminal group, (C) is the molecular mass of the neutral c terminal group, and (M) is the molecule mass of the neutral amino acids.
- a: (N)+(M)-CHO
- b: (N)+(M)
- y: (C)+(M)+H (note in the figure above that the amino terminus of the y peptides has an extra proton in the +1 charged peptides.)
m/z values can be calculated from the calculated m values and by adding the one H mass to the overall z if the overall charge is +1, etc.
|
Residue |
Code |
Monoisotopic Mass |
Average Mass |
|---|---|---|---|
|
Ala |
A |
71.03714 |
71.0779 |
|
Arg |
R |
156.101111 |
156.1857 |
|
Asn |
N |
114.042927 |
114.1026 |
|
Asp |
D |
115.026943 |
115.0874 |
|
Cys |
C |
103.009185 |
103.1429 |
|
Glu |
E |
129.042593 |
129.114 |
|
Gln |
Q |
128.058578 |
128.1292 |
|
Gly |
G |
57.021464 |
57.0513 |
|
His |
H |
137.058912 |
137.1393 |
|
Ile |
I |
113.084064 |
113.1576 |
|
Leu |
L |
113.084064 |
113.1576 |
|
Lys |
K |
128.092963 |
128.1723 |
|
Met |
M |
131.040485 |
131.1961 |
|
Phe |
F |
147.068414 |
147.1739 |
|
Pro |
P |
97.052764 |
97.1152 |
|
Ser |
S |
87.032028 |
87.0773 |
|
Thr |
T |
101.047679 |
101.1039 |
|
Trp |
W |
186.079313 |
186.2099 |
|
Tyr |
Y |
163.06332 |
163.1733 |
|
Val |
V |
99.068414 |
99.1311 |
As an example, sing these MW values, the sequence of the human Glu1- fibrinopeptide B can be determined from MS/MS spectra shown in an annotated form below. Note that most of the b peaks are b* resulting from lost of NH3 from the N terminus.
Figure: Annotated MS/MS spectra of human Glu1- fibrinopeptide B

 MS review from Organic Chemistry
 Mass Spectroscopy Educational Resources
 Mass Spec Resources
 Sequence Determination: Animation
 An Introduction to Mass Spectrometry
 Ion Traps
 What is electrospray?
 Protein Prospector: Proteomics tools for mining sequence databases in conjunction with Mass Spectrometry experiments
 Proteomics Research for Integrative Biology
 Mascot from Matrix Science: a powerful search engine which uses mass spectrometry data to identify proteins from primary sequence databases
 Peptide Mass Fingerprinting: A tutorial


