
Activity 2-2 - DNA Analysis via Restriction Enzymes
- Page ID
- 158614

\( \newcommand{\vecs}[1]{\overset { \scriptstyle \rightharpoonup} {\mathbf{#1}} } \)
\( \newcommand{\vecd}[1]{\overset{-\!-\!\rightharpoonup}{\vphantom{a}\smash {#1}}} \)
\( \newcommand{\dsum}{\displaystyle\sum\limits} \)
\( \newcommand{\dint}{\displaystyle\int\limits} \)
\( \newcommand{\dlim}{\displaystyle\lim\limits} \)
\( \newcommand{\id}{\mathrm{id}}\) \( \newcommand{\Span}{\mathrm{span}}\)
( \newcommand{\kernel}{\mathrm{null}\,}\) \( \newcommand{\range}{\mathrm{range}\,}\)
\( \newcommand{\RealPart}{\mathrm{Re}}\) \( \newcommand{\ImaginaryPart}{\mathrm{Im}}\)
\( \newcommand{\Argument}{\mathrm{Arg}}\) \( \newcommand{\norm}[1]{\| #1 \|}\)
\( \newcommand{\inner}[2]{\langle #1, #2 \rangle}\)
\( \newcommand{\Span}{\mathrm{span}}\)
\( \newcommand{\id}{\mathrm{id}}\)
\( \newcommand{\Span}{\mathrm{span}}\)
\( \newcommand{\kernel}{\mathrm{null}\,}\)
\( \newcommand{\range}{\mathrm{range}\,}\)
\( \newcommand{\RealPart}{\mathrm{Re}}\)
\( \newcommand{\ImaginaryPart}{\mathrm{Im}}\)
\( \newcommand{\Argument}{\mathrm{Arg}}\)
\( \newcommand{\norm}[1]{\| #1 \|}\)
\( \newcommand{\inner}[2]{\langle #1, #2 \rangle}\)
\( \newcommand{\Span}{\mathrm{span}}\) \( \newcommand{\AA}{\unicode[.8,0]{x212B}}\)
\( \newcommand{\vectorA}[1]{\vec{#1}} % arrow\)
\( \newcommand{\vectorAt}[1]{\vec{\text{#1}}} % arrow\)
\( \newcommand{\vectorB}[1]{\overset { \scriptstyle \rightharpoonup} {\mathbf{#1}} } \)
\( \newcommand{\vectorC}[1]{\textbf{#1}} \)
\( \newcommand{\vectorD}[1]{\overrightarrow{#1}} \)
\( \newcommand{\vectorDt}[1]{\overrightarrow{\text{#1}}} \)
\( \newcommand{\vectE}[1]{\overset{-\!-\!\rightharpoonup}{\vphantom{a}\smash{\mathbf {#1}}}} \)
\( \newcommand{\vecs}[1]{\overset { \scriptstyle \rightharpoonup} {\mathbf{#1}} } \)
\(\newcommand{\longvect}{\overrightarrow}\)
\( \newcommand{\vecd}[1]{\overset{-\!-\!\rightharpoonup}{\vphantom{a}\smash {#1}}} \)
\(\newcommand{\avec}{\mathbf a}\) \(\newcommand{\bvec}{\mathbf b}\) \(\newcommand{\cvec}{\mathbf c}\) \(\newcommand{\dvec}{\mathbf d}\) \(\newcommand{\dtil}{\widetilde{\mathbf d}}\) \(\newcommand{\evec}{\mathbf e}\) \(\newcommand{\fvec}{\mathbf f}\) \(\newcommand{\nvec}{\mathbf n}\) \(\newcommand{\pvec}{\mathbf p}\) \(\newcommand{\qvec}{\mathbf q}\) \(\newcommand{\svec}{\mathbf s}\) \(\newcommand{\tvec}{\mathbf t}\) \(\newcommand{\uvec}{\mathbf u}\) \(\newcommand{\vvec}{\mathbf v}\) \(\newcommand{\wvec}{\mathbf w}\) \(\newcommand{\xvec}{\mathbf x}\) \(\newcommand{\yvec}{\mathbf y}\) \(\newcommand{\zvec}{\mathbf z}\) \(\newcommand{\rvec}{\mathbf r}\) \(\newcommand{\mvec}{\mathbf m}\) \(\newcommand{\zerovec}{\mathbf 0}\) \(\newcommand{\onevec}{\mathbf 1}\) \(\newcommand{\real}{\mathbb R}\) \(\newcommand{\twovec}[2]{\left[\begin{array}{r}#1 \\ #2 \end{array}\right]}\) \(\newcommand{\ctwovec}[2]{\left[\begin{array}{c}#1 \\ #2 \end{array}\right]}\) \(\newcommand{\threevec}[3]{\left[\begin{array}{r}#1 \\ #2 \\ #3 \end{array}\right]}\) \(\newcommand{\cthreevec}[3]{\left[\begin{array}{c}#1 \\ #2 \\ #3 \end{array}\right]}\) \(\newcommand{\fourvec}[4]{\left[\begin{array}{r}#1 \\ #2 \\ #3 \\ #4 \end{array}\right]}\) \(\newcommand{\cfourvec}[4]{\left[\begin{array}{c}#1 \\ #2 \\ #3 \\ #4 \end{array}\right]}\) \(\newcommand{\fivevec}[5]{\left[\begin{array}{r}#1 \\ #2 \\ #3 \\ #4 \\ #5 \\ \end{array}\right]}\) \(\newcommand{\cfivevec}[5]{\left[\begin{array}{c}#1 \\ #2 \\ #3 \\ #4 \\ #5 \\ \end{array}\right]}\) \(\newcommand{\mattwo}[4]{\left[\begin{array}{rr}#1 \amp #2 \\ #3 \amp #4 \\ \end{array}\right]}\) \(\newcommand{\laspan}[1]{\text{Span}\{#1\}}\) \(\newcommand{\bcal}{\cal B}\) \(\newcommand{\ccal}{\cal C}\) \(\newcommand{\scal}{\cal S}\) \(\newcommand{\wcal}{\cal W}\) \(\newcommand{\ecal}{\cal E}\) \(\newcommand{\coords}[2]{\left\{#1\right\}_{#2}}\) \(\newcommand{\gray}[1]{\color{gray}{#1}}\) \(\newcommand{\lgray}[1]{\color{lightgray}{#1}}\) \(\newcommand{\rank}{\operatorname{rank}}\) \(\newcommand{\row}{\text{Row}}\) \(\newcommand{\col}{\text{Col}}\) \(\renewcommand{\row}{\text{Row}}\) \(\newcommand{\nul}{\text{Nul}}\) \(\newcommand{\var}{\text{Var}}\) \(\newcommand{\corr}{\text{corr}}\) \(\newcommand{\len}[1]{\left|#1\right|}\) \(\newcommand{\bbar}{\overline{\bvec}}\) \(\newcommand{\bhat}{\widehat{\bvec}}\) \(\newcommand{\bperp}{\bvec^\perp}\) \(\newcommand{\xhat}{\widehat{\xvec}}\) \(\newcommand{\vhat}{\widehat{\vvec}}\) \(\newcommand{\uhat}{\widehat{\uvec}}\) \(\newcommand{\what}{\widehat{\wvec}}\) \(\newcommand{\Sighat}{\widehat{\Sigma}}\) \(\newcommand{\lt}{<}\) \(\newcommand{\gt}{>}\) \(\newcommand{\amp}{&}\) \(\definecolor{fillinmathshade}{gray}{0.9}\)- Explain the purpose of using restriction enzymes to analyze plasmid DNA.
- Predict the outcome of restriction digests based on plasmid maps and insert size.
- Describe how bacterial transformation reveals phenotypic traits tied to gene expression.
- Interpret gel electrophoresis banding patterns to identify which plasmid contains the P450 gene.
- Understand why combining genotypic and phenotypic approaches increases experimental accuracy.
- Plasmid: A small, circular DNA molecule that replicates independently of the bacterial chromosome. Used as a vector to carry genes of interest.
- Restriction Enzyme: A protein that cuts DNA at specific recognition sequences. Examples: EcoRI and BamHI.
- Sticky Ends: Single-stranded overhangs produced when restriction enzymes cut DNA asymmetrically. Useful for ligating inserts.
- Blunt Ends: DNA ends with no overhangs; both strands are cut at the same position. Harder to ligate.
- Agarose Gel Electrophoresis: A technique that separates DNA fragments by size using an electric current.
- Transformation: The process of introducing plasmid DNA into bacteria (e.g., E. coli).
- Selectable Marker: A gene (often conferring antibiotic resistance) used to identify cells that have taken up a plasmid.
- Phenotypic Screening: Observing traits (e.g., color change, growth on antibiotics) in transformed bacteria to infer plasmid content.
- Why might you want to use both restriction digest and phenotypic analysis instead of just one?
- What would you expect to see on a gel if a plasmid has an insert vs. one that doesn’t?
- If a plasmid gives bacteria ampicillin resistance, what will you see on the plate after transformation?
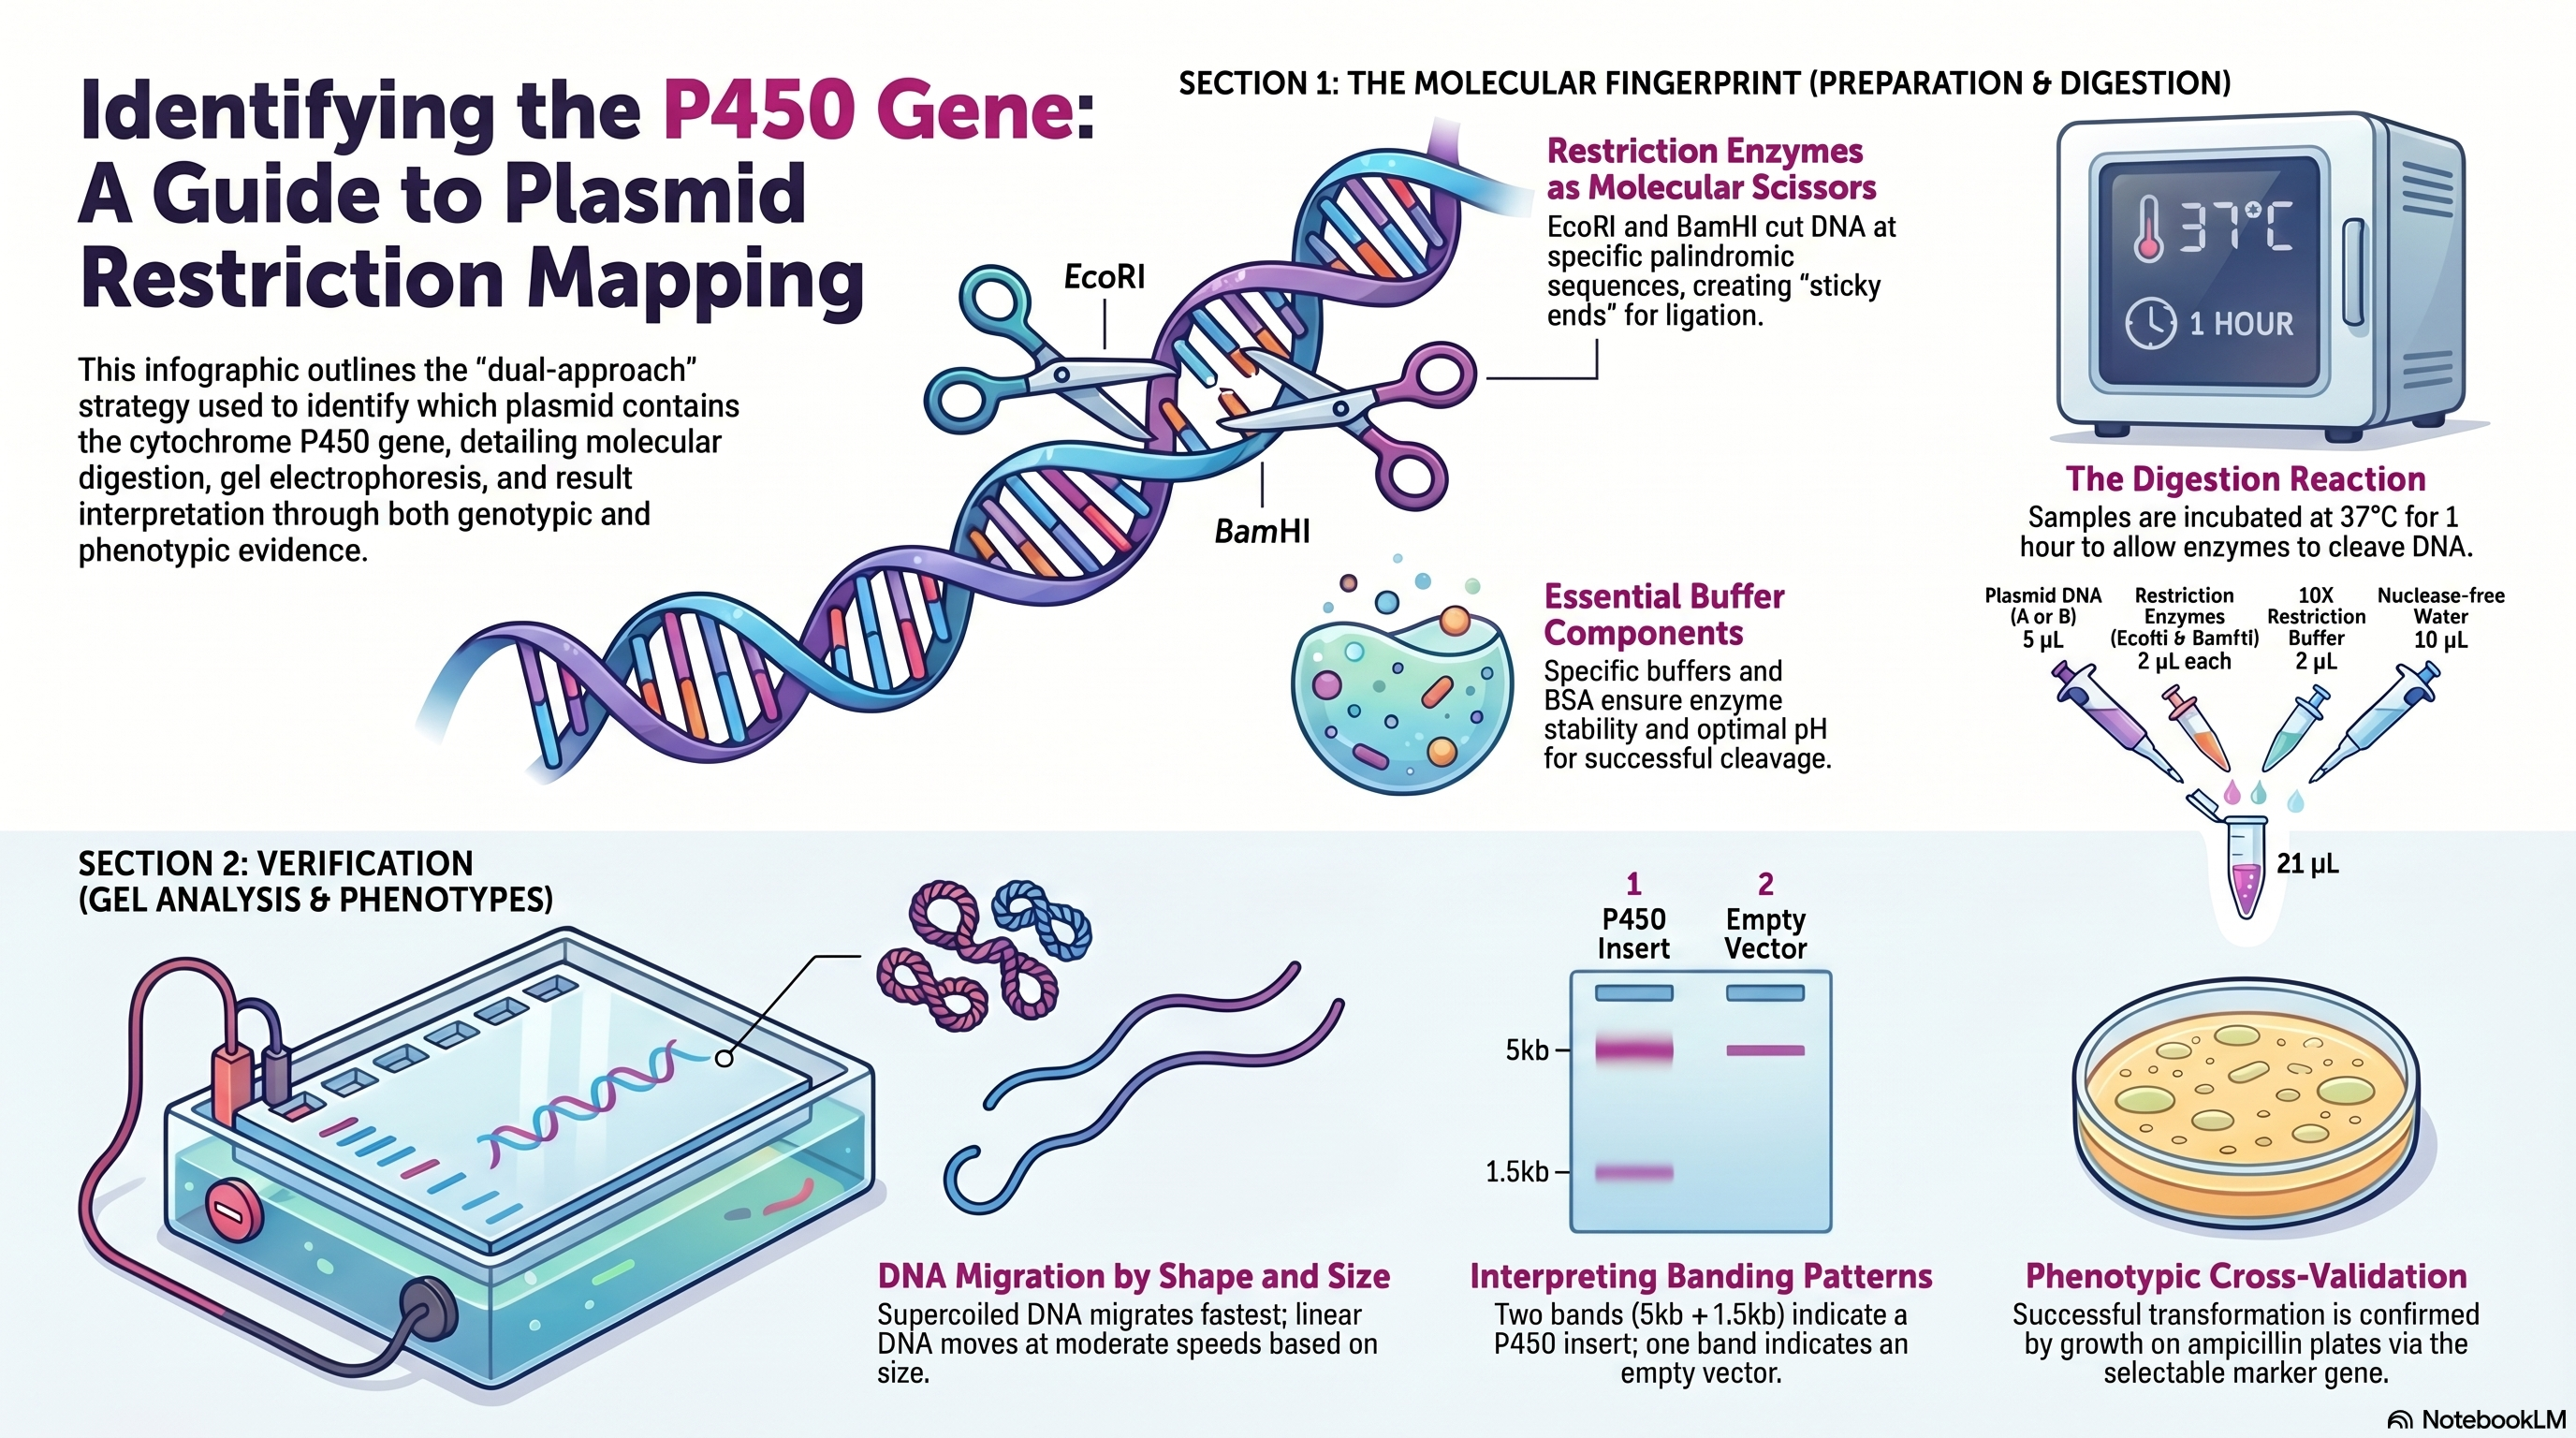
Image created by Victor Pham, Ph.D. via NotebookLM.
Abstract
This educational guide details the molecular biology techniques used to identify a specific cytochrome P450 gene within a bacterial plasmid. Researchers employ restriction enzyme digestion to cut DNA at precise sequences, creating a unique genetic "fingerprint" that is then visualized through agarose gel electrophoresis. This process separates DNA fragments based on their size and shape, allowing for the clear distinction between a plasmid containing an insert and an empty vector. To ensure scientific accuracy, the text emphasizes a dual-approach strategy that combines this genotypic mapping with phenotypic screening through bacterial transformation. By observing physical traits like antibiotic resistance or color changes in transformed E. coli, scientists can functionally confirm the presence of the target gene. Comprehensive protocols and safety measures for using fluorescent dyes and specialized laboratory equipment are also provided to guide the experimental workflow.
Identifying the P450 Plasmid
In this part of your molecular biology project, your goal is to determine which of the two plasmids contains the gene encoding cytochrome P450, an important enzyme involved in drug metabolism. To make this identification, you will use two complementary molecular techniques: (1) restriction enzyme digestion followed by gel electrophoresis, and (2) bacterial transformation followed by phenotypic observation.
Why use two approaches? In science, especially molecular biology, it's essential to confirm findings through multiple lines of evidence. Each method provides a different type of information: one gives a genotypic view (DNA content and size), while the other shows the phenotypic outcome (what traits the plasmid expresses in a living organism).
Direct DNA Analysis via Restriction Enzymes and Gel Electrophoresis
One of the most reliable ways to determine the identity of a plasmid is to use restriction enzymes to cut the plasmid DNA at specific sites. These enzymes act like molecular scissors, cutting at unique, short palindromic sequences in the DNA. Suppose you have Plasmid A and Plasmid B, and only one of them has the P450 gene inserted using EcoRI and BamHI. If you digest both plasmids with these enzymes and run the digested DNA on an agarose gel, the plasmid with the insert (let’s say Plasmid A) will show two bands: one corresponding to the vector backbone and one to the inserted P450 gene. Plasmid B, without the insert, would show only one band—the empty backbone. By comparing the pattern of DNA bands (called a restriction digest pattern) on the gel, you can infer which plasmid contains the insert. This process is known as restriction mapping.
Confirming by Phenotypic Analysis After Transformation
After digesting and analyzing the DNA, you'll use another technique: bacterial transformation. This involves introducing each plasmid into E. coli cells and observing the resulting traits. Some phenotypic traits may be directly or indirectly linked to the expression of the inserted gene. If the P450 gene is expressed under a strong promoter (like T7), and this protein causes a noticeable color change in the media or confers resistance to a certain chemical, transformed bacteria carrying the correct plasmid (pT7BM3) might show this trait. Those carrying the empty plasmid would not. Even if there’s no clear visible phenotype from the P450 itself, the plasmid may carry a selectable marker (e.g., ampicillin resistance), which ensures that only transformed bacteria grow on ampicillin-containing plates.

Genotypic vs Phenotypic View. Image created by Victor Pham, Ph.D. via NotebookLM.
Plasmids
Plasmids are small circular DNA molecules that replicate independently of the bacterial chromosome. Because of their ease of use and modifiability, plasmids are fundamental tools in molecular biology labs.
- Origin of Replication (Ori):
- The site where replication begins.
- Ensures that the plasmid is copied inside E. coli.
- Without it, the plasmid would be lost during cell division.
- Selectable Marker Gene:
- Allows you to identify which E. coli cells have successfully taken up the plasmid.
- Commonly used markers include antibiotic resistance genes.
- For example, pET3a plasmid encodes β-lactamase, an enzyme that breaks down ampicillin. Only bacteria with this plasmid will grow on ampicillin plates.
- Multiple Cloning Site (MCS):
- A short DNA region containing many restriction sites.
- Facilitates the insertion of foreign DNA (like your P450 gene).
- Example: MCS with EcoRI and BamHI allows the gene to be inserted at these specific sites.
Restriction enzymes (also called restriction endonucleases) are proteins that cut DNA at specific sequences. These enzymes are isolated from bacteria, where they originally served as a defense mechanism against viruses. Each enzyme cuts at a precise spot within or near this site. Many restriction enzymes recognize palindromes—a sequence that reads the same forwards and backwards. For instance:
- EcoRI recognizes:
5' GAATTC 3' - BamHI recognizes:
5' GGATCC 3'
There are also two different types of restriction cuts (Figure 2.2.1). One is a Sticky ends, where there is an overhanging single-stranded sequence left after cutting. These can base pair with complementary sequences. For example, EcoRI leaves sticky ends, which is useful for ligating (joining) DNA fragment. The other type is the Blunt ends, where there is no overhangs, both DNA strands end at the same position. This makes it harder to ligate, but still usable with blunt-end cloning techniques.

Anatomy of Biological Vector. Image created by Victor Pham, Ph.D. via NotebookLM.

EcoRI vs BamHI. Image created by Victor Pham, Ph.D. via NotebookLM

Figure 2.2.1: Imaging distinguishing the model differences between a blunt end cut versus a sticky end cut. Image created by Victor Pham, Ph.D.
When you cut a plasmid with restriction enzymes, you generate predictable DNA fragment sizes. These can be visualized on an agarose gel stained with a DNA dye like ethidium bromide or SYBR Safe. The pattern of bands acts like a fingerprint for that plasmid.
Plasmid A cut with EcoRI and BamHI:
- Vector backbone: 5,000 bp
- P450 insert: 1,500 bp
- → On the gel, you’ll see two bands, one at ~5 kb and another at ~1.5 kb.
Plasmid B (empty vector):
- Only 5,000 bp
- → One band at ~5 kb.
This difference confirms which plasmid contains the insert.
Components of a Restriction Digest Reaction
A standard restriction digest reaction is carefully formulated using several critical components, each serving a distinct role in ensuring successful cleavage of plasmid DNA. The primary component is the plasmid DNA, which contains the sequence of interest and serves as the target for enzymatic cleavage. To cut the DNA at specific sites, restriction enzymes are used. These enzymes recognize unique short DNA sequences—called recognition sites—and cleave the DNA precisely at those locations, allowing for structural analysis or modification of the plasmid.
The efficiency of these enzymes depends on the chemical environment, which is maintained by a specially formulated buffer. Each restriction enzyme requires a particular buffer composition that includes the optimal pH and ion concentrations for catalytic activity. To further support enzyme stability, Bovine Serum Albumin (BSA) is often included. BSA prevents the enzyme from adhering to the walls of the microcentrifuge tube and helps maintain its functional three-dimensional structure, especially in dilute reactions. Additionally, RNase is frequently added to eliminate RNA contaminants that may be present from the plasmid preparation process, ensuring that the final gel analysis is not confounded by unwanted nucleic acid bands.
Once the digestion is complete, the enzyme must be heat-inactivated—typically by raising the temperature to denature its structure—thereby stopping further enzymatic activity. Before loading the digested DNA onto an agarose gel for electrophoresis, a loading dye mixture is added. This dye contains multiple important additives. Glycerol increases the density of the sample so that it settles into the gel wells. Bromophenol blue serves as a tracking dye, migrating through the gel and allowing researchers to visually monitor DNA progression. The dye mixture also contains SDS (a detergent that denatures proteins) and EDTA (a chelating agent that binds divalent metal ions like Mg²⁺), both of which help stop any residual enzyme activity by interfering with the enzyme's structure or required cofactors.
During gel electrophoresis, different DNA conformations can behave uniquely. Supercoiled plasmids, which are tightly compacted circular forms of DNA, migrate more rapidly through the gel and appear lower than expected. This compact shape can sometimes produce smears or streaks, especially if the digestion was incomplete. In contrast, linear DNA, generated by complete restriction digestion, migrates at a consistent rate according to its size, appearing as clear bands. Nicked or relaxed DNA, which results from single-strand breaks in the plasmid, migrates more slowly and often appears as a separate band above the linear form.
To conclusively identify whether a plasmid contains your gene of interest—such as the P450 gene—it is best to use a dual-approach strategy. First, restriction digestion provides a molecular fingerprint of the plasmid by revealing the size and number of DNA fragments. This allows you to infer the presence of inserted sequences. Second, transformation and phenotypic screening in E. coli cells offer functional confirmation by showing whether the gene is expressed or confers a specific trait (e.g., antibiotic resistance or color change). By integrating both molecular and phenotypic evidence, researchers significantly increase the accuracy and reliability of their findings. This is a standard practice in molecular biology and ensures the correct identification of the P450-containing plasmid before proceeding to more advanced applications like expression studies, enzymatic assays, or protein purification.

Image of a flow chart summarizing Restriction Digestion. Image created by Dr. Victor Pham's student, Diana Valdovinos.

Mechanism of Agarose Gel. Image created by Victor Pham, Ph.D. via NotebookLM
Restriction Digest Protocol
Objective: To perform a restriction enzyme digestion of two plasmids (A and B) using EcoRI and BamHI, allowing you to determine which plasmid contains the P450 gene.
Materials Needed:
- Micropipettes and sterile tips (filter tips preferred)
- 1.5 mL microcentrifuge tubes
- Nuclease-free water (e.g., Invitrogen, #AM9906)
- Plasmid DNA samples (from previous lab – plasmid A and plasmid B)
- EcoRI restriction enzyme kit (NEB, #R0101T)
- BamHI restriction enzyme kit (NEB, #R0136T)
- 10X Restriction buffer (comes with enzyme kits)
- Water bath set to 37°C
- Water bath set to 65°C
Procedure:
- Remove the plasmid A and plasmid B tubes from the freezer and allow them to thaw completely on ice.
- Using a marker, clearly label two new 1.5 mL microcentrifuge tubes:
- One as "Plasmid A Digest"
- The other is "Plasmid B Digest"
- Into each labeled tube, add the following components in the given order. Use fresh pipette tips for each transfer to avoid contamination:
- This protocol will be for a double digestion using both EcoRI and BamHI. If you're doing a single digest, just add 2 µL of either EcoRI or BamHI, and increase the water volume to 12 µL instead of 10 µL.
- Final reaction volume: 21 µL. (Figure 2.2.2) (The buffers and reagents are added in no particular order.)
- 5 µL of plasmid DNA (either A or B)
- 2 µL of EcoRI enzyme
- 2 µL of BamHI enzyme
- 2 µL of 10X restriction buffer
- 10 µL of nuclease-free water
- Spin down your samples using a microcentrifuge machine for under 5 seconds. (This will bring all condensation and side liquid down to the bottom)
- Place your tubes into a 37°C water bath and incubate for 1 hour. This allows the enzymes to cut the DNA at their recognition sites.
- After digestion is complete, place the tubes at 65°C for 1 minute, spin down for under 5 seconds, and then store in the freezer until you're ready to load them on an agarose gel for analysis.

Figure 2.2.2: Simplified image dispicting how much volume of each reagent. Image created by Victor Pham, Ph.D.
- Setting up restriction digest reactions with proper enzyme and buffer combinations.
- Using micropipettes with sterile technique.
- Running and interpreting an agarose gel.
- Transforming bacteria and analyzing colony growth.
- Synthesizing multiple lines of evidence to draw conclusions in a molecular biology experiment.
- DNA Banding Patterns: You should be able to match your gel results to a predicted pattern based on the expected insert size (e.g., 5,000 bp for the backbone and 1,500 bp for the P450 insert).
- Genotypic Confirmation: If you see two bands on the gel, you likely have the plasmid containing the insert (P450 gene). One band likely means it's the empty vector.
- Phenotypic Confirmation: Did the transformed colonies survive on ampicillin? Did you observe any color changes or growth differences that indicate gene expression?
- Data Cross-Validation: You’ve learned that combining both approaches—genotypic (gel) and phenotypic (growth/trait)—increases your confidence in identifying the correct plasmid.
- What might cause a plasmid to appear as a smear or streak on the gel instead of clean bands?
- What are the limitations of using gel electrophoresis alone to identify the correct plasmid?
- If your transformation didn’t work, what troubleshooting steps could you take?