
7.1: Bacterial Susceptibility to Antibiotics (Kirby-Bauer Test)
- Page ID
- 126103
\( \newcommand{\vecs}[1]{\overset { \scriptstyle \rightharpoonup} {\mathbf{#1}} } \)
\( \newcommand{\vecd}[1]{\overset{-\!-\!\rightharpoonup}{\vphantom{a}\smash {#1}}} \)
\( \newcommand{\dsum}{\displaystyle\sum\limits} \)
\( \newcommand{\dint}{\displaystyle\int\limits} \)
\( \newcommand{\dlim}{\displaystyle\lim\limits} \)
\( \newcommand{\id}{\mathrm{id}}\) \( \newcommand{\Span}{\mathrm{span}}\)
( \newcommand{\kernel}{\mathrm{null}\,}\) \( \newcommand{\range}{\mathrm{range}\,}\)
\( \newcommand{\RealPart}{\mathrm{Re}}\) \( \newcommand{\ImaginaryPart}{\mathrm{Im}}\)
\( \newcommand{\Argument}{\mathrm{Arg}}\) \( \newcommand{\norm}[1]{\| #1 \|}\)
\( \newcommand{\inner}[2]{\langle #1, #2 \rangle}\)
\( \newcommand{\Span}{\mathrm{span}}\)
\( \newcommand{\id}{\mathrm{id}}\)
\( \newcommand{\Span}{\mathrm{span}}\)
\( \newcommand{\kernel}{\mathrm{null}\,}\)
\( \newcommand{\range}{\mathrm{range}\,}\)
\( \newcommand{\RealPart}{\mathrm{Re}}\)
\( \newcommand{\ImaginaryPart}{\mathrm{Im}}\)
\( \newcommand{\Argument}{\mathrm{Arg}}\)
\( \newcommand{\norm}[1]{\| #1 \|}\)
\( \newcommand{\inner}[2]{\langle #1, #2 \rangle}\)
\( \newcommand{\Span}{\mathrm{span}}\) \( \newcommand{\AA}{\unicode[.8,0]{x212B}}\)
\( \newcommand{\vectorA}[1]{\vec{#1}} % arrow\)
\( \newcommand{\vectorAt}[1]{\vec{\text{#1}}} % arrow\)
\( \newcommand{\vectorB}[1]{\overset { \scriptstyle \rightharpoonup} {\mathbf{#1}} } \)
\( \newcommand{\vectorC}[1]{\textbf{#1}} \)
\( \newcommand{\vectorD}[1]{\overrightarrow{#1}} \)
\( \newcommand{\vectorDt}[1]{\overrightarrow{\text{#1}}} \)
\( \newcommand{\vectE}[1]{\overset{-\!-\!\rightharpoonup}{\vphantom{a}\smash{\mathbf {#1}}}} \)
\( \newcommand{\vecs}[1]{\overset { \scriptstyle \rightharpoonup} {\mathbf{#1}} } \)
\(\newcommand{\longvect}{\overrightarrow}\)
\( \newcommand{\vecd}[1]{\overset{-\!-\!\rightharpoonup}{\vphantom{a}\smash {#1}}} \)
\(\newcommand{\avec}{\mathbf a}\) \(\newcommand{\bvec}{\mathbf b}\) \(\newcommand{\cvec}{\mathbf c}\) \(\newcommand{\dvec}{\mathbf d}\) \(\newcommand{\dtil}{\widetilde{\mathbf d}}\) \(\newcommand{\evec}{\mathbf e}\) \(\newcommand{\fvec}{\mathbf f}\) \(\newcommand{\nvec}{\mathbf n}\) \(\newcommand{\pvec}{\mathbf p}\) \(\newcommand{\qvec}{\mathbf q}\) \(\newcommand{\svec}{\mathbf s}\) \(\newcommand{\tvec}{\mathbf t}\) \(\newcommand{\uvec}{\mathbf u}\) \(\newcommand{\vvec}{\mathbf v}\) \(\newcommand{\wvec}{\mathbf w}\) \(\newcommand{\xvec}{\mathbf x}\) \(\newcommand{\yvec}{\mathbf y}\) \(\newcommand{\zvec}{\mathbf z}\) \(\newcommand{\rvec}{\mathbf r}\) \(\newcommand{\mvec}{\mathbf m}\) \(\newcommand{\zerovec}{\mathbf 0}\) \(\newcommand{\onevec}{\mathbf 1}\) \(\newcommand{\real}{\mathbb R}\) \(\newcommand{\twovec}[2]{\left[\begin{array}{r}#1 \\ #2 \end{array}\right]}\) \(\newcommand{\ctwovec}[2]{\left[\begin{array}{c}#1 \\ #2 \end{array}\right]}\) \(\newcommand{\threevec}[3]{\left[\begin{array}{r}#1 \\ #2 \\ #3 \end{array}\right]}\) \(\newcommand{\cthreevec}[3]{\left[\begin{array}{c}#1 \\ #2 \\ #3 \end{array}\right]}\) \(\newcommand{\fourvec}[4]{\left[\begin{array}{r}#1 \\ #2 \\ #3 \\ #4 \end{array}\right]}\) \(\newcommand{\cfourvec}[4]{\left[\begin{array}{c}#1 \\ #2 \\ #3 \\ #4 \end{array}\right]}\) \(\newcommand{\fivevec}[5]{\left[\begin{array}{r}#1 \\ #2 \\ #3 \\ #4 \\ #5 \\ \end{array}\right]}\) \(\newcommand{\cfivevec}[5]{\left[\begin{array}{c}#1 \\ #2 \\ #3 \\ #4 \\ #5 \\ \end{array}\right]}\) \(\newcommand{\mattwo}[4]{\left[\begin{array}{rr}#1 \amp #2 \\ #3 \amp #4 \\ \end{array}\right]}\) \(\newcommand{\laspan}[1]{\text{Span}\{#1\}}\) \(\newcommand{\bcal}{\cal B}\) \(\newcommand{\ccal}{\cal C}\) \(\newcommand{\scal}{\cal S}\) \(\newcommand{\wcal}{\cal W}\) \(\newcommand{\ecal}{\cal E}\) \(\newcommand{\coords}[2]{\left\{#1\right\}_{#2}}\) \(\newcommand{\gray}[1]{\color{gray}{#1}}\) \(\newcommand{\lgray}[1]{\color{lightgray}{#1}}\) \(\newcommand{\rank}{\operatorname{rank}}\) \(\newcommand{\row}{\text{Row}}\) \(\newcommand{\col}{\text{Col}}\) \(\renewcommand{\row}{\text{Row}}\) \(\newcommand{\nul}{\text{Nul}}\) \(\newcommand{\var}{\text{Var}}\) \(\newcommand{\corr}{\text{corr}}\) \(\newcommand{\len}[1]{\left|#1\right|}\) \(\newcommand{\bbar}{\overline{\bvec}}\) \(\newcommand{\bhat}{\widehat{\bvec}}\) \(\newcommand{\bperp}{\bvec^\perp}\) \(\newcommand{\xhat}{\widehat{\xvec}}\) \(\newcommand{\vhat}{\widehat{\vvec}}\) \(\newcommand{\uhat}{\widehat{\uvec}}\) \(\newcommand{\what}{\widehat{\wvec}}\) \(\newcommand{\Sighat}{\widehat{\Sigma}}\) \(\newcommand{\lt}{<}\) \(\newcommand{\gt}{>}\) \(\newcommand{\amp}{&}\) \(\definecolor{fillinmathshade}{gray}{0.9}\)- Define "antibiotic" and differentiate between broad-spectrum and narrow-spectrum antibiotics.
- Explain the purpose of the Kirby-Bauer test.
- Define "zone of inhibition."
- Interpret zone of inhibition results to determine the susceptibility or resistance of bacterial isolates to specific antibiotics.
- Apply knowledge of bacterial growth and diffusion patterns to interpret zone sizes and make informed decisions regarding antibiotic effectiveness.
- Describe the clinical significance of antibiotic susceptibility testing in guiding appropriate antimicrobial therapy.
- Discuss why antibiotic resistance is a threat.
Introduction to Antibiotics
Antibiotics are chemicals produced by certain bacteria and fungi that can inhibit bacterial growth. Since World War II, the discovery of antibiotics has been crucial in treating infections. By studying these natural chemicals, scientists have developed other antimicrobial agents, either completely synthesized in the lab (synthetic) or partly derived from natural sources and modified in the lab (semisynthetic).
Numerous microbes can produce antibiotics, but four key genera are the source of most antibiotics used to treat infections in humans and animals. The bacterial genera Bacillus and Streptomyces, along with the fungal genera Penicillium and Cephalosporium, are particularly significant. With the rise of microbial resistance, creating new antibiotics remains a persistent challenge.
The spectrum of activity of an antibiotic refers to the range of bacteria it can eliminate. Narrow-spectrum antibiotics are effective against either Gram-positive or Gram-negative bacteria, while broad-spectrum antibiotics target a wide variety of bacteria. However, broad-spectrum antibiotics contribute to the rising problem of drug resistance in microorganisms. These antibiotics can also disrupt a patient’s normal microbiome, leading to superinfections from organisms like Candida albicans and Clostridium difficile, which proliferate when they no longer have to compete with the normal microbiota.
Empiric therapy involves prescribing an antimicrobial agent without first conducting diagnostic tests, such as a culture, to identify the specific cause of infection. This approach is used when the pathogen is likely known and diagnostic tests wouldn’t change the treatment plan. Such therapy typically involves broad-spectrum antibiotics to cover a wide range of potential pathogens. This method is often employed for conditions like strep throat, pneumonia, urinary tract infections, and suspected bacterial meningitis.
However, physicians are increasingly opting for narrow-spectrum antibiotics to target infections more precisely. For instance, Isoniazid is a narrow-spectrum antibiotic used to treat tuberculosis caused by Mycobacterium tuberculosis. Clinical microbiologists play a key role in helping physicians select the most effective antimicrobial agent for a patient’s infection. One commonly used method to determine this is the Kirby-Bauer Test.
Kirby-Bauer Test
The results of the Kirby-Bauer test provide an accurate prediction of which antibiotics are likely to be effective against the pathogen. Because the Kirby-Bauer test is relatively simple to perform and is inexpensive, it has been extensively used in medical practice. The results are reported as S (sensitive [i.e., susceptible]), I (intermediate), and R (resistant) to an antibiotic. A sensitive result indicates the bacteria will die when exposed to the antibiotic. An intermediate result indicates the antibiotic must be used in combination with another antibiotic to clear the infection or given at a higher dosage over a longer period. A resistant result indicates the antibiotic does not kill the bacteria.
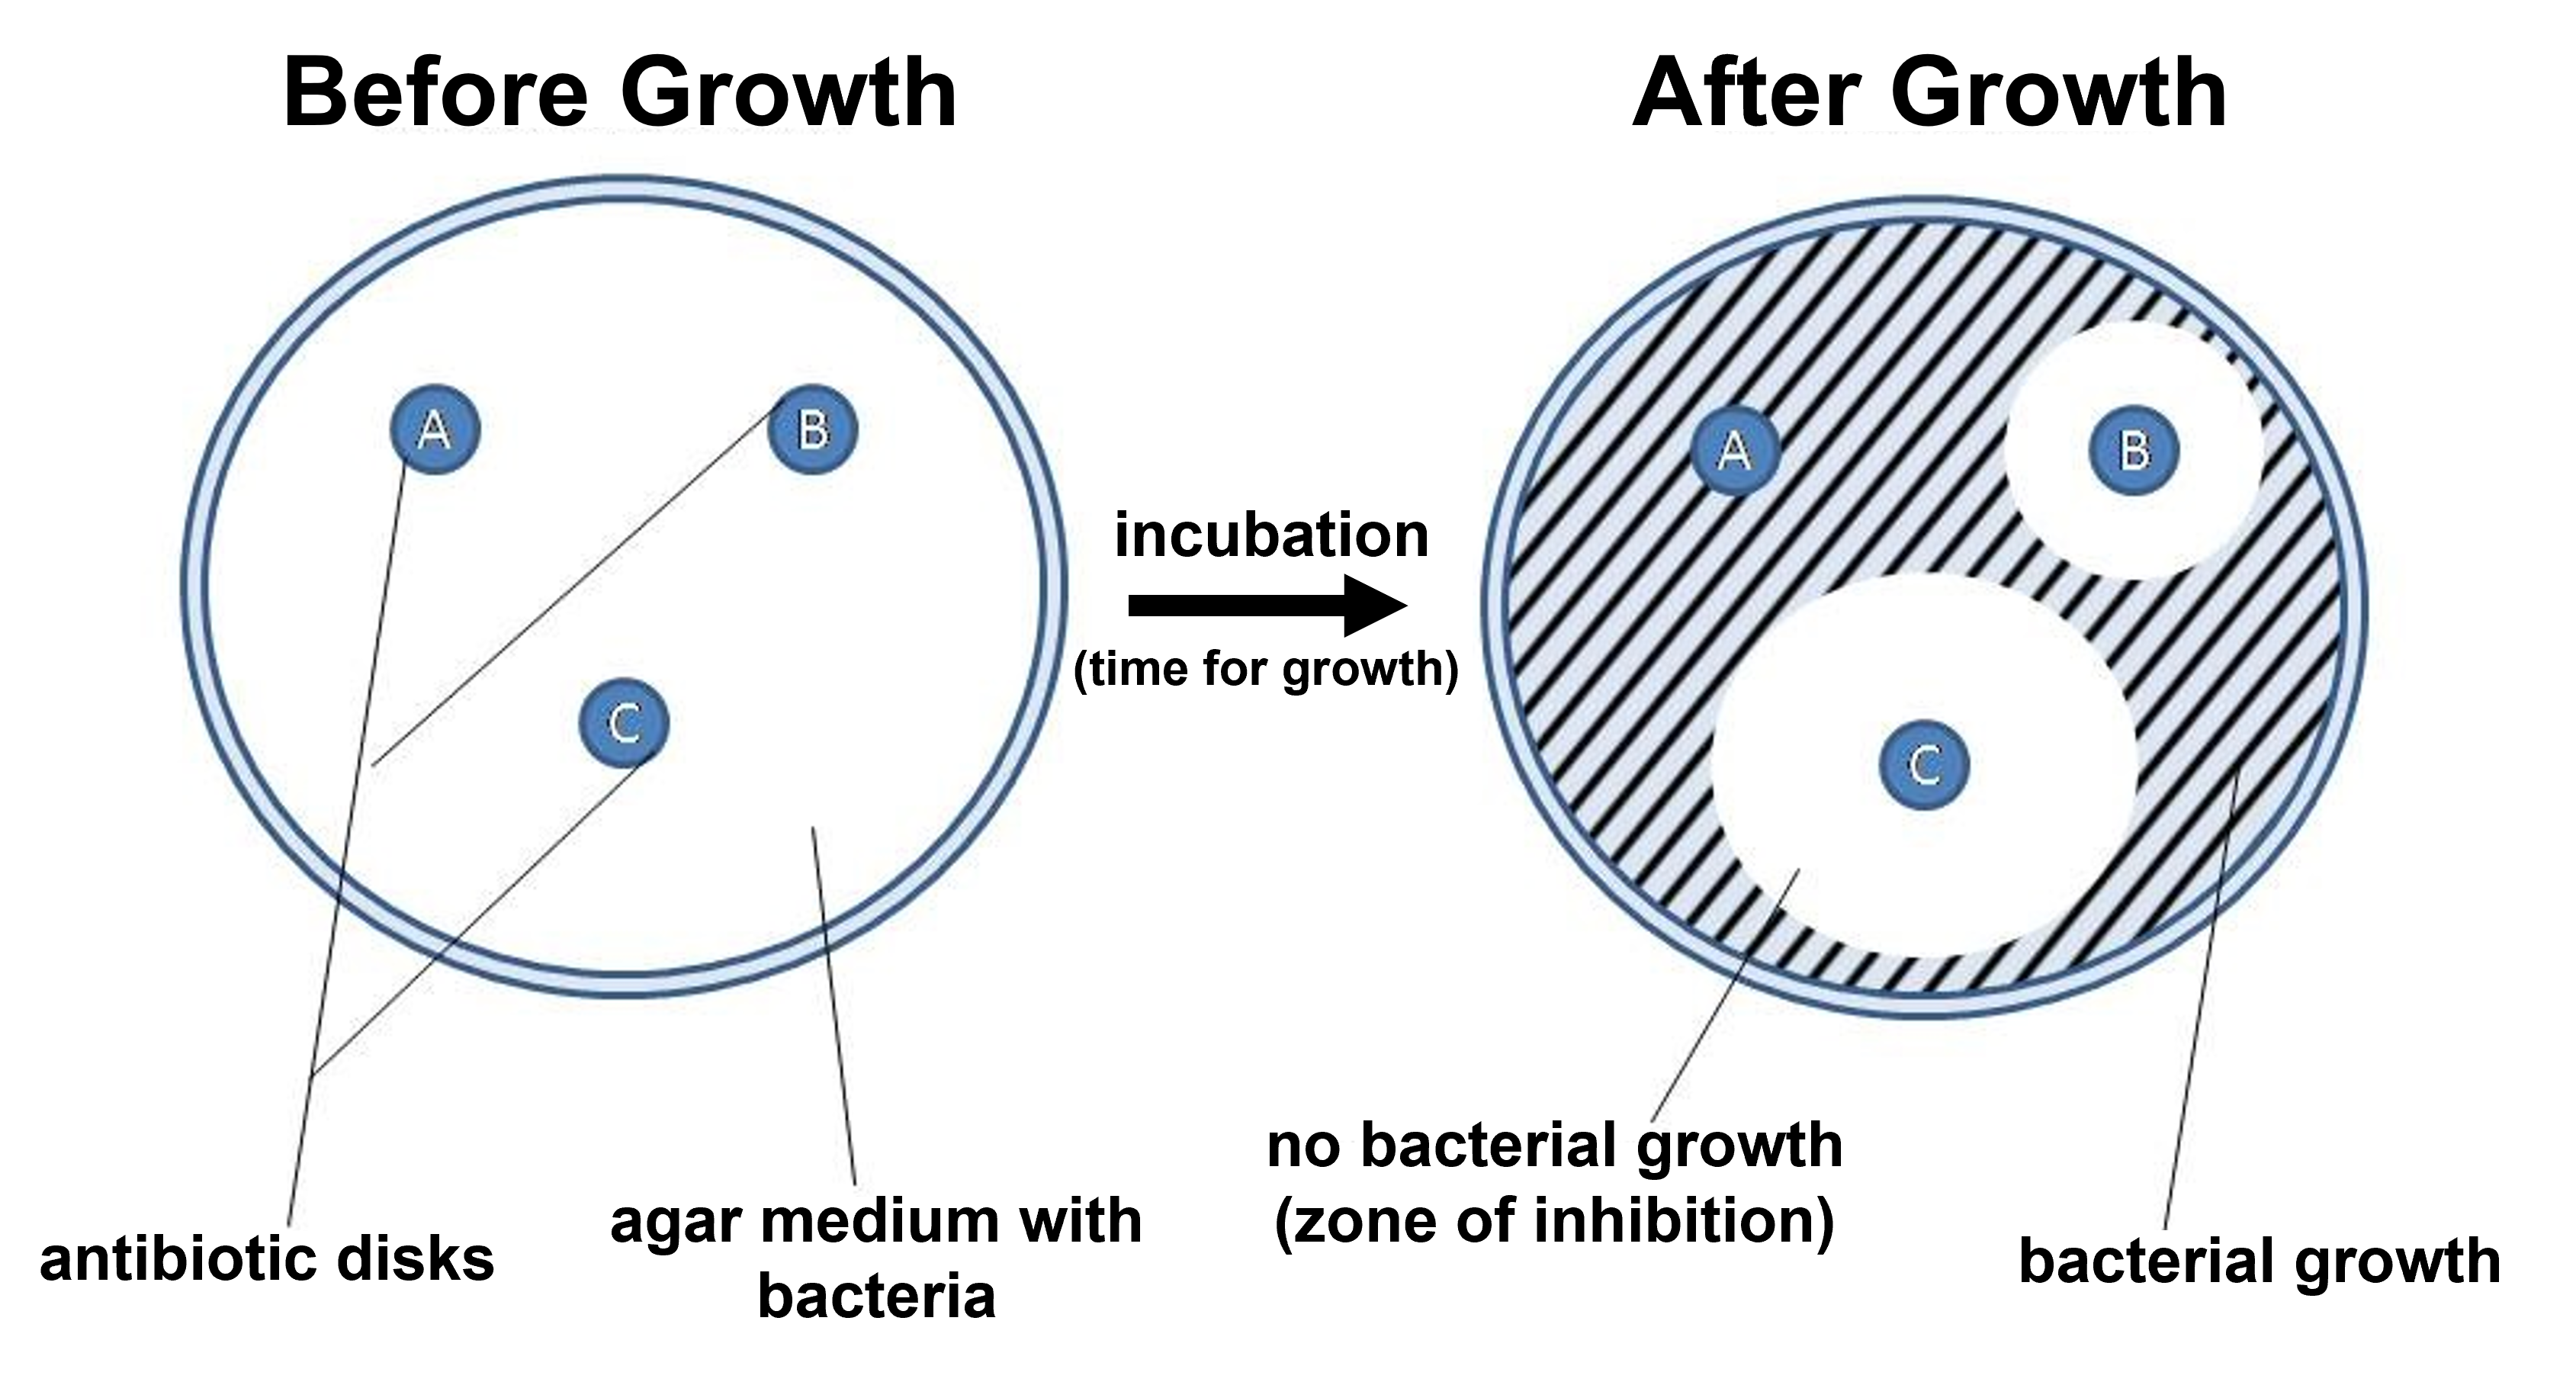
Figure 1: A summary diagram showing how the Kirby-Bauer approach works. A Petri plate with Mueller Hinton agar is spread with the bacteria being tested. Antibiotic disks are placed on the agar. After incubation, zones of inhibition will occur surrounding the antibiotic disks based on the bacteria's sensitivity to the antibiotics tested. The zone of inhibition is a region where no bacterial growth occurred since it was inhibited/killed by the concentration of antibiotic present on the Petri plate at that location (based on the diffusion of the antibiotic away from the antibiotic disk).
Petri plates with Mueller Hinton agar are used to test bacterial sensitivity to antibiotics. After spreading the bacteria across the entire surface of the plate (a process called creating a bacterial lawn), small disks containing various antibiotics are placed at spaced intervals 4-5 cm apart. Each antibiotic diffuses outward from its disk, forming a concentration gradient with the highest concentration nearest the disk and decreasing concentrations further away. Depending on the bacteria's sensitivity to each antibiotic, growth will be inhibited at specific concentrations. Bacteria able to grow close to the disk, where concentrations are highest, are more resistant to that antibiotic. In contrast, bacteria that can only grow farther away, where concentrations are lower, are more susceptible. The size of the zone of inhibition—an area around the disk where no bacterial growth occurs—indicates whether the bacteria are sensitive, intermediate, or resistant to the antibiotic.
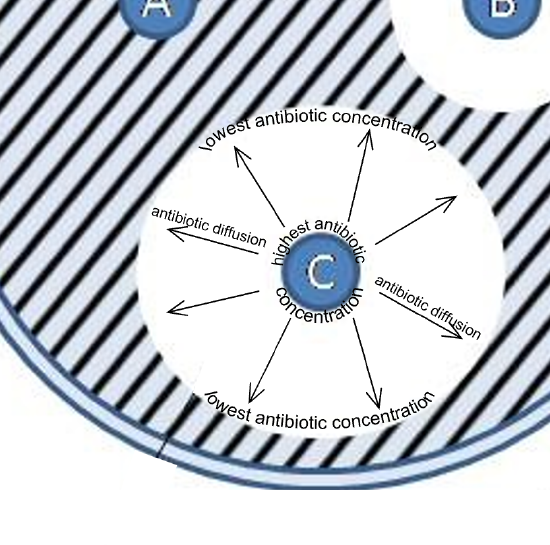
Figure 2: A closer look at antibiotic diffusion and how this produces zones of inhibition. Closest to the antibiotic disk is the highest antibiotic concentration and the antibiotic diffuses outward to produce a concentration gradient of antibiotic. The further from the antibiotic disk, the lower the antibiotic concentration. This approach enables a quick way of seeing a spectrum of antibiotic concentrations and how this impacts the inhibition of bacterial species/strains being tested.
The Kirby-Bauer test must be carefully controlled to ensure accurate interpretation of the results. Factors such as antibiotic stability, diffusion rate, the type of bacteria tested, the pH and depth of the culture medium, inoculum density, incubation time, temperature, and antibiotic concentration can all influence the outcome. However, when the Kirby-Bauer test is conducted under standardized conditions (using Mueller-Hinton agar inoculated with a pure culture at the correct turbidity matching the McFarland 0.5 standard, for example) and interpreted according to the Interpretative Zone Standards from the National Committee for Clinical Laboratory Standards, it provides reliable data. In this lab, a simplified, non-standardized version of the Kirby-Bauer test will be used to help you understand the basic principles of the procedure.
Antibiograms: Taking Some of the Guesswork Out of Prescriptions
Unfortunately, infectious diseases don’t take a time-out for lab work. As a result, physicians rarely have the luxury of conducting susceptibility testing before they write a prescription. Instead, they rely primarily on the empirical evidence (i.e., the signs and symptoms of disease) and their professional experience to make an educated guess as to the diagnosis, causative agent(s), and drug most likely to be effective. This approach allows treatment to begin sooner so the patient does not have to wait for lab test results. In many cases, the prescription is effective; however, in an age of increased antimicrobial resistance, it is becoming increasingly more difficult to select the most appropriate empiric therapy. Selecting an inappropriate empiric therapy not only puts the patient at risk but may promote greater resistance to the drug prescribed.
Recently, studies have shown that antibiograms are useful tools in the decision-making process of selecting appropriate empiric therapy. An antibiogram is a compilation of local antibiotic susceptibility data broken down by bacterial pathogen. In a November 2014 study published in the journal Infection Control and Hospital Epidemiology, researchers determined that 85% of the prescriptions ordered in skilled nursing facilities were decided upon empirically, but only 35% of those prescriptions were deemed appropriate when compared with the eventual pathogen identification and susceptibility profile obtained from the clinical laboratory. However, in one nursing facility where use of antibiograms was implemented to direct selection of empiric therapy, appropriateness of empiric therapy increased from 32% before antibiogram implementation to 45% after implementation of antibiograms.25 Although these data are preliminary, they do suggest that health-care facilities can reduce the number of inappropriate prescriptions by using antibiograms to select empiric therapy, thus benefiting patients and minimizing opportunities for antimicrobial resistance to develop.
Laboratory Instructions
Kirby-Bauer Test for Antibiotic Sensitivity
- Label one Mueller Hinton agar (MHA) plate with your group name, the bacterial species, course section, and date. Using a sterile cotton swab, collect an inoculum from the culture provided by your instructor. Be sure to use the lid as a shield to prevent airborne contamination.
- Inoculate the MHA plate by evenly spreading the sample across the entire agar surface to create a bacterial lawn.
-
Using tweezers and antibiotic dispensers, gently place four antibiotic disks onto the plate. Do not press the disks into the agar or move them once placed. Ensure proper spacing between the disks (4-5 cm).The available antibiotics are:
- Penicillin (P10) 10 Units
- Trimethoprim (SXT) 1.25 µg
- Ciprofloxacin (CIP5) 5 µg
- Chloramphenicol (C30) 30 µg
- Tetracycline (TE30) 30 µg
- Erythromycin (E15) 15 µg
4. Place the Petri plates in the incubator without inverting them. After 24-48 hours of incubation, measure the zones of inhibition in millimeters and record the results in the results table. Refer to the interpretation table to determine whether the bacterial strain is susceptible, intermediate, or resistant to each antibiotic based on the zone of inhibition size.
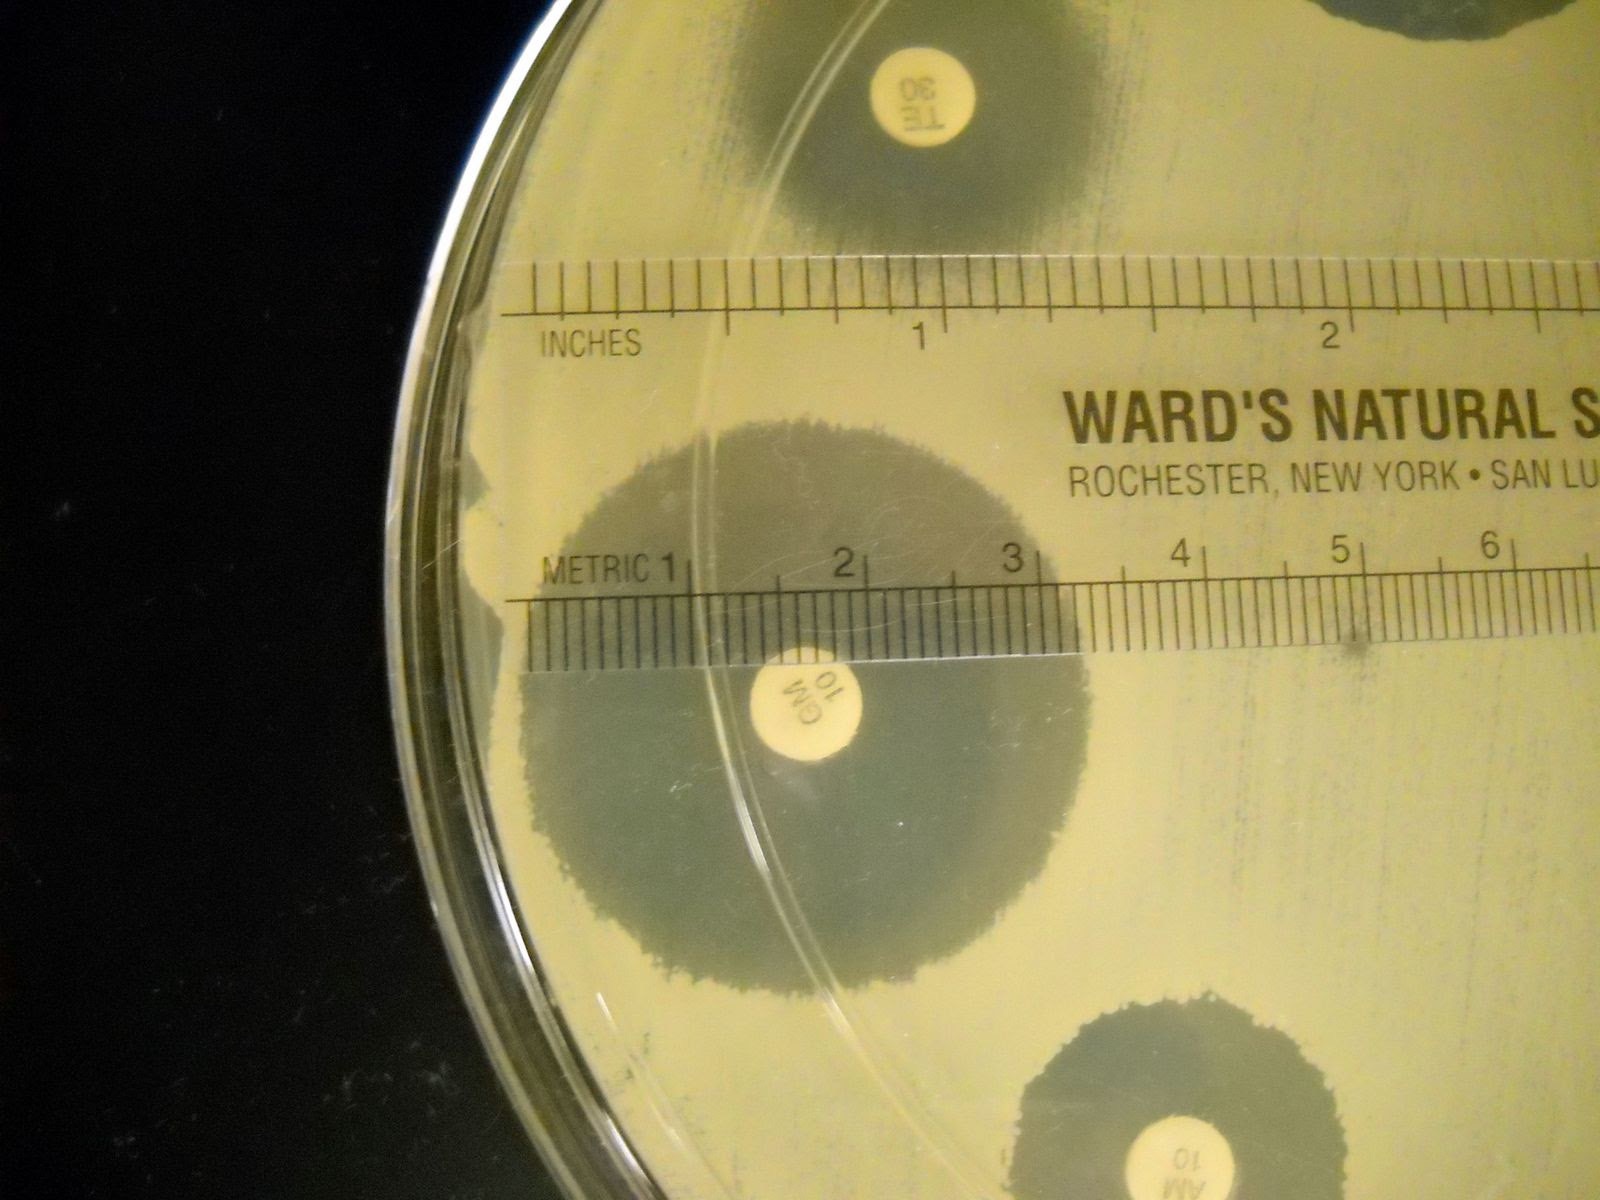
Figure 3: Example of how to measure the diameter of a zone of inhibition in mm. The example shown here has a zone of inhibition with a diameter of 32 mm.
| Antibiotic Disk Abbreviation | Antibiotic Name | Antibiotic Disk Concentration |
Resistant (mm) |
Intermediate (mm) |
Susceptible (mm) |
| E15 | Erythromycin | 15 µg | 13 or less | 14 – 22 | 23 or more |
| CIP5 | Ciprofloxacin | 5µg | 15 or less | 16 - 20 | 21 or more |
| SXT | Trimethoprim | 1.25µg | 10 or less | 11 - 15 | 16 or more |
| P10 |
Penicillin (Staphylococcus) |
10 U | 28 or less | N/A | 29 or more |
| P10 |
Penicillin (other bacteria) |
10 U | 14 or less | 15 or more | |
| C30 | Chloramphenicol | 30 µg | 12 or less | 13 – 17 | 18 or more |
| TE30 | Tetracycline | 30 µg | 14 or less | 15 – 18 | 19 or more |
Attributions
- Agar Diffusion Method 1.jpg by Sommer36 is licensed under CC BY-SA 4.0
- Testing the Effectiveness of Antimicrobials by OpenStax is licensed under Creative Commons Attribution License. Access for free at https://openstax.org/books/microbiology/pages/1-introduction)
- Red Mountain Microbiology by Jill Raymond Ph.D.; Graham Boorse, Ph.D.; and Anne Mason M.S. is licensed under CC BY-NC 4.0
Citations
- J.P. Furuno et al. “Using Antibiograms to Improve Antibiotic Prescribing in Skilled Nursing Facilities.” Infection Control and Hospital Epidemiology 35 no. Suppl S3 (2014):S56–61.