
2.2: Water (Hydrologic) Cycle
- Page ID
- 78822
Water is essential for all living processes. The human body is more than one-half water and human cells are more than 70 percent water. Water is also the only substance that occurs naturally on earth in three forms: solid, liquid and gas. Of the stores of water on Earth, 97.5 percent is salt water (Figure \(\PageIndex{1}\)). Of the remaining water, 99 percent is locked as underground water or ice. Ice caps and glaciers are the largest reservoirs of fresh water but this water is inconveniently located, mostly in Antarctica and Greenland. Shallow groundwater is the largest reservoir of usable fresh water. Less than one percent of fresh water is present in lakes and rivers, the most heavily used water resource.
Many organisms are dependent on this small amount of surface fresh water supply, a lack of which can have important effects on ecosystem dynamics. If all of world's water was shrunk to the size of 1 gallon, then the total amount of fresh water would be about 1/3 cup, and the amount of readily usable fresh water would be 2 tablespoons.
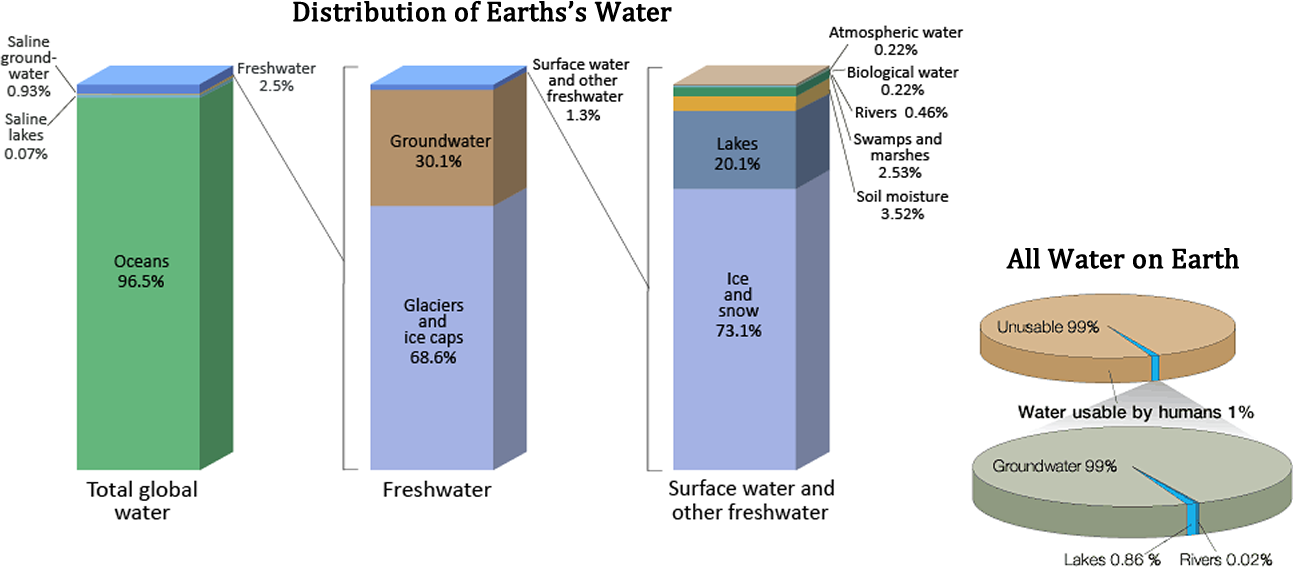
Figure \(\PageIndex{1}\): Earth's Water Reservoirs -- Bar chart Distribution of Earth’s water including total global water, fresh water, and surface water and other fresh water and Pie chart Water usable by humans and sources of usable water. Source: United States Geographical Survey Igor Skiklomanov's chapter "World fresh water resources" in Peter H. Gleick (editor), 1993, Water in Crisis: A Guide to the World's Fresh Water Resources
Water Reservoirs
The hydrosphere is the area of Earth where water movement and water storage occurs. Water reservoirs are the locations where water is stored. (Note that this term can also refer to artificial lakes created by dams.) Water is found as a liquid on the surface (rivers, lakes, oceans) and beneath the surface (groundwater), as ice (polar ice caps and glaciers), and as water vapor in the atmosphere. Figure \(\PageIndex{2}\) illustrates the average time that an individual water molecule may spend in the Earth’s major water reservoirs. Residence time is a measure of the average time an individual water molecule stays in a particular reservoir.
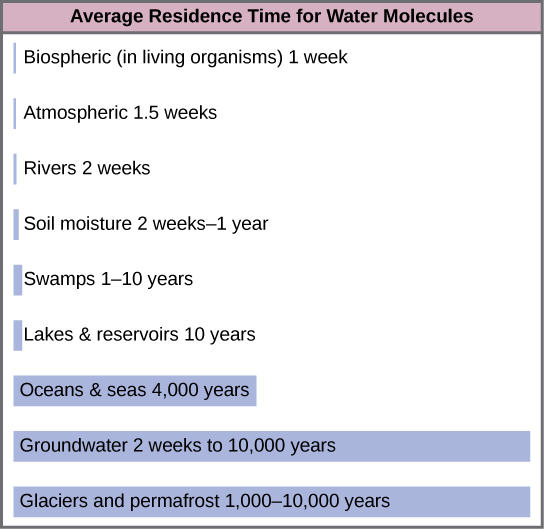
Figure \(\PageIndex{2}\): Average residence time that water remains in each reservoir. Image from OpenStax is licensed under CC-BY.
The Water Cycle
The various processes that occur during the cycling of water are illustrated in Figure \(\PageIndex{3}\). The processes include the following:
- evaporation and sublimation
- transpiration
- condensation and precipitation
- infiltration and subsurface water flow (groundwater discharge)
- surface runoff and snowmelt
- streamflow
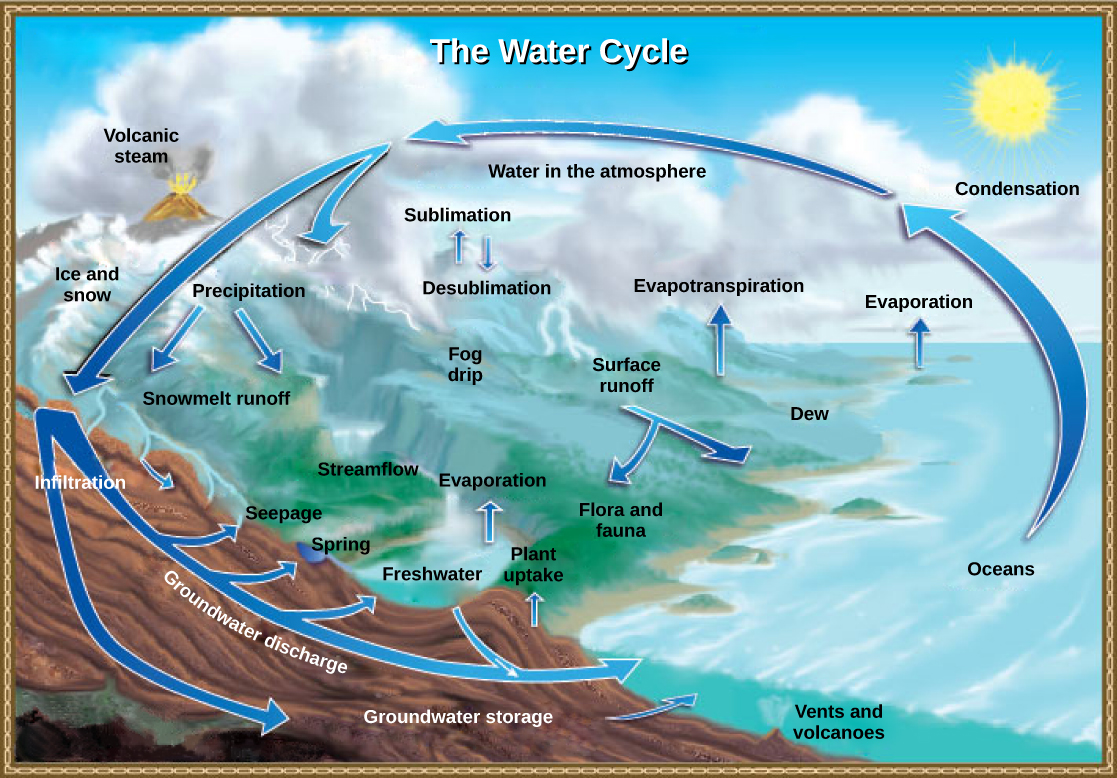
Figure \(\PageIndex{3}\): Water from the land and oceans enters the atmosphere by evaporation or sublimation, where it condenses into clouds and falls as rain or snow. Precipitated water may enter freshwater bodies or infiltrate the soil. The cycle is complete when surface or groundwater reenters the ocean. (credit: modification of work by John M. Evans and Howard Perlman, USGS)
The water cycle is driven by the Sun’s energy as it warms the oceans and other surface waters. This leads to evaporation (water to water vapor) of liquid surface water and sublimation (ice to water vapor) of frozen water, thus moving large amounts of water into the atmosphere as water vapor. As the water vapor rises in the atmosphere, it cools and condenses. Condensation is the process in which water vapor changes to tiny droplets of liquid water. Over time, this water vapor condenses into clouds as liquid or frozen droplets and eventually leads to precipitation (rain or snow), which returns water to Earth’s surface. Most precipitation falls into the ocean. Some frozen precipitation becomes part of ice caps and glaciers. These masses of ice can store frozen water for hundreds of years or longer. Rain reaching Earth’s surface may evaporate again, flow over the surface, or percolate into the ground. Most easily observed is surface runoff: the flow of fresh water either from rain or melting ice. Runoff can make its way through streams and lakes to the oceans or flow directly to the oceans themselves.
In most natural terrestrial environments rain encounters vegetation before it reaches the soil surface. A significant percentage of water evaporates immediately from the surfaces of plants. What is left reaches the soil and begins to move down. Surface runoff will occur only if the soil becomes saturated with water in a heavy rainfall. Infiltration is the process through which water sinks into the ground and is determined by the soil or rock type through which water moves. Soil texture (particle size) is an important control on water movement. Most water in the soil will be taken up by plant roots. Water enters the vascular system of the plant through the roots and evaporates, or transpires, through the stomata of the leaves. The plant will use some of this water for its own metabolism, and some of that will find its way into animals that eat the plants, but much of it will be lost back to the atmosphere through a process known as evapotranspiration. Water in the soil that is not taken up by a plant and that does not evaporate is able to percolate into the subsoil and bedrock. Here it forms groundwater.
Groundwater is a significant reservoir of fresh water. It exists in the pore spaces between particles in sand and gravel, or in the fissures in rocks. Shallow groundwater flows slowly through these pore spaces and fissures and eventually finds its way to a stream or lake where it becomes a part of the surface water again. Streams do not flow because they are replenished from rainwater directly; they flow because there is a constant inflow from groundwater below. Some groundwater is found very deep in the bedrock and can persist there for millennia. Most groundwater reservoirs, or aquifers, are the source of drinking or irrigation water drawn up through wells. In many cases these aquifers are being depleted faster than they are being replenished by water percolating down from above.
An important part of the water cycle is how water varies in salinity, which is the abundance of dissolved ions in water. Freshwater (such as lakes, rivers, and near-surface groundwater) has a relatively low salinity. The saltwater in the oceans is highly saline, with about 35,000 mg of dissolved ions per liter of seawater. Evaporation is a distillation process that produces nearly pure water with almost no dissolved ions. As water vaporizes, it leaves the dissolved ions in the original liquid phase. Eventually, condensation forms clouds and sometimes precipitation. After rainwater falls onto land, it dissolves minerals in rock and soil, which increases its salinity. Rain and surface runoff are major ways in which minerals, including phosphorus and sulfur, are cycled from land to water.
Precipitation Patterns
Rain and surface runoff are major ways in which minerals, including carbon, nitrogen, phosphorus, and sulfur, are cycled from land to water. More precipitation falls near the equator, and landmasses there are characterized by a tropical rainforest climate (Figure \(\PageIndex{4}\)). Less precipitation tends to fall near 20–30° north and south latitude, where the world’s largest deserts are located. These rainfall and climate patterns are related to global wind circulation cells. The intense sunlight at the equator heats air, causing it to rise and cool, which decreases the ability of the air mass to hold water vapor and results in frequent rainstorms. Around 30° north and south latitude, descending air conditions produce warmer air, which increases its ability to hold water vapor and results in dry conditions. Both the dry air conditions and the warm temperatures of these latitude belts favor evaporation. Global precipitation and climate patterns are also affected by the size of continents, major ocean currents, and mountains.

Figure \(\PageIndex{4}\): World Rainfall Map -- The false-color map above shows the amount of rain that falls around the world. Areas of high rainfall include Central and South America, western Africa, and Southeast Asia. Since these areas receive so much rainfall, they are where most of the world's rainforests grow. Areas with very little rainfall usually turn into deserts. The desert areas include North Africa, the Middle East, western North America, and Central Asia. Source: United States Geological Survey Earth Forum, Houston Museum Natural Science.
In the United States, the 100th Meridian roughly marks the boundary between the humid and arid parts of the country (figure \(\PageIndex{5}\)). Irrigation is required to grow crops west of the 100th Meridian. In the West, surface water is stored in reservoirs (artificial lakes) and mountain snowpacks and strategically released through a system of canals during times of high use.
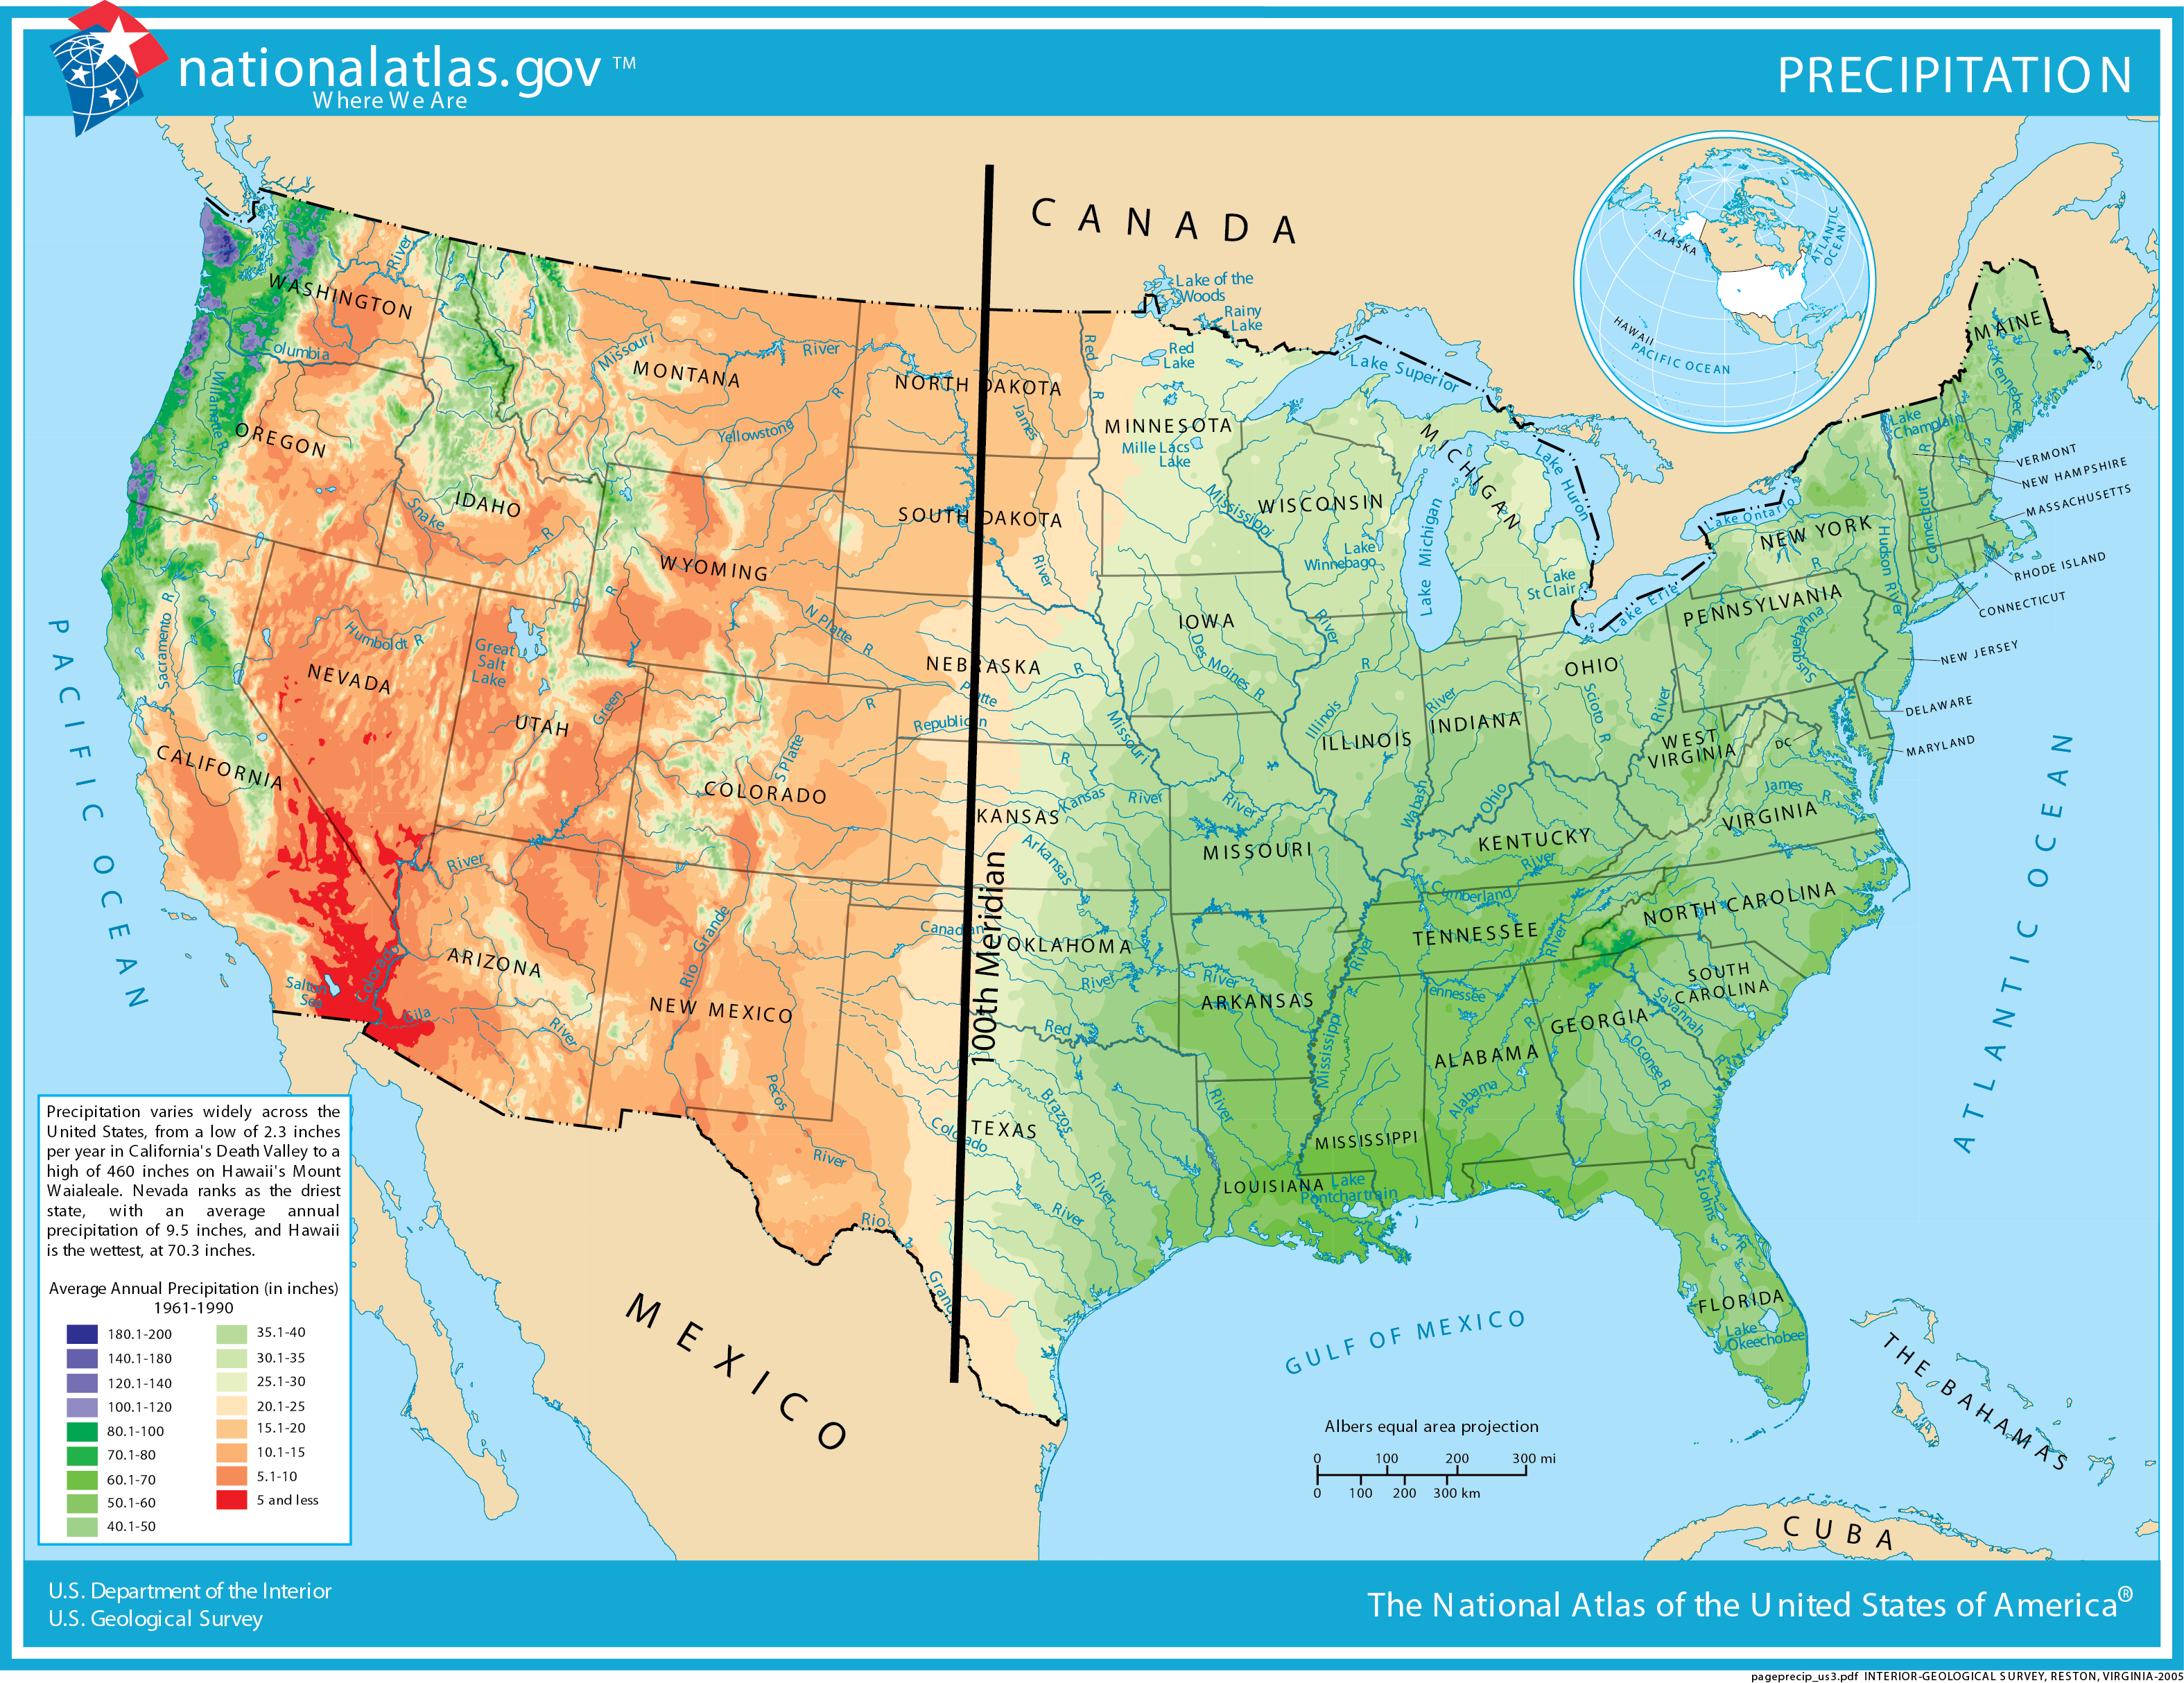
Figure \(\PageIndex{5}\): Distribution of precipitation in the United States. The 100th Meridian is approximately where the average precipitation transitions from relatively wet to dry. Eastern states are mostly green, indicating greater precipitation than most western states, which are mainly orange or red (indicating low precipitation). (Source: U.S. Geological Survey).
Further "Reading"
The steps of the water cycle are also explained in the video below.
For more information on the water cycle you might want to watch this water cycle video from USGS.
Contributors and Attributions
Modified by Kyle Whittinghill and Melissa Ha from the following sources
Samantha Fowler (Clayton State University), Rebecca Roush (Sandhills Community College), James Wise (Hampton University). Original content by OpenStax (CC BY 4.0; Access for free at https://cnx.org/contents/b3c1e1d2-83...4-e119a8aafbdd).
20.2: Biogeochemical Cycles by OpenStax, is licensed CC BY from Biology 2e by OpenStax (CC-BY). Access for free at openstax.org.- 6.6: Water Cycle by CK-12: Biology Concepts, is licensed CC BY-NC
- Biogeochemical Cycles and the Flow of Energy in the Earth System and Water Cycle and Fresh Water Supply from Sustainability: A Comprehensive Foundation by Tom Theis and Jonathan Tomkin, Editors (licensed under CC-BY). Download for free at CNX.
- Water Cycle and Fresh Water Supply, Water Supply Problems and Solutions, and Biogeochemical Cycles from Environmental Biology by Matthew R. Fisher (licensed under CC-BY)
- The Water Cycle, Water Use and Distribution, and Groundwater from An Introduction to Geology by Chris Johnson et al. (licensed under CC-BY-NC-SA)
- Essentials of Environmental Science by Kamala Doršner is licensed under CC BY 4.0.