
10.2: Energy Flow through Ecosystems
- Page ID
- 111903

\( \newcommand{\vecs}[1]{\overset { \scriptstyle \rightharpoonup} {\mathbf{#1}} } \)
\( \newcommand{\vecd}[1]{\overset{-\!-\!\rightharpoonup}{\vphantom{a}\smash {#1}}} \)
\( \newcommand{\dsum}{\displaystyle\sum\limits} \)
\( \newcommand{\dint}{\displaystyle\int\limits} \)
\( \newcommand{\dlim}{\displaystyle\lim\limits} \)
\( \newcommand{\id}{\mathrm{id}}\) \( \newcommand{\Span}{\mathrm{span}}\)
( \newcommand{\kernel}{\mathrm{null}\,}\) \( \newcommand{\range}{\mathrm{range}\,}\)
\( \newcommand{\RealPart}{\mathrm{Re}}\) \( \newcommand{\ImaginaryPart}{\mathrm{Im}}\)
\( \newcommand{\Argument}{\mathrm{Arg}}\) \( \newcommand{\norm}[1]{\| #1 \|}\)
\( \newcommand{\inner}[2]{\langle #1, #2 \rangle}\)
\( \newcommand{\Span}{\mathrm{span}}\)
\( \newcommand{\id}{\mathrm{id}}\)
\( \newcommand{\Span}{\mathrm{span}}\)
\( \newcommand{\kernel}{\mathrm{null}\,}\)
\( \newcommand{\range}{\mathrm{range}\,}\)
\( \newcommand{\RealPart}{\mathrm{Re}}\)
\( \newcommand{\ImaginaryPart}{\mathrm{Im}}\)
\( \newcommand{\Argument}{\mathrm{Arg}}\)
\( \newcommand{\norm}[1]{\| #1 \|}\)
\( \newcommand{\inner}[2]{\langle #1, #2 \rangle}\)
\( \newcommand{\Span}{\mathrm{span}}\) \( \newcommand{\AA}{\unicode[.8,0]{x212B}}\)
\( \newcommand{\vectorA}[1]{\vec{#1}} % arrow\)
\( \newcommand{\vectorAt}[1]{\vec{\text{#1}}} % arrow\)
\( \newcommand{\vectorB}[1]{\overset { \scriptstyle \rightharpoonup} {\mathbf{#1}} } \)
\( \newcommand{\vectorC}[1]{\textbf{#1}} \)
\( \newcommand{\vectorD}[1]{\overrightarrow{#1}} \)
\( \newcommand{\vectorDt}[1]{\overrightarrow{\text{#1}}} \)
\( \newcommand{\vectE}[1]{\overset{-\!-\!\rightharpoonup}{\vphantom{a}\smash{\mathbf {#1}}}} \)
\( \newcommand{\vecs}[1]{\overset { \scriptstyle \rightharpoonup} {\mathbf{#1}} } \)
\(\newcommand{\longvect}{\overrightarrow}\)
\( \newcommand{\vecd}[1]{\overset{-\!-\!\rightharpoonup}{\vphantom{a}\smash {#1}}} \)
\(\newcommand{\avec}{\mathbf a}\) \(\newcommand{\bvec}{\mathbf b}\) \(\newcommand{\cvec}{\mathbf c}\) \(\newcommand{\dvec}{\mathbf d}\) \(\newcommand{\dtil}{\widetilde{\mathbf d}}\) \(\newcommand{\evec}{\mathbf e}\) \(\newcommand{\fvec}{\mathbf f}\) \(\newcommand{\nvec}{\mathbf n}\) \(\newcommand{\pvec}{\mathbf p}\) \(\newcommand{\qvec}{\mathbf q}\) \(\newcommand{\svec}{\mathbf s}\) \(\newcommand{\tvec}{\mathbf t}\) \(\newcommand{\uvec}{\mathbf u}\) \(\newcommand{\vvec}{\mathbf v}\) \(\newcommand{\wvec}{\mathbf w}\) \(\newcommand{\xvec}{\mathbf x}\) \(\newcommand{\yvec}{\mathbf y}\) \(\newcommand{\zvec}{\mathbf z}\) \(\newcommand{\rvec}{\mathbf r}\) \(\newcommand{\mvec}{\mathbf m}\) \(\newcommand{\zerovec}{\mathbf 0}\) \(\newcommand{\onevec}{\mathbf 1}\) \(\newcommand{\real}{\mathbb R}\) \(\newcommand{\twovec}[2]{\left[\begin{array}{r}#1 \\ #2 \end{array}\right]}\) \(\newcommand{\ctwovec}[2]{\left[\begin{array}{c}#1 \\ #2 \end{array}\right]}\) \(\newcommand{\threevec}[3]{\left[\begin{array}{r}#1 \\ #2 \\ #3 \end{array}\right]}\) \(\newcommand{\cthreevec}[3]{\left[\begin{array}{c}#1 \\ #2 \\ #3 \end{array}\right]}\) \(\newcommand{\fourvec}[4]{\left[\begin{array}{r}#1 \\ #2 \\ #3 \\ #4 \end{array}\right]}\) \(\newcommand{\cfourvec}[4]{\left[\begin{array}{c}#1 \\ #2 \\ #3 \\ #4 \end{array}\right]}\) \(\newcommand{\fivevec}[5]{\left[\begin{array}{r}#1 \\ #2 \\ #3 \\ #4 \\ #5 \\ \end{array}\right]}\) \(\newcommand{\cfivevec}[5]{\left[\begin{array}{c}#1 \\ #2 \\ #3 \\ #4 \\ #5 \\ \end{array}\right]}\) \(\newcommand{\mattwo}[4]{\left[\begin{array}{rr}#1 \amp #2 \\ #3 \amp #4 \\ \end{array}\right]}\) \(\newcommand{\laspan}[1]{\text{Span}\{#1\}}\) \(\newcommand{\bcal}{\cal B}\) \(\newcommand{\ccal}{\cal C}\) \(\newcommand{\scal}{\cal S}\) \(\newcommand{\wcal}{\cal W}\) \(\newcommand{\ecal}{\cal E}\) \(\newcommand{\coords}[2]{\left\{#1\right\}_{#2}}\) \(\newcommand{\gray}[1]{\color{gray}{#1}}\) \(\newcommand{\lgray}[1]{\color{lightgray}{#1}}\) \(\newcommand{\rank}{\operatorname{rank}}\) \(\newcommand{\row}{\text{Row}}\) \(\newcommand{\col}{\text{Col}}\) \(\renewcommand{\row}{\text{Row}}\) \(\newcommand{\nul}{\text{Nul}}\) \(\newcommand{\var}{\text{Var}}\) \(\newcommand{\corr}{\text{corr}}\) \(\newcommand{\len}[1]{\left|#1\right|}\) \(\newcommand{\bbar}{\overline{\bvec}}\) \(\newcommand{\bhat}{\widehat{\bvec}}\) \(\newcommand{\bperp}{\bvec^\perp}\) \(\newcommand{\xhat}{\widehat{\xvec}}\) \(\newcommand{\vhat}{\widehat{\vvec}}\) \(\newcommand{\uhat}{\widehat{\uvec}}\) \(\newcommand{\what}{\widehat{\wvec}}\) \(\newcommand{\Sighat}{\widehat{\Sigma}}\) \(\newcommand{\lt}{<}\) \(\newcommand{\gt}{>}\) \(\newcommand{\amp}{&}\) \(\definecolor{fillinmathshade}{gray}{0.9}\)Energy
One area of ecosystem ecology focuses on the transfer of energy among living organisms in an ecosystem, including how efficiently organisms acquire it, use it, and how much remains for use by other organisms of the food web. The amount of energy, and the efficiency with which energy is transferred determines the number of trophic levels and biomass of organisms that exist at each level. Energy is defined as the ability to do work – which, for biology purposes, can be thought of as the ability to cause some kind of change. All living organisms, whether a single cell microbe or a large multicellular blue whale, require energy to sustain life. Energy is used for growth, movement, reproduction, and to maintain a stable internal environment (homeostasis).
Energy is neither created nor destroyed — and yet the global demand for it continues to increase. But where does energy come from, and where does it go? Watch the video to learn the many ways in which energy cycles through our planet, from the sun to our food chain to electricity and beyond.
How Organisms Acquire Energy
Energy is acquired by living things in three ways: photosynthesis, chemosynthesis, and the consumption and digestion of other living or previously living organisms by consumers.
Photosynthetic and chemosynthetic organisms are both grouped into a category known as autotrophs: organisms capable of synthesizing their own food (more specifically, capable of using inorganic carbon as a carbon source). Because autotrophs produce complex energy rich organic molecules they are also called producers. Photosynthetic autotrophs (photoautotrophs) use sunlight as an energy source, whereas chemosynthetic autotrophs (chemoautotrophs) use inorganic molecules as an energy source. Autotrophs are critical for all ecosystems. Without these organisms, energy would not be available to other living organisms and life itself would not be possible.
Photoautotrophs, such as plants, algae, and photosynthetic bacteria, serve as the energy source for a majority of the world’s ecosystems. These ecosystems are often described by grazing food webs. Photoautotrophs harness the solar energy of the sun by converting it to chemical energy in the form complex organic molecules (such as sugars and starch).
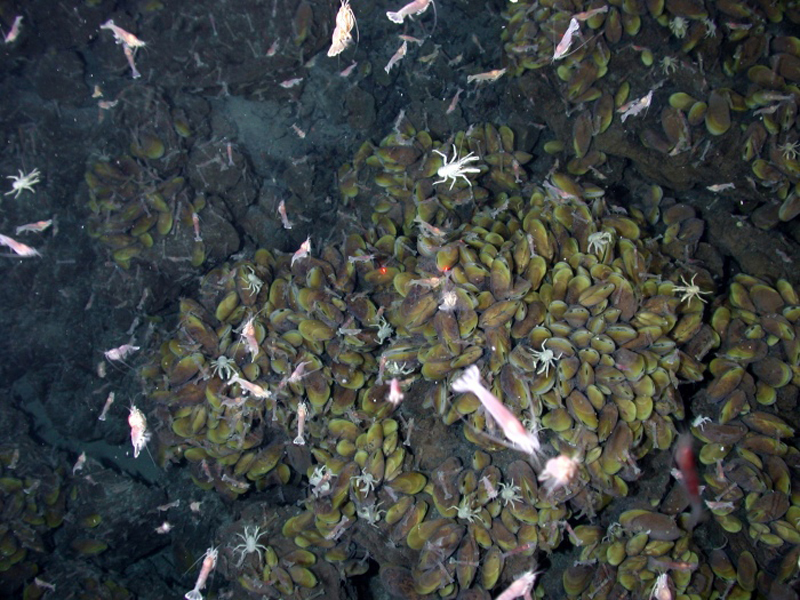
Chemoautotrophs are primarily bacteria that are found in rare ecosystems where sunlight is not available, such as in those associated with dark caves or hydrothermal vents at the bottom of the ocean (Figure \(\PageIndex{1}\)). Many chemoautotrophs in hydrothermal vents use hydrogen sulfide (H2S), which is released from the vents as a source of chemical energy. This allows chemoautotrophs to synthesize complex organic molecules for their own energy and in turn supplies energy to the rest of the ecosystem.
Productivity within Trophic Levels
Productivity within an ecosystem can be defined as the percentage of energy entering the ecosystem incorporated into biomass in a particular trophic level. Biomass is the total mass, in a unit area at the time of measurement, of living or previously living organisms within a trophic level. Ecosystems have characteristic amounts of biomass at each trophic level. For example, in the English Channel ecosystem the primary producers account for a biomass of 4 g/m2 (grams per meter squared), while the primary consumers exhibit a biomass of 21 g/m2.
The productivity of the primary producers is especially important in any ecosystem because these organisms bring energy to other living organisms by photoautotrophy or chemoautotrophy. The rate at which photosynthetic primary producers incorporate energy from the sun is called gross primary productivity. An example of gross primary productivity is shown in the compartment diagram of energy flow within the Silver Springs aquatic ecosystem as shown (Figure \(\PageIndex{2}\)). In this ecosystem, the total energy accumulated by the primary producers (gross primary productivity) was shown to be 20,810 kcal/m2/yr.
Because all organisms need to use some of this energy for their own functions (like respiration and resulting metabolic heat loss) scientists often refer to the net primary productivity of an ecosystem. Net primary productivity is the energy that remains in the primary producers after accounting for the organisms’ respiration and heat loss. The net productivity is then available to the primary consumers at the next trophic level. In our Silver Spring example, 13,187 of the 20,810 kcal/m2/yr were used for respiration or were lost as heat, leaving 7,632 kcal/m2/yr of energy for use by the primary consumers.
Ecological Efficiency: The Transfer of Energy between Trophic Levels
As illustrated in Figure \(\PageIndex{2}\), large amounts of energy are lost from the ecosystem from one trophic level to the next level as energy flows from the primary producers through the various trophic levels of consumers and decomposers. The main reason for this loss is the second law of thermodynamics, which states that whenever energy is converted from one form to another, there is a tendency toward disorder (entropy) in the system. In biologic systems, this means a great deal of energy is lost as metabolic heat when the organisms from one trophic level consume the next level. In the Silver Springs ecosystem example (Figure \(\PageIndex{2}\)), we see that the primary consumers produced 1103 kcal/m2/yr from the 7618 kcal/m2/yr of energy available to them from the primary producers. The measurement of energy transfer efficiency between two successive trophic levels is termed the trophic level transfer efficiency (TLTE) and is defined by the formula:
\[\text{TLTE} = \frac{\text{production at present trophic level}}{\text{production at previous trophic level}} * 100 \nonumber\]
In Silver Springs, the TLTE between the first two trophic levels was approximately 14.8 percent. The low efficiency of energy transfer between trophic levels is usually the major factor that limits the length of food chains observed in a food web. The fact is, after four to six energy transfers, there is not enough energy left to support another trophic level. In the Summer grassland example shown in Figure \(\PageIndex{2}\), only four energy transfers occurred between the primary producer, (grass plants), and the apex consumer (birds).
Ecologists have many different methods of measuring energy transfers within ecosystems. Some transfers are easier or more difficult to measure depending on the complexity of the ecosystem and how much access scientists have to observe the ecosystem. In other words, some ecosystems are more difficult to study than others, and sometimes the quantification of energy transfers has to be estimated.
Secondary Production
Another main parameter that is important in characterizing energy flow within an ecosystem is the net production efficiency (also called secondary production). Net production efficiency (NPE) allows ecologists to quantify how efficiently organisms of a particular trophic level incorporate the energy they receive into biomass; it is calculated using the following formula:
\[\text{NPE} = \frac{\text{consumer productivity}}{\text{assimilation}} * 100 \nonumber\]
Consumer productivity is the energy assimilated into new biomass (including new biomass generated through reproduction). It is, consequently, also the energy available to the organisms of the next trophic level. Assimilation is the biomass consumed (energy content generated per unit area) after accounting for the energy lost due to incomplete ingestion of food and energy lost as waste through excretion (feces). Incomplete ingestion refers to the fact that some consumers eat only a part of their food. For example, when a lion kills an antelope, it will eat everything except the hide and bones. The lion is missing the energy-rich bone marrow inside the bone, so the lion does not make use of all the calories its prey could provide.
Watch the video for an example of how to calculate NPE.
Thus the NPE for the caterpillar example above is:
\[\text{NPE} = \frac{\text{33 J}}{\text{33J + 67J}} * 100 \nonumber\]
Thus, of the 200 J the caterpillar consumed, only 100 J was assimilated and only 33J was convered into new biomass. A NPE of 33%
Thus, NPE measures how efficiently each trophic level uses and incorporates the energy from its food into biomass to fuel the next trophic level. In general, cold-blooded animals (ectotherms), such as invertebrates, fish, amphibians, and reptiles, use less of the energy they obtain for respiration and heat than warm-blooded animals (endotherms), such as birds and mammals. The extra heat generated in endotherms, although an advantage in terms of the activity of these organisms in colder environments, is a major disadvantage in terms of NPE. Therefore, many endotherms have to eat more often than ectotherms to get the energy they need for survival. In general, NPE for ectotherms is an order of magnitude (10x) higher than for endotherms. For example, the NPE for a caterpillar eating leaves has been measured at 18 percent, whereas the NPE for a squirrel eating acorns may be as low as 1.6 percent.
The inefficiency of energy use by warm-blooded animals has broad implications for the world's food supply. It is widely accepted that the meat industry uses large amounts of crops to feed livestock, and because the NPE is low, much of the energy from animal feed is lost. For example, it costs about 1¢ to produce 1000 dietary calories (kcal) of corn or soybeans, but approximately $0.19 to produce a similar number of calories growing cattle for beef consumption. The same energy content of milk from cattle is also costly, at approximately $0.16 per 1000 kcal. Much of this difference is due to the low NPE of cattle. Thus, there has been a growing movement worldwide to promote the consumption of non-meat and non-dairy foods so that less energy is wasted feeding animals for the meat industry.
Modeling Ecosystems Energy Flow: Ecological Pyramids
The structure of ecosystems can be visualized with ecological pyramids, which show the relative amounts of various parameters (such as number of organisms, energy, and biomass) across trophic levels.
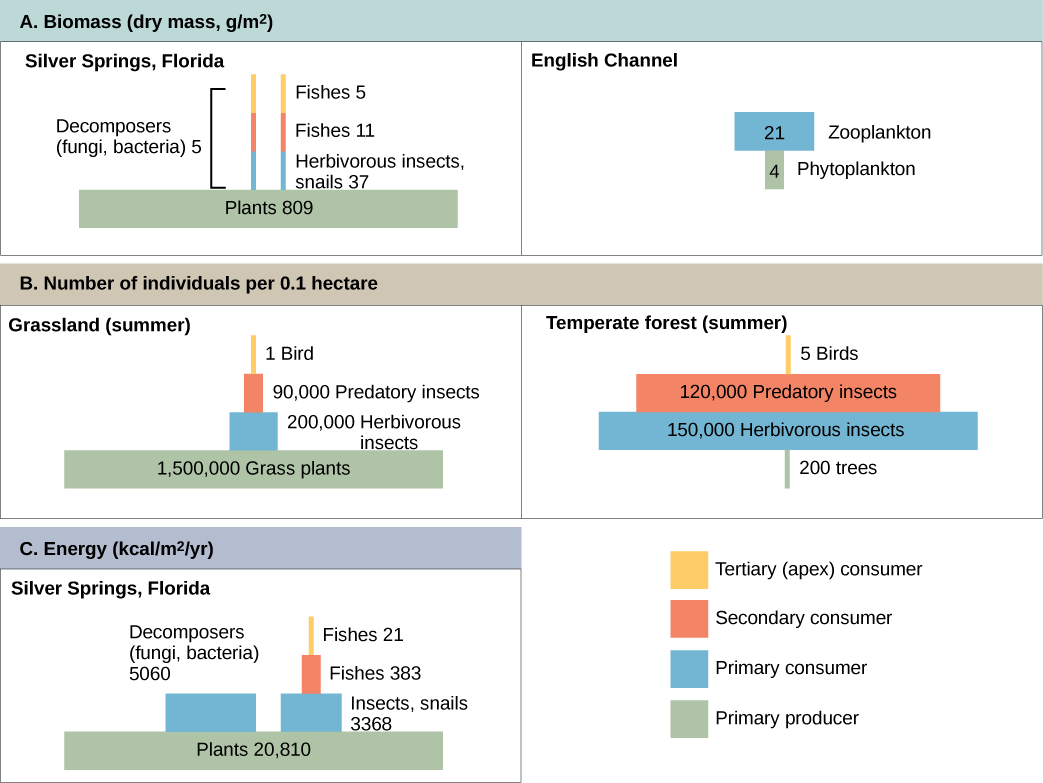
Pyramids of numbers can be either upright or inverted, depending on the ecosystem. As shown in Figure \(\PageIndex{2}\)b, typical grassland during the summer has a base of many plants and the numbers of organisms decrease at each trophic level. However, during the summer in a temperate forest, the base of the pyramid consists of few trees compared with the number of primary consumers, mostly insects. Because trees are large, they have great photosynthetic capability, and dominate other plants in this ecosystem to obtain sunlight. Even in smaller numbers, primary producers in forests are still capable of supporting other trophic levels.
Another way to visualize ecosystem structure is with pyramids of biomass. This pyramid measures the amount of energy converted into living tissue at the different trophic levels. Using the Silver Springs ecosystem example, this data exhibits an upright biomass pyramid (Figure \(\PageIndex{2}\)a), whereas the pyramid from the English Channel example is inverted. The plants (primary producers) of the Silver Springs ecosystem make up a large percentage of the biomass found there. However, the phytoplankton in the English Channel example make up less biomass than the primary consumers, the zooplankton. As with inverted pyramids of numbers, this inverted pyramid is not due to a lack of productivity from the primary producers, but results from the high turnover rate of the phytoplankton. The phytoplankton are consumed rapidly by the primary consumers, thus, minimizing their biomass at any particular point in time. However, phytoplankton reproduce quickly, thus they are able to support the rest of the ecosystem.
Pyramid ecosystem modeling can also be used to show energy flow through the trophic levels. Pyramids of energy are always upright, and an ecosystem without sufficient primary productivity cannot be supported. All types of ecological pyramids are useful for characterizing ecosystem structure. However, in the study of energy flow through the ecosystem, pyramids of energy are the most consistent and representative models of ecosystem structure (Figure \(\PageIndex{2}\)c).
Pyramids depicting the number of organisms or biomass may be inverted, upright, or even diamond-shaped. Energy pyramids, however, are always upright. Why?
- Answer
-
Pyramids of organisms may be inverted or diamond-shaped because a large organism, such as a tree, can sustain many smaller organisms. Likewise, a low biomass of organisms can sustain a larger biomass at the next trophic level because the organisms reproduce rapidly and thus supply continuous nourishment. Energy pyramids, however, must always be upright because of the laws of thermodynamics. The first law of thermodynamics states that energy can neither be created nor destroyed; thus, each trophic level must acquire energy from the trophic level below. The second law of thermodynamics states that, during the transfer of energy, some energy is always lost as heat; thus, less energy is available at each higher trophic level.
Attribution
This page is a modified derivative of:
- 46.2: Energy Flow through Ecosystems via OpenStax; licensed CC BY 4.0.