
16.4: Mendelian Inheritance
- Page ID
- 30745

\( \newcommand{\vecs}[1]{\overset { \scriptstyle \rightharpoonup} {\mathbf{#1}} } \)
\( \newcommand{\vecd}[1]{\overset{-\!-\!\rightharpoonup}{\vphantom{a}\smash {#1}}} \)
\( \newcommand{\id}{\mathrm{id}}\) \( \newcommand{\Span}{\mathrm{span}}\)
( \newcommand{\kernel}{\mathrm{null}\,}\) \( \newcommand{\range}{\mathrm{range}\,}\)
\( \newcommand{\RealPart}{\mathrm{Re}}\) \( \newcommand{\ImaginaryPart}{\mathrm{Im}}\)
\( \newcommand{\Argument}{\mathrm{Arg}}\) \( \newcommand{\norm}[1]{\| #1 \|}\)
\( \newcommand{\inner}[2]{\langle #1, #2 \rangle}\)
\( \newcommand{\Span}{\mathrm{span}}\)
\( \newcommand{\id}{\mathrm{id}}\)
\( \newcommand{\Span}{\mathrm{span}}\)
\( \newcommand{\kernel}{\mathrm{null}\,}\)
\( \newcommand{\range}{\mathrm{range}\,}\)
\( \newcommand{\RealPart}{\mathrm{Re}}\)
\( \newcommand{\ImaginaryPart}{\mathrm{Im}}\)
\( \newcommand{\Argument}{\mathrm{Arg}}\)
\( \newcommand{\norm}[1]{\| #1 \|}\)
\( \newcommand{\inner}[2]{\langle #1, #2 \rangle}\)
\( \newcommand{\Span}{\mathrm{span}}\) \( \newcommand{\AA}{\unicode[.8,0]{x212B}}\)
\( \newcommand{\vectorA}[1]{\vec{#1}} % arrow\)
\( \newcommand{\vectorAt}[1]{\vec{\text{#1}}} % arrow\)
\( \newcommand{\vectorB}[1]{\overset { \scriptstyle \rightharpoonup} {\mathbf{#1}} } \)
\( \newcommand{\vectorC}[1]{\textbf{#1}} \)
\( \newcommand{\vectorD}[1]{\overrightarrow{#1}} \)
\( \newcommand{\vectorDt}[1]{\overrightarrow{\text{#1}}} \)
\( \newcommand{\vectE}[1]{\overset{-\!-\!\rightharpoonup}{\vphantom{a}\smash{\mathbf {#1}}}} \)
\( \newcommand{\vecs}[1]{\overset { \scriptstyle \rightharpoonup} {\mathbf{#1}} } \)
\( \newcommand{\vecd}[1]{\overset{-\!-\!\rightharpoonup}{\vphantom{a}\smash {#1}}} \)
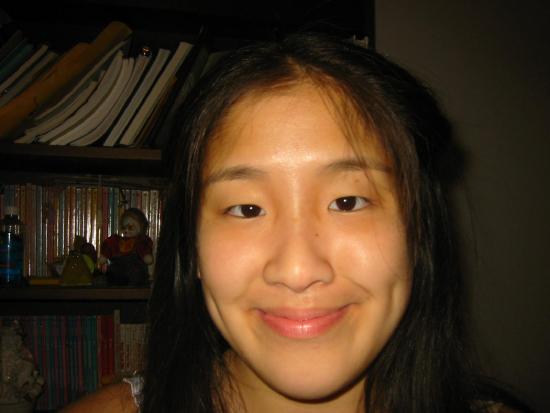
\(\newcommand{\avec}{\mathbf a}\) \(\newcommand{\bvec}{\mathbf b}\) \(\newcommand{\cvec}{\mathbf c}\) \(\newcommand{\dvec}{\mathbf d}\) \(\newcommand{\dtil}{\widetilde{\mathbf d}}\) \(\newcommand{\evec}{\mathbf e}\) \(\newcommand{\fvec}{\mathbf f}\) \(\newcommand{\nvec}{\mathbf n}\) \(\newcommand{\pvec}{\mathbf p}\) \(\newcommand{\qvec}{\mathbf q}\) \(\newcommand{\svec}{\mathbf s}\) \(\newcommand{\tvec}{\mathbf t}\) \(\newcommand{\uvec}{\mathbf u}\) \(\newcommand{\vvec}{\mathbf v}\) \(\newcommand{\wvec}{\mathbf w}\) \(\newcommand{\xvec}{\mathbf x}\) \(\newcommand{\yvec}{\mathbf y}\) \(\newcommand{\zvec}{\mathbf z}\) \(\newcommand{\rvec}{\mathbf r}\) \(\newcommand{\mvec}{\mathbf m}\) \(\newcommand{\zerovec}{\mathbf 0}\) \(\newcommand{\onevec}{\mathbf 1}\) \(\newcommand{\real}{\mathbb R}\) \(\newcommand{\twovec}[2]{\left[\begin{array}{r}#1 \\ #2 \end{array}\right]}\) \(\newcommand{\ctwovec}[2]{\left[\begin{array}{c}#1 \\ #2 \end{array}\right]}\) \(\newcommand{\threevec}[3]{\left[\begin{array}{r}#1 \\ #2 \\ #3 \end{array}\right]}\) \(\newcommand{\cthreevec}[3]{\left[\begin{array}{c}#1 \\ #2 \\ #3 \end{array}\right]}\) \(\newcommand{\fourvec}[4]{\left[\begin{array}{r}#1 \\ #2 \\ #3 \\ #4 \end{array}\right]}\) \(\newcommand{\cfourvec}[4]{\left[\begin{array}{c}#1 \\ #2 \\ #3 \\ #4 \end{array}\right]}\) \(\newcommand{\fivevec}[5]{\left[\begin{array}{r}#1 \\ #2 \\ #3 \\ #4 \\ #5 \\ \end{array}\right]}\) \(\newcommand{\cfivevec}[5]{\left[\begin{array}{c}#1 \\ #2 \\ #3 \\ #4 \\ #5 \\ \end{array}\right]}\) \(\newcommand{\mattwo}[4]{\left[\begin{array}{rr}#1 \amp #2 \\ #3 \amp #4 \\ \end{array}\right]}\) \(\newcommand{\laspan}[1]{\text{Span}\{#1\}}\) \(\newcommand{\bcal}{\cal B}\) \(\newcommand{\ccal}{\cal C}\) \(\newcommand{\scal}{\cal S}\) \(\newcommand{\wcal}{\cal W}\) \(\newcommand{\ecal}{\cal E}\) \(\newcommand{\coords}[2]{\left\{#1\right\}_{#2}}\) \(\newcommand{\gray}[1]{\color{gray}{#1}}\) \(\newcommand{\lgray}[1]{\color{lightgray}{#1}}\) \(\newcommand{\rank}{\operatorname{rank}}\) \(\newcommand{\row}{\text{Row}}\) \(\newcommand{\col}{\text{Col}}\) \(\renewcommand{\row}{\text{Row}}\) \(\newcommand{\nul}{\text{Nul}}\) \(\newcommand{\var}{\text{Var}}\) \(\newcommand{\corr}{\text{corr}}\) \(\newcommand{\len}[1]{\left|#1\right|}\) \(\newcommand{\bbar}{\overline{\bvec}}\) \(\newcommand{\bhat}{\widehat{\bvec}}\) \(\newcommand{\bperp}{\bvec^\perp}\) \(\newcommand{\xhat}{\widehat{\xvec}}\) \(\newcommand{\vhat}{\widehat{\vvec}}\) \(\newcommand{\uhat}{\widehat{\uvec}}\) \(\newcommand{\what}{\widehat{\wvec}}\) \(\newcommand{\Sighat}{\widehat{\Sigma}}\) \(\newcommand{\lt}{<}\) \(\newcommand{\gt}{>}\) \(\newcommand{\amp}{&}\) \(\definecolor{fillinmathshade}{gray}{0.9}\)This person is exhibiting a genetic trait — the dimples in their cheeks when they smiles. Genetic traits are characteristics that are encoded in DNA. Some genetic traits, like dimples, have a simple inheritance pattern like the traits that Gregor Mendel studied in pea plants. The way these traits are inherited by offspring from their parents is called simple inheritance.
What Is Simple Inheritance?
Simple (or Mendelian) inheritance refers to the inheritance of traits controlled by a single gene with two alleles, one of which may be completely dominant to the other. The pattern of inheritance of simple traits depends on whether the traits are controlled by genes on autosomes or by genes on sex chromosomes.
- Autosomal traits are controlled by genes on one of the 22 pairs of human autosomes. Autosomes are all the chromosomes except the X or Y chromosome, and they do not differ between males and females, so autosomal traits are inherited in the same way regardless of the sex of the parent or offspring.
- Traits controlled by genes on the sex chromosomes are called sex-linked traits. Because of the small size of the Y chromosome, most sex-linked traits are controlled by genes on the X chromosome. These traits are called X-linked traits. Single-gene X-linked traits have a different pattern of inheritance than single-gene autosomal traits because males have just one X chromosome. Males always inherit their X chromosome from their mother, and they pass on their X chromosome to all of their daughters but none of their sons.
Studying Inheritance Patterns
There are two very useful tools for studying how traits are passed from one generation to the next. One tool is a pedigree, the other is a Punnett square.
Pedigree
The charts below are called pedigrees. A pedigree shows how a trait is passed from generation to generation within a family. A pedigree can show, for example, whether a trait is an autosomal dominant, autosomal recessive, or X-linked trait. Pedigrees show relationships and identify individuals with a given trait. In the pedigrees below:
- affected individuals are shown in red, unaffected individuals are shown in blue
- males are shown as squares, females are shown as circles
- The top row of a pedigree is the original couple. Two individuals who are connected by a horizontal line are breeding pairs. The children of the couple are connected to them by vertical lines.
- The next row of the pedigree shows the couple's children, as well as the partners of the children. And, the third row of the pedigree shows the next generation (the grandchildren of the couple at the top of the pedigree). Larger pedigrees can have more rows showing additional generations.
Figure \(\PageIndex{2}\) is an example of a pedigree of an autosomal dominant trait. This pedigree begins with an affected male and an unaffected female. The couple's first child (on the left) is an affected male whose partner is an unaffected female. They produce two children: an affected female and an unaffected male. The next child is an unaffected male partnered with an unaffected female. Their children are two unaffected females and an unaffected male. The next child is an unpartnered affected female. The fourth child is an unpartnered unaffected female. The youngest child is an affected female partnered with an unaffected male. Their children are an affected male, followed by an unaffected male, followed by an affected female, followed by an unaffected female.
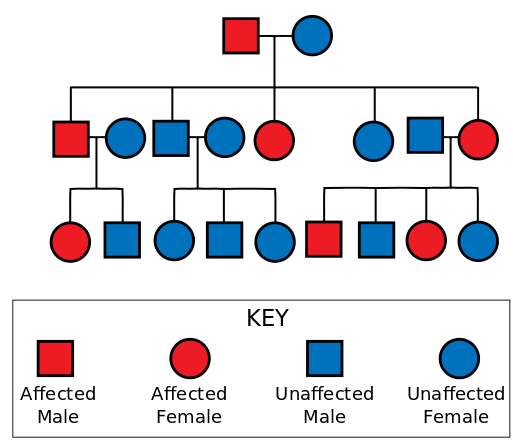
In an autosomal dominant trait, a child that has the trait will always have at least one parent with the trait. In an autosomal recessive trait, two individuals without the trait can have a child with the trait.
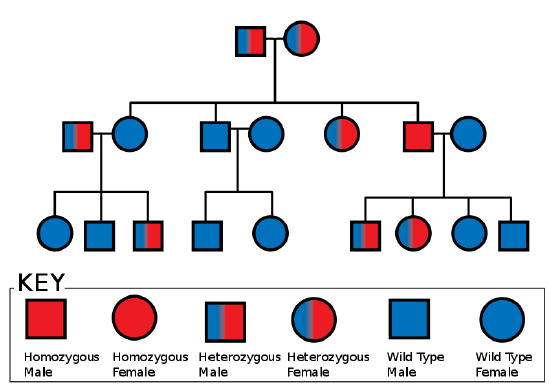
Figure \(\PageIndex{3}\) is a pedigree of an autosomal recessive trait. In this pedigree, individuals that are half-shaded are heterozygous (and therefore do not show the trait). In this example, two heterozygous individuals have four children. Their youngest child is an affected male. This individual mates with an unaffected female to produce two heterozygous children and two unaffected children. The original couple's next youngest is a heterozygous female. The original couple's second child is an unaffected male, who partners with an unaffected female to produce two unaffected children. The original couple's oldest child is an unaffected female whose partner is a heterozygous male. Their children are an unaffected female, an unaffected male, and a heterozygous male.
Punnett Square
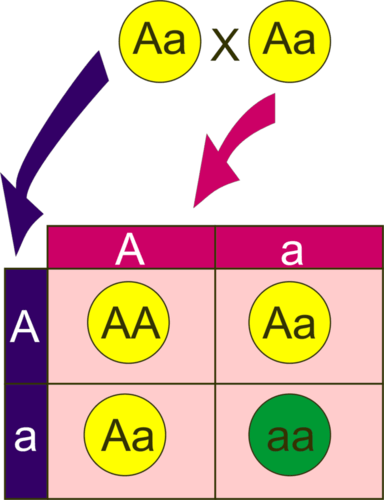
A Punnett square is a chart that allows you to easily determine the expected ratios of possible genotypes in the offspring of two parents. The mating between two parents is called a cross. The Punnett square is named after its developer, British geneticist Reginald C. Punnett. You can see a hypothetical example in Figure \(\PageIndex{4}\). In this case, the gene is autosomal, and both parents are heterozygotes (Aa) for the gene. Half the gametes produced by each parent will have the A allele and half will have the a allele. That's because the two alleles are on homologous chromosomes, which always separate and go to separate gametes during meiosis. According to Mendel's law of segregation, the alleles in the gametes from each parent are written down the side and across the top of the Punnett square. Filling in the cells of the Punnett square gives the possible genotypes of their children. It also shows the most likely ratios of the genotypes, which in this case is 25 percent AA, 50 percent Aa, and 25 percent aa.
Predicting Genotypes and phenotype with Punnett Squares
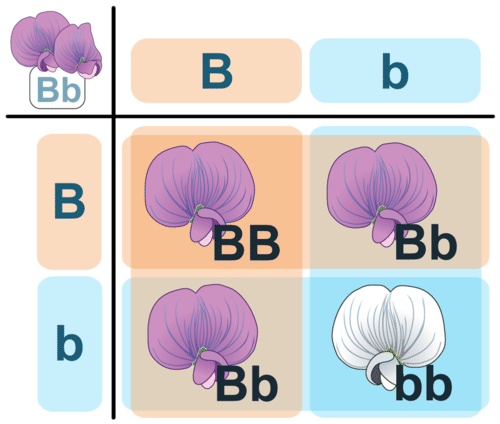
Mendel developed the law of segregation by following only a single characteristic, such as pod color, in his pea plants. In a monohybrid cross, such as the one in Figure \(\PageIndex{5}\), the Punnett square shows every possible combination when combining one maternal (biological mother) allele with one paternal (biological father) allele. In this example, both organisms are heterozygous for flower color Bb (purple). Both plants produce gametes that contain either the B and b alleles. If the gametes from both parents contain the dominant alleles, the resulting plant will be homozygous dominant and have purple flowers. If the gametes from both parents contain the recessive alleles, the resulting plant will be homozygous recessive and have white flowers. If the gamete from one parent contains the dominant allele and the gamete from the other parent contains the recessive allele, the resulting plant will be heterozygous and have purple flowers. The probability of any single offspring showing the dominant trait is 3:1, or 75%.
Dihybrid cross
For a monohybrid cross, we are only looking at a single gene. Therefore, the outside of the Punnett square will only have single letters (single alleles). For a dihybrid cross, pairs of alleles are used. This means the outside of the square will have pairs of letters. A Punnett square for a monohybrid cross is divided into four squares, whereas a Punnett square for a dihybrid cross is divided into 16 squares. How many boxes would a Punnett square need if three traits were examined? The squares are filled in with the possible combinations of alleles formed when gametes combine, such as in a zygote.
These types of crosses can be challenging to set up, and the square you create will be 4x4. This simple guide will walk you through the steps of solving a typical dihybrid cross common in genetics. The method can also work for any cross that involves two traits.
Consider this cross
This cross focuses on two traits in peas.
- The trait for yellow peas (Y) is dominant to the trait for green peas (y).
- The trait for round peas (R) is dominant to the trait for wrinkled peas (r).
Figure \(\PageIndex{6}\) outlines two generations of crosses. In the Parental (P) generation two homozygous plants are crossed: a plant that produces yellow round peas (YYRR) is crossed with a plant that produces green wrinkled peas (yyrr). The Punnett square for this cross is not shown, but all of the offspring would be heterozygous (have the YyRr genotype) and produce yellow round peas. To arrive at this:
- The parent with the YYRR genotype produces gametes that are all YR
- The parent with the yr genotype produces gametes that are all yr
- The YR and yr gametes produce YyRr offspring
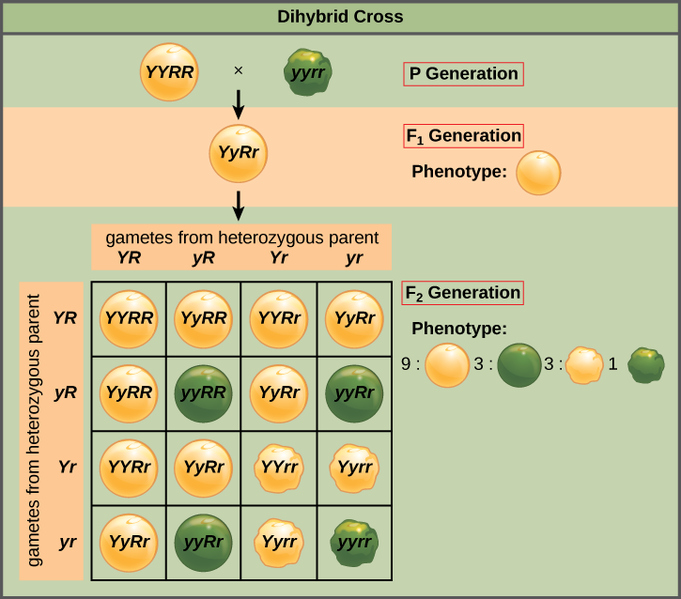
Two heterozygous plants (YyRr) are crossed. What gametes do each of these plants produce? When gametes are produced, they can either have the dominant R or the recessive r. And, they can either have the dominant Y or the recessive y. Combine the R's and Ys of each parent to represent sperm and egg.
- A gamete that gets the Y allele:
- can either get the R allele and be YR
- or it can get the r allele and be Yr
- A gamete that gets the y allele:
- can either get the R allele and be yR
- or it can get the r allele and be yr
A plant that is YyRr will produce 4 different gametes: YR, Yr, yR, yr. These gametes are written on the outside of the Punnett square in Figure \(\PageIndex{6}\). Next the gametes are combined to form the offspring's genotypes (written in the center of the Punnet square). The resulting offspring will have the following ratios:
- 9/16 round, yellow peas; having the genotypes
- YYRR (1)
- YyRR (2)
- YYRr (2)
- YyRr (4)
- 3/16 round, green peas; having the genotypes yyRR (1) and yyRr (2)
- 3/16 wrinkled, yellow peas; having the genotypes YYrr (3)
- 1/16 wrinkled green peas; having the genotype yyrr
Autosomal single-gene Traits in Humans
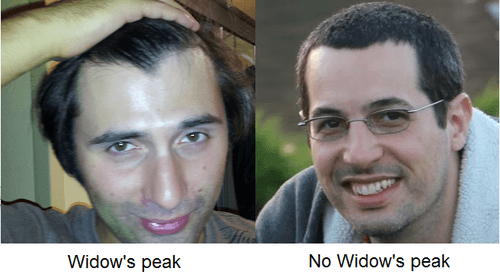
Single-gene autosomal traits include widow's peak and freckles, both of which are illustrated below. Widow's peak refers to a point in the hairline at the center of the forehead. Assume that the dominant and recessive alleles for the widow's peak gene are represented by Wand w, respectively. Because this is a dominant trait, people with the genotype WW and the genotype Ww will have a widow's peak, and only people with the genotype ww will not have the trait.
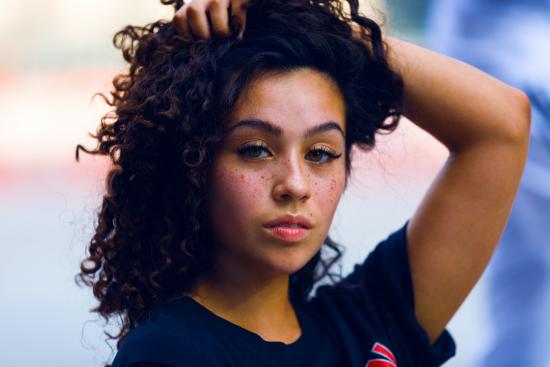
Assume that the dominant and recessive alleles for freckles are represented by F and f, respectively. Because it is a dominant trait, people with the genotype FF and the genotype Ff will have freckles, and only people with the genotype ff will not have the trait.
Sex inheritance
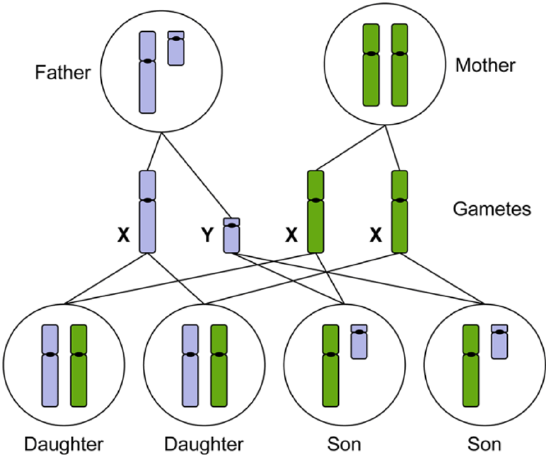
What determines if a baby is a male or female? Recall that you have 23 pairs of chromosomes—and one of those pairs is the sex chromosomes. Everyone normally has two sex chromosomes. Later, you will learn that due to nondisjunction, males and females may have one less or one extra X chromosome. Your sex chromosomes can be X or Y. Females have two X chromosomes (XX), while males have one X chromosome and one Y chromosome (XY). If a baby inherits an X chromosome from the father and an X chromosome from the mother, what will be the child’s sex? The baby will have two X chromosomes, so it will be female. If the father’s sperm carries the Y chromosome, the child will be male. Notice that a mother can only pass on an X chromosome, so the sex of the baby is determined by the father. The father has a 50 percent chance of passing on the Y or X chromosome, so there is a 50 percent chance that a child will be male, and there is a 50 percent chance a child will be female. This 50:50 chance occurs for each baby. A couple's first five children could all be boys. The sixth child still has a 50:50 chance of being a girl. A Punnett square can also be used to show how the X and Y chromosomes are passed from parents to their children. This is illustrated in the Punnett square below. It may help you understand the inheritance pattern of sex-linked traits.
X-Linked Mendelian Traits in Humans
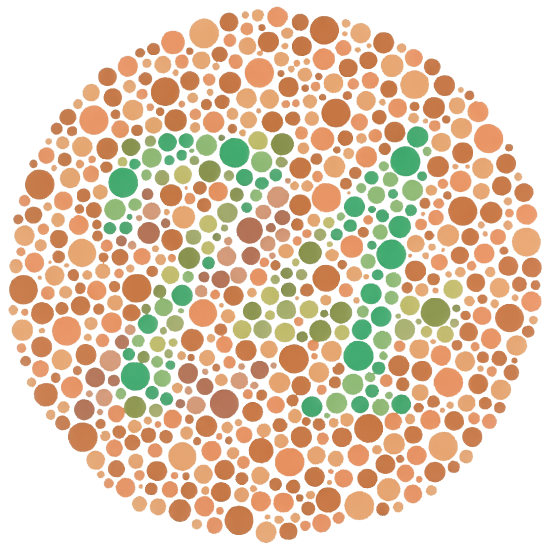
One example of a sex-linked trait is red-green colorblindness. People with this type of colorblindness cannot tell the difference between red and green. They often see these colors as shades of brown (Figure \(\PageIndex{11}\)).
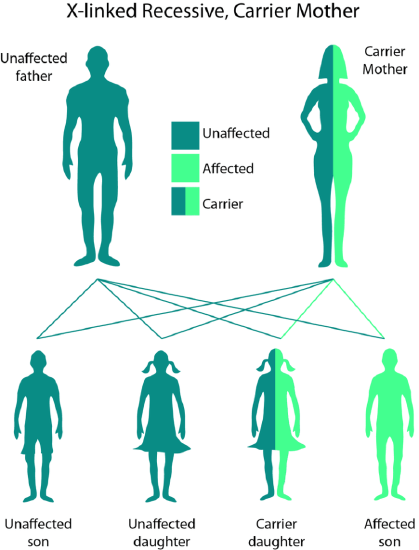
Males are much more likely to be colorblind than females because colorblindness is a sex-linked, recessive trait. Because males have just one X chromosome, they have only one allele for any X-linked trait. Therefore, a recessive X-linked allele is always expressed in males. Because females have two X chromosomes, they have two alleles for any X-linked trait. Females can have one X chromosome with the colorblind gene and one X chromosome with a normal gene for color vision. Since colorblindness is recessive, the dominant normal gene will mask the recessive colorblind gene. Females with one colorblindness allele and one normal allele are referred to as carriers. They carry the allele but do not express it. Females must inherit two copies of the recessive allele to express an X-linked recessive trait. This explains why X-linked recessive traits are less common in females than males and why they show a different pattern of inheritance than autosomal traits.
According to this Punnett square (Table \(\PageIndex{1}\)), the son of a woman who carries the colorblindness trait and a male with normal vision has a 50% chance of being colorblind. Figure \(\PageIndex{10}\) shows a simple pedigree for this trait.
| Xb | XB | |
|---|---|---|
| XB |
XbX (carrier female) |
XBXB (unaffected female) |
| Y |
XbY (colorblind male) |
XBY (unaffected male) |
Another example of a recessive X-linked Mendelian trait is hemophilia. This is a disorder characterized by the inability of blood to clot normally. England's Queen Victoria was a carrier of the disorder. Two of Queen Victoria's five daughters inherited the hemophilia allele from their mother and were carriers. When they married royalty in other European countries, they spread the allele across Europe, including the royal families of Spain, Germany, and Russia. Victoria's son Prince Leopold also inherited the hemophilia allele from his mother and actually suffered from the disease. For these reasons, hemophilia was once popularly called "the royal disease."
Feature: My Human Body
Are you color blind or think you might be? If you inherited this X-linked recessive disorder, a world without clear differences between certain colors seems normal to you. It's all you have ever known. That's why some people who are color blind are not even aware of it. Simple tests have been devised to determine whether a person is color blind and the degree of this visual deficit. An example of such a test is pictured below. What do you see when you look at this circle? Can you clearly perceive the number 74? If so, you probably have normal red-green color vision. If you cannot see the number, you may have red-green color blindness.
Being color blind may cause a number of problems. These may range from minor frustrations to outright dangers. For example:
- If you are color blind, it may be difficult to color-coordinate clothing and furnishings. You may end up wearing color combinations that people with normal color vision think are odd or clashing.
- Many LED indicator lights are red or green. For example, power strips and electronic devices may have indicator lights to show whether they are on (green) or off (red).
- Test strips for pH, hard water, swimming pool chemicals, and other common tests are also often color coded. Litmus paper for testing pH, for example, turns red in the presence of an acid, but if you are color blind, you may not be able to read the test result.
- Do you like your steak well done? If you are color blind, you may not be able to tell if the meat is still undercooked (red) or grilled just right. You also may not be able to distinguish ripe (red) from unripe (green) fruits and vegetables such as tomatoes. And some foods, such as dark green spinach, may look more like mud than food and be totally unappetizing.
- Weather maps often are color coded. Is that rain (green) in your forecast or a wintry mix of sleet and freezing rain (pink or red)? If you can't tell the difference, you may go out on the roads when you shouldn't and put yourself in danger.
- Being able to distinguish red from green traffic lights may be a matter of life or death. This can be very difficult for someone with red-green color blindness. That's why in some countries, people with this vision defect are not allowed to drive.
Being aware of conditions such as colorblindness is also important for anyone creating content online. Developing webpages that are legible to all users is an important skill for a variety of jobs. You can use online tools (such as the Toptal Color Blind Filter) to ensure that the content you create is usable by all of your customers.
Review
- Define genetic traits and simple inheritance.
- Explain why autosomal and X-linked traits have different patterns of inheritance.
- What is a pedigree, and why is it useful for studying how traits are passed from one generation to the next?
- What is a Punnett square, and what does it show?
- Identify examples of human autosomal and X-linked traits.
- Imagine a hypothetical human gene that has two alleles, Q and q. Q is dominant to q and the inheritance of this gene is simple. Answer the following questions about this gene.
- If a woman has the genotype Qq and her partner has the genotype QQ, list each of their possible gametes and what proportion of their gametes will have each allele.
- What are the likely proportions of their offspring being QQ, Qq, or qq?
- Is this an autosomal trait or an X-linked trait? How do you know?
- What are the chances of their offspring exhibiting the dominant Q trait? Explain your answer.
- Explain why fathers always pass their X chromosome down to their daughters.
- True or False. Women are more likely to have X-linked diseases than men.
- True or False. Most human autosomal traits are controlled by a single gene with two alleles, similar to Mendel’s pea plants.
- For each of the scenarios below, choose whether you would use a Punnett square or a pedigree. Choose only the one that best fits the scenario.
- A man and a woman have known genotypes and you want to predict the possible genotypes of their offspring.
- You want to document which members of your family had or have breast cancer.
Explore More
Attributions
- Young woman with dimples by I'm so bored, CC BY-SA 3.0 via Wikimedia Commons
- Autosomal dominant pedigree by Jerome Walker, CC BY-SA 3.0 via Wikimedia Commons
- Autosomal recessive pedigree by Jerome Walker, CC BY-SA 3.0 via Wikimedia Commons
- Punnett by miguelferig dedicated CC0 via Wikimedia Commons
- Punnett square by Mariana Ruiz Villarreal (LadyofHats), CC BY-NC 3.0 via CK-12
- Dihybrid Cross by CNX OpenStax, licensed CC BY 4.0 via Wikimedia Commons
- Widow's peak created by Mandeep Grewal licensed CC BY-SA 4.0, from the pictures
- Male Widows Peak by Jmblock2 licensed CC BY-SA 4.0 via Wikimedia Commons
- Omer Mor by Omer Mor licensed CC BY-SA 4.0 via Wikimedia Commons
- Freckles by Ayo Ogunseinde, via Unsplash license
- X and Y chromosomes by Maria Jackson, Leah Marks, Gerhard May, and Joanna Wilson licensed CC BY-NC-ND 4.0 via Research Gate
- Colorblindness pedigree by Jodi So, CC BY-NC 3.0 via CK-12
- Ishara public domain via Wikimedia Commons
- Text adapted from Human Biology by CK-12 licensed CC BY-NC 3.0