4.3.2: Enzymes
- Last updated
- Save as PDF
- Page ID
- 102615
By 1941, their studies correlating mutations with enzyme deficiencies in Neurospora crassa (bread mold) and Drosophila melanogaster led George Beadle and Edward Tatum to propose the one-gene/one-enzyme hypothesis in 1941. In 1958, they shared Nobel Prize in Physiology and Medicine for this work. By the time of the award, their hypothesis had morphed twice: first into the one-gene/one-protein, and then the one-gene/one- polypeptide hypothesis. This rightfully revered history helped launch the age of molecular biology, making the discovery of RNA catalysts quite a surprise! The discovery of RNA catalysts, dubbed ribozymes, earned Sidney Altman and Thomas Cech the Nobel Prize in Chemistry in 1989. Ribozymes are now known that catalyze RNA splicing (the removal of unwanted regions of a precursor RNA. Ribozymes are also associated with a region of ribosomal RNA, where they participate in the catalysis of protein synthesis. Here, the focus here is based on the long history of protein enzyme catalysis, but you should recognize the mechanisms of enzyme catalytic mechanisms to be discussed involve essential features in all biocatalysts.
Enzymes are generally soluble in or outside cells while a few are part of membranes or other cellular structures. In all cases, they bind to soluble substrates (the reactants in enzyme-catalyzed reactions). The large size and exquisite diversity of protein structures make enzymes highly specific catalysts. The specificity of an enzyme results from the shape of the active site of the enzyme, which is dependent on the three-dimensional arrangement of amino acids in and around the region. The substrates of a catalyzed biochemical reaction are bound to, and held in place on the enzyme while rapid bond rearrangements take place. Because of their flexibility, enzymes undergo change in shape at the active site during catalysis itself. In addition, this flexibility enables small metabolites in cells to interact with and change the shapes of many enzymes. The latter phenomenon enables allosteric regulation, allowing cells to control the rates and even the direction of biochemical reactions and pathways. As we will see, enzymes may also be bound to prosthetic groups or ions that contribute to the shape and activity of the enzyme.
Almost no chemical reaction occurs that is not directly the result of enzyme catalysis, from the digestion of nutrients in your mouth, stomach and small intestines to pretty much every chemical reaction inside your cells [check out Kornberg A (1989) Never a Dull Enzyme. Ann. Rev. Biochem. 58:1-30].
A. The Mechanisms of Enzyme Catalysis
We describe the action of biological catalysis in two ways. One way takes into account structural features of the enzyme (active site shape, overall conformation, the affinities of the enzyme for its substrates). The other way involves the energetic of enzyme action. We’ll see that enzymes lower the activation energy of a chemical reaction. Activation energy is an inherent energy barrier to the reaction. Of course, structural and energy considerations of enzyme catalysis are related.
1. Structural Considerations of Catalysis
From a chemistry course, you may recall that the rate of an uncatalyzed reaction is dependent on the concentration of the reactants in solution. This is the Law of Mass Action, recognized in the 19th century. Look at this simple reaction:
\[\ce{A + B <=> C + D}\]
The Law of Mass Action makes two key assumptions:
- At any given time following the start of the reaction, the rate of product formation is proportional to the concentrations of the reactants and products ([A], [B], [C] and [D] in this case).
- Chemical reactions in the laboratory eventually reach equilibrium, at which point the net rate of formation of reaction products is zero (i.e., the forward and reverse reactions occur at the same rate).
At the start of the reaction written above, since there are no products yet, the reaction rate should be directly proportional only to the concentration of the reactants. Therefore, the Law of Mass Action predicts that a chemical reaction will occur faster at higher concentrations of A & B. This is because there are more reactant molecules in solution and a greater likelihood that they will collide in an orientation that allows the bond rearrangements for the reaction to occur.
Of course, reactant concentrations decline as products accumulate over time. Then the rate of formation of C & D should slows down, now affected by product as well as reactant concentrations; remember, all chemical reactions are inherently reversible! You may recognize the chemical rate equations from a chemistry course; these enable quantitation of reaction rates for our sample reaction. Here is the rate of formation of the products, C and D:
\[\text{Rate of formation of products (C & D)} = \mathrm{k_1[A][B] – k_{-1}[C][D]}\]
This equation recognizes that the reaction is reversible. Thus, the net reaction rate is equal to the rate of the forward reaction \(\ce{k_1[A][B]}\) minus the rate of the back reaction \(\ce{k_{-1}[C][D]}\). The equation is valid (applicable) at any time during the reaction. \(\ce{k_1}\) and \(\ce{k_{-1}}\) are rate constants for the forward and reverse reactions, respectively.
So how do catalysts work? Catalysts increase chemical reaction rates by bringing reactants together more rapidly than they would encounter each other based just on random molecular motion in solution. This is possible because catalysts have an affinity for their substrates.
In the case of inorganic catalysts, relatively weak, generic forces account for the affinity of reactants and inorganic catalysts. Thus, a metallic catalyst (e.g., silver, platinum) attracts molecules with the appropriate (e.g., charge) configuration. If the attraction (affinity) is sufficient, the metal will hold reactants in place long enough to catalyze the bond rearrangements of a chemical reaction.
Unlike inorganic catalysts, enzymes have evolved highly specific shapes with physical-chemical properties. As a result, enzymes typically attract only the substrates necessary for a particular biochemical reaction. The active site of an enzyme has the exquisitely selective affinity for its substrate(s). This affinity is many times greater than those of inorganic catalysts for generic reactants. The result is that enzymes are more efficient, faster catalysts.
Early ideas of how substrate-enzyme interaction could be so specific suggested a Lock and Key mechanism, illustrated below.
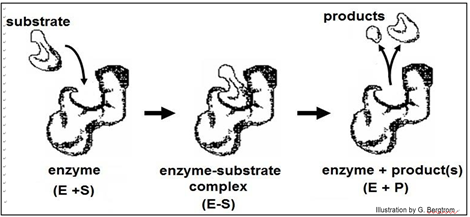
According to this model, the affinity of enzyme for substrate brings them together, after which the substrate uniquely fits into the active site like a key into a lock. Once in the active site, the substrate(s) would undergo the bond rearrangements specific for the catalyzed reaction to generate products and regenerate an unchanged enzyme. But X-ray crystallography of enzyme-substrate interaction revealed that the active site of the enzyme changes shape during catalysis. This allosteric change suggested the revised, Induced Fit mechanism of enzyme action modeled below.
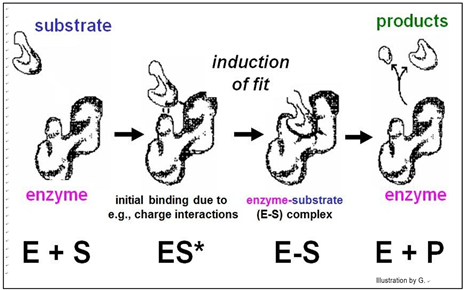
In this model, enzyme-substrate affinity causes the substrate to bind to the enzyme surface. Once bound, the enzyme undergoes an allosteric change, drawing the substrate(s) more tightly into the active site and catalyzing the reaction. Of course, after the reaction products come off, the enzyme returns to its original shape.
2. Energetic Considerations of Catalysis
Catalysts work by lowering the activation energy (Ea) for a reaction, thereby dramatically increasing the rate of the reaction. Activation energy is essentially a barrier to getting interacting substrates together to actually undergo a biochemical reaction. Compare the random motion of substrates in solution that occasionally encounter one another. They even more rarely bump into one another in just the right way to cause a reaction. This explains why adding more reactants or increasing the temperature of a reaction can speed it up…, by increasing the number of random as well as productive molecular collisions. Unlike molecules and reactions in a test tube, living organisms do not have these options for conducting fast biochemical reactions, or controlling reaction rates.
Inorganic catalytic surfaces attract reactants where catalysis can occur. The attractions are weak compared to those of enzymes and their substrates. An enzyme’s active site attracts otherwise randomly distributed substrates very strongly, making enzyme catalysis faster than inorganic catalysis. Again, cells cannot use inorganic catalysts, most of which are insoluble and would attract reactants indiscriminately... not a good way for cells to control metabolism! The advent of enzymes with their specificity and high rate of catalysis was a key event in chemical evolution required for the origins of life. As we saw, allosteric change during the ‘induction of fit’ enables specific catalysis. In fact, a catalyzed reaction will be faster than the same reaction catalyzed by a piece of metal, and of course much faster (millions of times faster!) than the uncatalyzed reaction. The energetic of catalysis helps to explain why. Take a look at the energetic of a simple reaction in which A & B are converted to C & D, shown below.
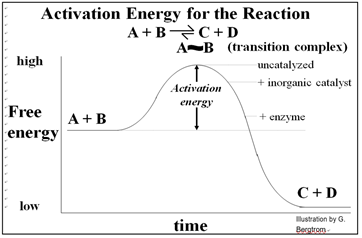
Conducted in a closed system, enzyme-catalyzed reactions reach their equilibrium more rapidly. As with all catalysts, enzymes are not consumed by the reactions they catalyze, nor do they alter the equilibrium concentrations of reactants and products of these reactions. The roughly 4000 biochemical reactions known to be catalyzed in cells are undoubtedly an underestimate! But remember too, that we estimate that the human genome has only 20,000 to 25,000 different genes!
B. Enzyme Regulation
We noted that some enzymes are regulated, which just means that factors in the cell can slow down or speed up their rate of catalysis. In this way, the cell can respond quickly to metabolic needs reflected by the intracellular levels of these factors. Factors that slow down catalysis are called inhibitors. Those that speed up catalysis are called activators. In addition to responding to intracellular molecular indicators of the metabolic status of the cell, enzymes may be inhibited by drugs, poisons or changes in the chemical milieu (e.g. pH). Since cellular reactions occur as part of biochemical pathways, regulating a single enzyme can affect an entire pathway. For example, look at the generic pathway illustrated below.
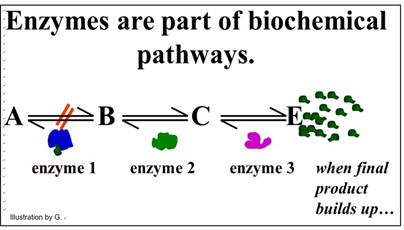
This pathway exists to produce substance E. Under normal conditions, another series of metabolic reactions would consume E. However, if the cell is meeting its metabolic needs and no longer needs so much E, it will accumulate in the cell. If there is an excess of E in the cell, it might bind to one of the enzymes. In the pathway shown, E binds to enzyme 1. This binding causes an allosteric change inhibiting catalysis and slowing down the entire pathway. In this example, of allosteric regulation, we can assume that inhibitory regulation of enzyme 1 evolved to control the rate of production of substance E. This is a common mode of enzyme allosteric regulation, called feedback inhibition.
Enzymes can be regulated precisely because they can be bent out of shape (or into shape for that matter!). Some small metabolites become chemical information when they accumulate in cells, becoming the indicators of cellular metabolic status. The result is a decrease or increase enzyme activities to achieve an appropriate cellular response.
Whether an activator or an inhibitor of enzyme catalysis, regulatory molecules typically bind to enzymes at allosteric regulatory sites, causing local allosteric changes that is transmitted to the active site. Enzyme inhibition will occur if a change in shape reduces the affinity of enzyme for substrate or the rate of the bond rearrangements after the substrate has entered the active site. Enzyme activation would occur if the allosteric effect were to increase this affinity and/or catalytic rate. The mechanism of allosteric regulation of enzyme activity is illustrated below.
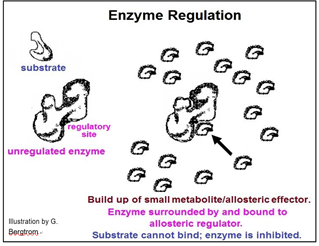
We can understand the effects changing rates of enzyme catalysis by determining enzyme kinetics. By comparing kinetic data for each enzyme in a biochemical pathway, one can determine a standard rate-limiting reaction under a given set of conditions. For example, if clinical tests reveal that a patient is producing too much of a biochemical metabolite, then the catalytic rate of the normally rate-limiting enzyme in its pathway of synthesis may have increased. What then, if the patient is producing too little of the metabolite? Either the catalytic rate of the rate-limiting enzyme has decreased or the catalytic rate of another enzyme in the biochemical pathway has become rate limiting. Reasons why a cellular biochemical would deviate from ‘normal’ levels include:
- Viral & bacterial infection or environmental poisons: these can interfere with a specific reaction in a metabolic pathway; remedies depend on this information!
- Chronic illness resulting from mutational enzyme deficiencies: treatments might include medications designed to enhance or inhibit (as appropriate) enzyme activity.
- Genetic illness tied to metabolic deficiency: if a specific enzyme is the culprit, investigation of a pre- and/or post-natal course of treatment might be possible.
- Life-style changes and choices: these might include eating habits, usually remediated by a change in diet.
- Life-Style changes brought on by circumstance rather than choice: these are changes due to aging, such as the possibility of onset of Type 2 Diabetes; this can be delayed by switching to a low carb diet favoring hormonal changes that improve proper sugar metabolism.
Knowing the rate-limiting reaction(s) in biochemical pathways can identify regulated enzymes and lead to a remedy to correct a metabolic imbalance. As noted, ribozymes are RNA molecules that catalyze biochemical reactions; their kinetics can also be analyzed and classified. Next, we look at an overview of enzyme kinetics (for clear, detailed explanations of enzyme catalytic mechanisms, check out Jencks WP [1987, Catalysis in Chemistry and Enzymology. Mineola, NY, Courier Dover Publications]). We will consider how enzymes are regulated later, when we discuss glycolysis, a biochemical pathway that most living things use to extract energy from nutrients.
C. Enzyme Kinetics
All catalyzed chemical reactions display saturation kinetics, as shown below.
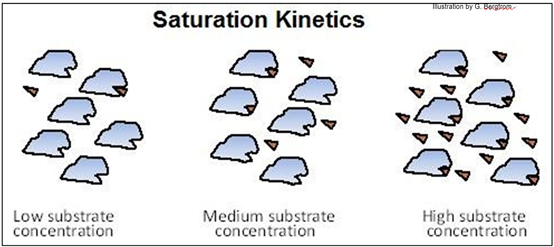
Note how at high substrate concentration, the active sites on all the enzyme molecules are bound to substrate molecules.
The experiment described below will determine the kinetics of the conversion of S to P by enzyme E.
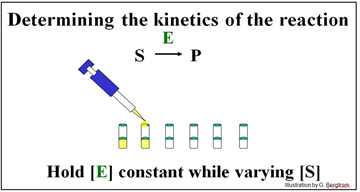
A series of reaction tubes are set up, each containing the same concentration of enzyme ([E]) but different concentrations of substrate ([S]). The concentration of P ([P]) produced at different times just after the start of the reaction in each tube is plotted to determine the initial rate of P formation for each concentration of substrate tested (see below).
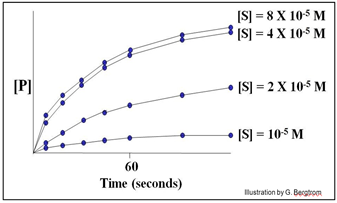
In this hypothetical example, the rates of the reactions (amount of P made over time) do not increase at substrate concentrations higher than 4 X10⁻⁵ M. The upper curves therefore represent the maximal rate of the reaction at the experimental concentration of enzyme. We say that the maximal reaction rate occurs at saturation.
Next, we can estimate the initial reaction rate (vo) at each substrate concentration by plotting the slope of the first few time points through the origin of each curve in the graph. Consider the graph below, of the initial reaction rates estimated in this way.
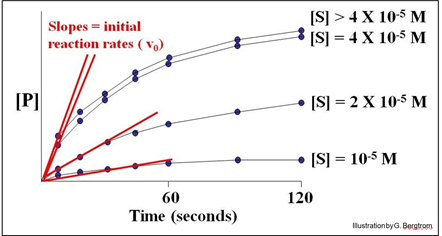
Each straight line is the vo for the reaction at a different [S] near the very beginning of the reaction, when [S] is high and [P] is vanishingly low. Next, we plot these rates (slopes, or vo values) against the different concentrations of S in the experiment to get the curve of the reaction kinetics below.
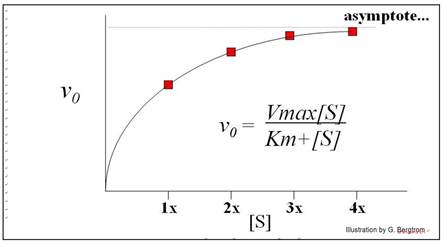
This is an example of Michaelis-Menten kinetics common to many enzymes, named after the two biochemists who realized that the curve described rectangular hyperbola.
Put another way, the equation mathematically describes the mechanism of catalysis of the enzyme. The equation below mathematically describes a rectangular hyperbola:
\[\mathrm{y = \dfrac{xa}{x + b}}\]
You might be asked to understand the derivation of (or even derive!) the Michaelis- Menten equation in a Biochemistry course. Suffice it to say here that Michaelis and Menten started with some simple assumptions about how an enzyme-catalyzed reaction would proceed and wrote reasonable chemical and rate equations for those reactions. Here is one way to write the chemical equation for a simple reaction in which an enzyme (E) catalyzes the conversion of substrate (S) to product (P):
\[\ce{S<=>[][E] P}\]
Michaelis and Menten rationalized that this reaction might actually proceed in three steps. In each step, E, the enzyme is treated as a reactant in the conversion of S to P. The resulting chemical equations are shown below.

Reasoning that the middle reaction (the conversion of E-S to E-P) would be the fastest one, and therefore would not be the rate-limiting reaction of catalysis, they only considered the first and third reactions to be relevant in determining the overall kinetics of product formation. Then they wrote the following rate equations for just these two chemical reactions (as one would in an introductory chemistry course):
\[V_\text{E-S formation}=\mathrm{k_{1}[E][S]-k_{-1}[\text{E-S}]}\]
\[V_\text{P formation}=\mathrm{k_2[\text{E-S}]-k_{-2}[E][P]}\]
Both of these equations describe a straight line, which does not describe the observed hyperbolic reaction kinetics. Solving one for e.g., E-S and substituting the solution for E-S in the other equation left a single equation that also described a straight line. Again, not the expected rectangular hyperbola. To arrive at a chemical rate equation consistent with a rectangular hyperbola, Michaelis and Menten made several assumptions, including those made by G. E. Briggs and J. B. S. Haldane about how E, S and P would behave in a catalyzed reaction.
It was those assumptions allowed them to re-write each equation, combine and rewrite them into a single mathematical equation that did indeed describe a rectangular hyperbola. Here are Briggs and Haldane’s assumptions:

We have already seen the equation that Michaelis and Menten derived and now known as the Michaelis-Menten equation:
\[\mathrm{v_0 = \dfrac{Vmax[S]}{Km + [S]}}\]
The take-home message here is that the assumptions about an enzyme-catalyzed reaction are a good approximation of how the reaction proceeds over time.
Michaelis and Menten defined Vmax and Km as key kinetic factors in enzymatic reactions. In the generic example of substrate conversion to product, we saw that increasing [S] results in a higher rate of product formation because a higher rate of encounters of enzyme and substrate molecules. At some point however, increasing [S] does not increase the initial reaction rate any further. Instead, vo asymptotically approaches a theoretical maximum for the reaction, defined as Vmax, the maximum initial rate. As we have already seen, Vmax occurs when all available enzyme active sites are saturated (occupied by substrate). At this point, the intrinsic catalytic rate determines the turnover rate of the enzyme. The substrate concentration at which the reaction rate has reached ½Vmax is defined as KM (the Michaelis-Menten constant). The Km is a ratio of rate constants remaining after rewriting the rate equations for the catalyzed reaction.
To recapitulate, the two most important kinetic properties of an enzyme are:
1. how quickly the enzyme becomes saturated with a particular substrate, which is related to the Km for the reaction, and
2. the maximum rate of the catalyzed reaction, described by the Vmax for the reaction.
Knowing these properties suggests how an enzyme might behave under cellular conditions, and can show how the enzyme should respond to allosteric regulation by natural inhibitory or activating factors…, and to poisons or other anomalous chemicals. You can find more details of how kinetic equations are derived (a necessary step in understanding how the enzyme works) in any good biochemistry textbook, or check out the Michaelis-Menten Kinetics entry in in the Enzymes Wikipedia link.


