Biology LibreTexts

24.7: Introduction to Human Populations

  • Page ID
    22641
  • \( \newcommand{\vecs}[1]{\overset { \scriptstyle \rightharpoonup} {\mathbf{#1}} } \)

    \( \newcommand{\vecd}[1]{\overset{-\!-\!\rightharpoonup}{\vphantom{a}\smash {#1}}} \)

    \( \newcommand{\id}{\mathrm{id}}\) \( \newcommand{\Span}{\mathrm{span}}\)

    ( \newcommand{\kernel}{\mathrm{null}\,}\) \( \newcommand{\range}{\mathrm{range}\,}\)

    \( \newcommand{\RealPart}{\mathrm{Re}}\) \( \newcommand{\ImaginaryPart}{\mathrm{Im}}\)

    \( \newcommand{\Argument}{\mathrm{Arg}}\) \( \newcommand{\norm}[1]{\| #1 \|}\)

    \( \newcommand{\inner}[2]{\langle #1, #2 \rangle}\)

    \( \newcommand{\Span}{\mathrm{span}}\)

    \( \newcommand{\id}{\mathrm{id}}\)

    \( \newcommand{\Span}{\mathrm{span}}\)

    \( \newcommand{\kernel}{\mathrm{null}\,}\)

    \( \newcommand{\range}{\mathrm{range}\,}\)

    \( \newcommand{\RealPart}{\mathrm{Re}}\)

    \( \newcommand{\ImaginaryPart}{\mathrm{Im}}\)

    \( \newcommand{\Argument}{\mathrm{Arg}}\)

    \( \newcommand{\norm}[1]{\| #1 \|}\)

    \( \newcommand{\inner}[2]{\langle #1, #2 \rangle}\)

    \( \newcommand{\Span}{\mathrm{span}}\) \( \newcommand{\AA}{\unicode[.8,0]{x212B}}\)

    \( \newcommand{\vectorA}[1]{\vec{#1}}      % arrow\)

    \( \newcommand{\vectorAt}[1]{\vec{\text{#1}}}      % arrow\)

    \( \newcommand{\vectorB}[1]{\overset { \scriptstyle \rightharpoonup} {\mathbf{#1}} } \)

    \( \newcommand{\vectorC}[1]{\textbf{#1}} \)

    \( \newcommand{\vectorD}[1]{\overrightarrow{#1}} \)

    \( \newcommand{\vectorDt}[1]{\overrightarrow{\text{#1}}} \)

    \( \newcommand{\vectE}[1]{\overset{-\!-\!\rightharpoonup}{\vphantom{a}\smash{\mathbf {#1}}}} \)

    \( \newcommand{\vecs}[1]{\overset { \scriptstyle \rightharpoonup} {\mathbf{#1}} } \)

    \( \newcommand{\vecd}[1]{\overset{-\!-\!\rightharpoonup}{\vphantom{a}\smash {#1}}} \)

    \(\newcommand{\avec}{\mathbf a}\) \(\newcommand{\bvec}{\mathbf b}\) \(\newcommand{\cvec}{\mathbf c}\) \(\newcommand{\dvec}{\mathbf d}\) \(\newcommand{\dtil}{\widetilde{\mathbf d}}\) \(\newcommand{\evec}{\mathbf e}\) \(\newcommand{\fvec}{\mathbf f}\) \(\newcommand{\nvec}{\mathbf n}\) \(\newcommand{\pvec}{\mathbf p}\) \(\newcommand{\qvec}{\mathbf q}\) \(\newcommand{\svec}{\mathbf s}\) \(\newcommand{\tvec}{\mathbf t}\) \(\newcommand{\uvec}{\mathbf u}\) \(\newcommand{\vvec}{\mathbf v}\) \(\newcommand{\wvec}{\mathbf w}\) \(\newcommand{\xvec}{\mathbf x}\) \(\newcommand{\yvec}{\mathbf y}\) \(\newcommand{\zvec}{\mathbf z}\) \(\newcommand{\rvec}{\mathbf r}\) \(\newcommand{\mvec}{\mathbf m}\) \(\newcommand{\zerovec}{\mathbf 0}\) \(\newcommand{\onevec}{\mathbf 1}\) \(\newcommand{\real}{\mathbb R}\) \(\newcommand{\twovec}[2]{\left[\begin{array}{r}#1 \\ #2 \end{array}\right]}\) \(\newcommand{\ctwovec}[2]{\left[\begin{array}{c}#1 \\ #2 \end{array}\right]}\) \(\newcommand{\threevec}[3]{\left[\begin{array}{r}#1 \\ #2 \\ #3 \end{array}\right]}\) \(\newcommand{\cthreevec}[3]{\left[\begin{array}{c}#1 \\ #2 \\ #3 \end{array}\right]}\) \(\newcommand{\fourvec}[4]{\left[\begin{array}{r}#1 \\ #2 \\ #3 \\ #4 \end{array}\right]}\) \(\newcommand{\cfourvec}[4]{\left[\begin{array}{c}#1 \\ #2 \\ #3 \\ #4 \end{array}\right]}\) \(\newcommand{\fivevec}[5]{\left[\begin{array}{r}#1 \\ #2 \\ #3 \\ #4 \\ #5 \\ \end{array}\right]}\) \(\newcommand{\cfivevec}[5]{\left[\begin{array}{c}#1 \\ #2 \\ #3 \\ #4 \\ #5 \\ \end{array}\right]}\) \(\newcommand{\mattwo}[4]{\left[\begin{array}{rr}#1 \amp #2 \\ #3 \amp #4 \\ \end{array}\right]}\) \(\newcommand{\laspan}[1]{\text{Span}\{#1\}}\) \(\newcommand{\bcal}{\cal B}\) \(\newcommand{\ccal}{\cal C}\) \(\newcommand{\scal}{\cal S}\) \(\newcommand{\wcal}{\cal W}\) \(\newcommand{\ecal}{\cal E}\) \(\newcommand{\coords}[2]{\left\{#1\right\}_{#2}}\) \(\newcommand{\gray}[1]{\color{gray}{#1}}\) \(\newcommand{\lgray}[1]{\color{lightgray}{#1}}\) \(\newcommand{\rank}{\operatorname{rank}}\) \(\newcommand{\row}{\text{Row}}\) \(\newcommand{\col}{\text{Col}}\) \(\renewcommand{\row}{\text{Row}}\) \(\newcommand{\nul}{\text{Nul}}\) \(\newcommand{\var}{\text{Var}}\) \(\newcommand{\corr}{\text{corr}}\) \(\newcommand{\len}[1]{\left|#1\right|}\) \(\newcommand{\bbar}{\overline{\bvec}}\) \(\newcommand{\bhat}{\widehat{\bvec}}\) \(\newcommand{\bperp}{\bvec^\perp}\) \(\newcommand{\xhat}{\widehat{\xvec}}\) \(\newcommand{\vhat}{\widehat{\vvec}}\) \(\newcommand{\uhat}{\widehat{\uvec}}\) \(\newcommand{\what}{\widehat{\wvec}}\) \(\newcommand{\Sighat}{\widehat{\Sigma}}\) \(\newcommand{\lt}{<}\) \(\newcommand{\gt}{>}\) \(\newcommand{\amp}{&}\) \(\definecolor{fillinmathshade}{gray}{0.9}\)
    growing like a weed

    It’s been called the world’s most successful weed species because it has grown so quickly in numbers and spread so far geographically. Everywhere this species has gone, it has taken over local ecosystems. Is the species in question a weedy plant like the dandelions pictured in Figure \(\PageIndex{1}\)? No; that dubious honor has been given to our own species, Homo sapiens.

    weed flower
    Figure \(\PageIndex{1}\): Dandelion

    So Many People

    Our species is relatively young, with the earliest modern humans dating back only to about 200,000 years ago. However, in a relatively short period of time since then, a total of about 108 billion people have lived on planet Earth. More than 7 percent of them, or an estimated 7.6 billion people, were alive in September 2019. The number of humans on the planet is projected to increase to at least 9 billion by 2050 and could reach 11 billion or more by 2100! The human species also currently lives on every continent. Six of Earth’s seven continents are permanently inhabited on a large scale. Only Antarctica is sparsely inhabited and without permanent settlements.

    The rapid increase and spread of the human population have raised concerns about our continued existence as a species. Some thinkers have speculated that continued rapid increase in human numbers will sooner or later outstrip the resources available on planet Earth and lead to a population catastrophe. Some scientists think we have a long way to go before that happens. Others think we have already exceeded our limit, citing evidence of widespread environmental damage caused by human actions and the more than 1 billion people in the world who live in extreme poverty.

    Studying the Human Population

    We know more about the human population and how it has grown than we know about the population of any other species thanks to demography, which is the scientific study of human populations. Demography encompasses the size, distribution, and structure of populations. Population structure is the proportion of people by age, sex, and, often, by other parameters as well, such as ethnicity or education. Demography also encompasses population processes that change population size and structure, including births, deaths, and migration.

    Demography is considered to be at the crossroads of several disciplines, including sociology, economics, epidemiology, anthropology, and history. Besides studying current populations, demographers reconstruct past population characteristics, such as estimating the world population size 10,000 years ago. Demographers also make predictions about populations in the future, such as how many people will live in cities in 2050. In addition, many demographers study relationships between population characteristics and other factors, such as economic, social, or cultural factors. An example is the youth bulge phenomenon described below.

    Demographic Data

    Demographic data are routinely collected by the governments of most countries. Important sources of demographic data include vital statistics registries. These registries track all births and deaths as well as certain changes in status, such as marriages, divorces, and migrations. Censuses are also important sources of demographic data. They are usually conducted by national governments every 10 years. For example, the United States government has been conducting a national census every 10 years since 1790. A census has the primary goal of counting every person in the country, but it also typically collects information on such variables as age, sex, marital status, education, employment status, and occupation.

    Demographic Measures

    Demographers use data from vital statistics registries and censuses, among other sources, to calculate measures of population characteristics. Some of these measures are useful to know as you read more about human populations below and in other concepts in this chapter. They include the following:

    • birth rate — number of live births in 1 year per 1,000 people in the population
    • death rate number of deaths in 1 year per 1,000 people in the population
    • fertility rate — the average number of live births per woman by the end of the childbearing years
    • replacement fertility rate — fertility rate at which women average only enough children to replace themselves and their partner in the population
    • life expectancy — the average age of death in a population, or the average length of life
    • population growth rate (r) — the net number of people added to a population in 1 year per 100 people already in the population

    Age-Sex Structure

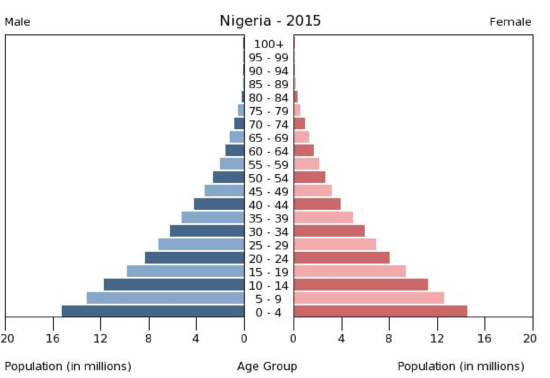
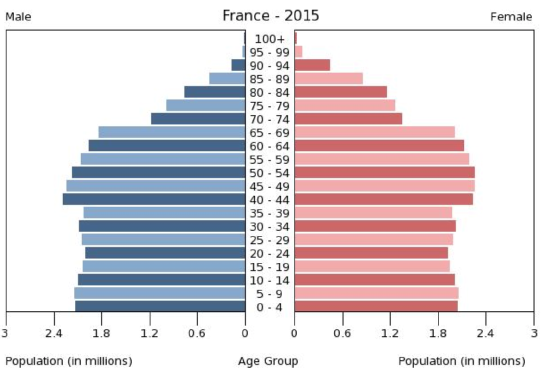
    The age-sex structure of a population is a frequently measured population parameter. It refers to the number of individuals of each sex and age group in the population. The age-sex structure of a population is often represented by a special type of bar graph called a population pyramid. You can see two examples of population pyramids in Figure \(\PageIndex{2}\), the first, on the left, for the sub-Saharan African country of Nigeria and the second, on the right, for France. Both population pyramids represent the age-sex distribution in the year 2015. In each case, the population is distributed along the horizontal axis, with males shown on the left and females on the right. The male and female populations are broken down into 5-year age groups represented as horizontal bars along the vertical axis, with the youngest age groups at the bottom and the oldest at the top.

    Population pyramid of Nigeria 2015
    Population pyramid of France 2015
    Figure \(\PageIndex{2}\): Population pyramids for Nigeria (left) and France (right) in 2015

    A great deal of information about a population can be gleaned from its population pyramid because its shape changes slowly over time based on births and deaths and, in some cases, international migration. Births add people to a population only in the youngest age group, whereas deaths remove people from all age groups of a population. The population pyramid for Nigeria, for example, is actually pyramidal in shape, with a broad base of young children and tapered sides showing rapidly decreasing numbers of people at older ages. This type of pyramid reflects a population that has high birth rates and relatively high death rates. The population pyramid for France, in contrast, has a nonpyramidal shape. The narrow base of children and young adults reflects a relatively low birth rate over the past several decades. The bulge of people in mid-to late-adulthood is evidence of higher birth rates in previous generations (the post-World War II baby boom) coupled with low death rates. The larger proportion of females than males at older ages, which is especially pronounced in the French population pyramid, is due to the higher rates of death of males than females, especially in older age groups. This trend is seen in most human populations.

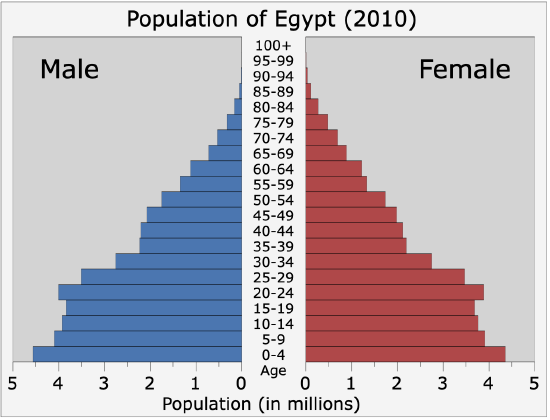
    Population pyramids may also provide insights into political and social stability and economic development. An example of this is the so-called “youth bulge,” which is a disproportionately large cohort of young adults, the age groups when people typically enter the labor force and electorate. As an example, you can see a youth bulge in the 2010 population pyramid for Egypt in Figure \(\PageIndex{3}\). A youth bulge may cause young adults to have high rates of unemployment and social and political alienation. These conditions, in turn, may result in a heightened risk of violence and political instability. A youth bulge has been posited as an important contributor to the rise of fascism in 20th-century Europe, the spread of communism during the Cold War, and the events of the Arab Spring, which began in Egypt in 2011.

    population pyramid of Egypt -2010
    Figure \(\PageIndex{3}\): The 2010 population pyramid for Egypt has a youth bulge in the young adult age groups.

    Review

    1. Why has the human species been called the world’s most successful weed species?
    2. What is demography? What aspects of the population does it study?
    3. Identify and define six common demographic measures.
    4. What is the age-sex structure of a population?
    5. How does a population pyramid represent the age-sex structure of a population?
    6. Explain what can be learned about a population from its population pyramid.

    Attributions

    1. Dandelion by Jakub Kolář, dedicated CC0 via Wikimedia Commons
    2. Population pyramid of Nigeria 2015 by The World Factbook, public domain via Wikimedia Commons
    3. Egypt population by Delphi234, dedicated CC0 via Wikimedia Commons
    4. Text adapted from Human Biology by CK-12 licensed CC BY-NC 3.0

    This page titled 24.7: Introduction to Human Populations is shared under a CK-12 license and was authored, remixed, and/or curated by Suzanne Wakim & Mandeep Grewal via source content that was edited to the style and standards of the LibreTexts platform.

    CK-12 Foundation
    LICENSED UNDER
    CK-12 Foundation is licensed under CK-12 Curriculum Materials License