17.3: Sustainable Cities
- Last updated
- Save as PDF
- Page ID
- 94360

- Melissa Ha and Rachel Schleiger
- Yuba College & Butte College via ASCCC Open Educational Resources Initiative
\( \newcommand{\vecs}[1]{\overset { \scriptstyle \rightharpoonup} {\mathbf{#1}} } \)
\( \newcommand{\vecd}[1]{\overset{-\!-\!\rightharpoonup}{\vphantom{a}\smash {#1}}} \)
\( \newcommand{\dsum}{\displaystyle\sum\limits} \)
\( \newcommand{\dint}{\displaystyle\int\limits} \)
\( \newcommand{\dlim}{\displaystyle\lim\limits} \)
\( \newcommand{\id}{\mathrm{id}}\) \( \newcommand{\Span}{\mathrm{span}}\)
( \newcommand{\kernel}{\mathrm{null}\,}\) \( \newcommand{\range}{\mathrm{range}\,}\)
\( \newcommand{\RealPart}{\mathrm{Re}}\) \( \newcommand{\ImaginaryPart}{\mathrm{Im}}\)
\( \newcommand{\Argument}{\mathrm{Arg}}\) \( \newcommand{\norm}[1]{\| #1 \|}\)
\( \newcommand{\inner}[2]{\langle #1, #2 \rangle}\)
\( \newcommand{\Span}{\mathrm{span}}\)
\( \newcommand{\id}{\mathrm{id}}\)
\( \newcommand{\Span}{\mathrm{span}}\)
\( \newcommand{\kernel}{\mathrm{null}\,}\)
\( \newcommand{\range}{\mathrm{range}\,}\)
\( \newcommand{\RealPart}{\mathrm{Re}}\)
\( \newcommand{\ImaginaryPart}{\mathrm{Im}}\)
\( \newcommand{\Argument}{\mathrm{Arg}}\)
\( \newcommand{\norm}[1]{\| #1 \|}\)
\( \newcommand{\inner}[2]{\langle #1, #2 \rangle}\)
\( \newcommand{\Span}{\mathrm{span}}\) \( \newcommand{\AA}{\unicode[.8,0]{x212B}}\)
\( \newcommand{\vectorA}[1]{\vec{#1}} % arrow\)
\( \newcommand{\vectorAt}[1]{\vec{\text{#1}}} % arrow\)
\( \newcommand{\vectorB}[1]{\overset { \scriptstyle \rightharpoonup} {\mathbf{#1}} } \)
\( \newcommand{\vectorC}[1]{\textbf{#1}} \)
\( \newcommand{\vectorD}[1]{\overrightarrow{#1}} \)
\( \newcommand{\vectorDt}[1]{\overrightarrow{\text{#1}}} \)
\( \newcommand{\vectE}[1]{\overset{-\!-\!\rightharpoonup}{\vphantom{a}\smash{\mathbf {#1}}}} \)
\( \newcommand{\vecs}[1]{\overset { \scriptstyle \rightharpoonup} {\mathbf{#1}} } \)
\(\newcommand{\longvect}{\overrightarrow}\)
\( \newcommand{\vecd}[1]{\overset{-\!-\!\rightharpoonup}{\vphantom{a}\smash {#1}}} \)
\(\newcommand{\avec}{\mathbf a}\) \(\newcommand{\bvec}{\mathbf b}\) \(\newcommand{\cvec}{\mathbf c}\) \(\newcommand{\dvec}{\mathbf d}\) \(\newcommand{\dtil}{\widetilde{\mathbf d}}\) \(\newcommand{\evec}{\mathbf e}\) \(\newcommand{\fvec}{\mathbf f}\) \(\newcommand{\nvec}{\mathbf n}\) \(\newcommand{\pvec}{\mathbf p}\) \(\newcommand{\qvec}{\mathbf q}\) \(\newcommand{\svec}{\mathbf s}\) \(\newcommand{\tvec}{\mathbf t}\) \(\newcommand{\uvec}{\mathbf u}\) \(\newcommand{\vvec}{\mathbf v}\) \(\newcommand{\wvec}{\mathbf w}\) \(\newcommand{\xvec}{\mathbf x}\) \(\newcommand{\yvec}{\mathbf y}\) \(\newcommand{\zvec}{\mathbf z}\) \(\newcommand{\rvec}{\mathbf r}\) \(\newcommand{\mvec}{\mathbf m}\) \(\newcommand{\zerovec}{\mathbf 0}\) \(\newcommand{\onevec}{\mathbf 1}\) \(\newcommand{\real}{\mathbb R}\) \(\newcommand{\twovec}[2]{\left[\begin{array}{r}#1 \\ #2 \end{array}\right]}\) \(\newcommand{\ctwovec}[2]{\left[\begin{array}{c}#1 \\ #2 \end{array}\right]}\) \(\newcommand{\threevec}[3]{\left[\begin{array}{r}#1 \\ #2 \\ #3 \end{array}\right]}\) \(\newcommand{\cthreevec}[3]{\left[\begin{array}{c}#1 \\ #2 \\ #3 \end{array}\right]}\) \(\newcommand{\fourvec}[4]{\left[\begin{array}{r}#1 \\ #2 \\ #3 \\ #4 \end{array}\right]}\) \(\newcommand{\cfourvec}[4]{\left[\begin{array}{c}#1 \\ #2 \\ #3 \\ #4 \end{array}\right]}\) \(\newcommand{\fivevec}[5]{\left[\begin{array}{r}#1 \\ #2 \\ #3 \\ #4 \\ #5 \\ \end{array}\right]}\) \(\newcommand{\cfivevec}[5]{\left[\begin{array}{c}#1 \\ #2 \\ #3 \\ #4 \\ #5 \\ \end{array}\right]}\) \(\newcommand{\mattwo}[4]{\left[\begin{array}{rr}#1 \amp #2 \\ #3 \amp #4 \\ \end{array}\right]}\) \(\newcommand{\laspan}[1]{\text{Span}\{#1\}}\) \(\newcommand{\bcal}{\cal B}\) \(\newcommand{\ccal}{\cal C}\) \(\newcommand{\scal}{\cal S}\) \(\newcommand{\wcal}{\cal W}\) \(\newcommand{\ecal}{\cal E}\) \(\newcommand{\coords}[2]{\left\{#1\right\}_{#2}}\) \(\newcommand{\gray}[1]{\color{gray}{#1}}\) \(\newcommand{\lgray}[1]{\color{lightgray}{#1}}\) \(\newcommand{\rank}{\operatorname{rank}}\) \(\newcommand{\row}{\text{Row}}\) \(\newcommand{\col}{\text{Col}}\) \(\renewcommand{\row}{\text{Row}}\) \(\newcommand{\nul}{\text{Nul}}\) \(\newcommand{\var}{\text{Var}}\) \(\newcommand{\corr}{\text{corr}}\) \(\newcommand{\len}[1]{\left|#1\right|}\) \(\newcommand{\bbar}{\overline{\bvec}}\) \(\newcommand{\bhat}{\widehat{\bvec}}\) \(\newcommand{\bperp}{\bvec^\perp}\) \(\newcommand{\xhat}{\widehat{\xvec}}\) \(\newcommand{\vhat}{\widehat{\vvec}}\) \(\newcommand{\uhat}{\widehat{\uvec}}\) \(\newcommand{\what}{\widehat{\wvec}}\) \(\newcommand{\Sighat}{\widehat{\Sigma}}\) \(\newcommand{\lt}{<}\) \(\newcommand{\gt}{>}\) \(\newcommand{\amp}{&}\) \(\definecolor{fillinmathshade}{gray}{0.9}\)Introduction
Sustainability, from science to philosophy to lifestyle, finds expression in the way we shape our cities. Cities are not just a collection of structures, but rather groups of people living different lifestyles together. When we ask if a lifestyle is sustainable, we’re asking if it can endure. Some archeologists posit that environmental imbalance doomed many failed ancient civilizations. What could the sustainable city look like, how would it function, and how can we avoid an imbalance that will lead to the collapse of our material civilization? While attempting to envision the “sustainable city” we must discern what factors will influence its shape and form in the future.
Throughout history settlement patterns have been set by technology and commerce. Civilizations have produced food, clothing and shelter, and accessed foreign markets to purchase and sell goods. Workers traditionally had to live near their place of occupation, although in modern industrial times advanced transportation systems have enabled us to live quite a distance from where we work. In hindsight we can see how reliance on water and horse-drawn transportation shaped historical civilizations and how this equation was radically altered with the rise of the automobile following World War II.
The urban environment is an example of a complex human-natural system. The resiliency of such systems lies in their capacity to maintain essential organization and function in response to disturbances (of both long and short duration). A complimentary view, inspired by traditional ecological and economic thought focuses on the degree of damage a system can withstand without exhibiting a “regime” shift, defined as a transition that changes the structure and functioning of the system from one state to another as a result of one or more independent factors. Upon exceeding a given threshold, the system shifts to a new alternative state which may not be readily reversed through manipulation of causative factors. In the context of human-natural systems, regime shifts can have significant consequences, and not all shifts are preferred by the human component of the system. To the extent that change of some order is a given property of essentially all dynamic systems, “preferred” resiliency might be viewed as the extent to which human societies can adapt to such shifts with acceptable levels of impacts. Resilient infrastructures, then, are those which most readily facilitate such adaptation. Much of the foregoing discussion also applies to sustainability, with the added constraints of the sustainability paradigm: the equitable and responsible distribution of resources among humans, present and future, in ways that do not harm, and ideally reinforce, the social and biological systems upon which human society is based. Although there are important differences between those two concepts, there remains a close interrelationship that stems from the same need: to understand and design urban infrastructural systems that enhance human interactions with the environment.
So what is the major hindrance for designing/updating for a “sustainable city”?
Sprawl: The outward expansion of human populations (typically in low-density residential and commercial development) into the outer edges of cities/towns.
As sprawl expands, it eats at natural and agricultural lands and isolates people. People have to travel further and further to go to work, the grocery store, a hospital, etcetera. What this means is that cities/towns have to find solutions to moving water, waste, power, services, road development/upkeep, etcetera to these communities. As such, there are chronic issues with sprawl on both sides that make opportunity and progress difficult due to economic constraints.
It’s important to note that sprawl can happen at different scales:
- Low-density sprawl: Small 1-2 story buildings in high densities. Low-density sprawl can be further distinguished by income as neighborhoods tend to be segregated by this. (Ex: North America, (Figure \(\PageIndex{1}\))
- High-density sprawl: High rise buildings in high densities (Ex: China, Figure \(\PageIndex{1}\))
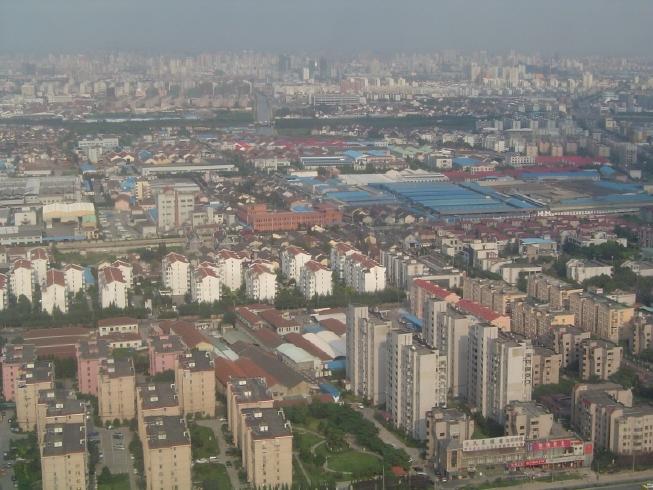
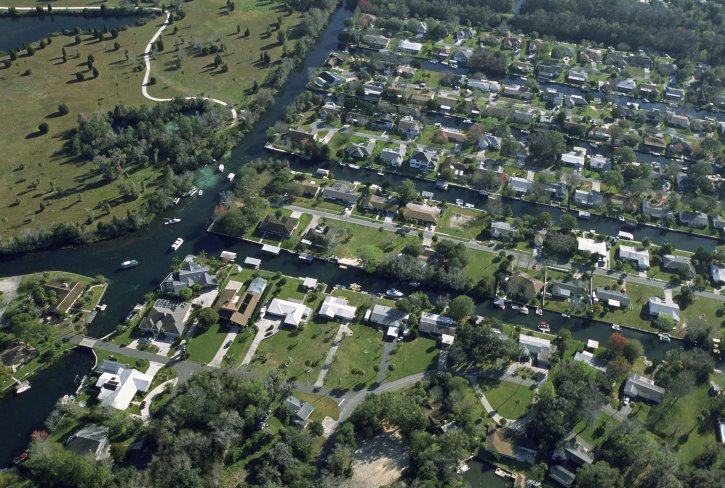
Figure \(\PageIndex{1}\): Left - High density sprawl in Shanghai China by John Patrick Robichaud in Wikimedia Commons (CC-BY), Right - Low density sprawl in North America by Pixnio (Public Domain).
So what can be done to design/update and move towards “sustainable cities”?
- Mixed use development: Lends residential, commercial, cultural, institutional, or industrial uses, where those functions are physically and functionally integrated, and that provides pedestrian connections. Making cities walkable!
- Geographic equity: Circulation system defined by ratios of how people move. This means more bikes, walking, public transportation (in many forms) and not cars. Equitability of the streets!
- Preserve: Preserve land, culture, and biodiversity as much as possible.
- Mix: Mix incomes, cultures, green spaces, public transport options, etcetera as much as possible. Allow people to connect and become neighbors not strangers.
- Focus: Match density of a community to meet transit/service needs.
Public space upgrading through urban renewal programs will bring people back to the city centre. This will need some strategic thinking about how to use brownfield and greyfield developments and also the adaptive reuse of existing buildings. Remodeling and re-energizing existing city centers to bring about diverse and vibrant communities requires people to move back into downtown areas. This can be achieved through mixed-use urban infill projects, building the "city above the city" by converting low density districts into higher density communities; and by revitalizing underutilized land for community benefit and affordable housing.
Video \(\PageIndex{a}\): Perspectives: Peter Calthrope describes 7 principles for building better cities.
Renewable Energy for Zero CO2 Emissions
The various aspects of the principle of renewable energy for zero CO2 emissions include: Energy supply systems and services, as well as energy efficient use and operation, promoting increased use of renewable power, and perhaps natural gas as a transition fuel in the energy mix, but always moving quickly away from heavy fossil-fuels such as coal and oil; and the transformation of the city district from an energy consumer to an energy producer, with local solutions for renewables and the increasing de-carbonizing of the energy supply. The local availability of a renewable source of energy is the first selection criteria for deciding on energy generation. In general, a well-balanced combination of energy sources can sensibly secure future supply. A necessary aim is also to have a distributed energy supply through a decentralized system, utilizing local renewable energy sources. This will transform city districts into local power stations of renewable energy sources, which will include solar photovoltaic, solar thermal, wind (on- and off-shore), biomass, geothermal power, mini-hydro energy and other new technologies. That is to say, there should be on-site electrical generation and energy storage in combination with a smart grid, which integrates local solar and wind generation, utilizing energy-efficiency in all its forms. High building insulation, high energy-efficiency standards and the use of smart metering technology is essential, so that if a part of an office building is not in use, the intelligent building management system will shut down lights and ventilation.
Some of the most promising technologies are in building-integrated photovoltaics, urban wind turbines, micro CHP (combined heat and power) systems and solar cooling. Co-generation technology utilizes waste heat through CHP combined-heat-and-power plants. Energy-efficiency programs are not enough. Too often we find that savings from energy-efficiency programs are absorbed by a rise in energy use. Eco-districts will need to operate on renewable energy sources as close to 100 per cent as possible. As a minimum, at least 50 per cent of on-site renewable energy generation should be the aim of all urban planning, where the energy mix comes from decentralized energy generation and takes into account the resources that are locally available, as well as the cost and the availability of the technology. It is, therefore, essential that the fossil-fuel powered energy and transportation systems currently supporting our cities are rapidly turned into systems that are supplied by renewable energy sources.
Homes use about 23% of all energy in the United States.27 In the future many of our homes will generate their own power (See Case Study: A Net-Zero Energy Home in Urbana, Illinois). Today ultra-efficient homes combine state-of-the-art, energy-efficient construction and appliances with commercially available renewable energy systems, such as solar water heating and solar electricity, so that the net energy use is zero or even less than zero (positive energy production).28 There have been efforts since the 70’s oil crisis to promote (mandatory) energy codes, but voluntary efforts such as Energy Star and LEED are the ones that have made substantial headway.
Zero-Waste
Sustainable waste management means to turn waste into a resource. All cities should adopt nature’s zero-waste management system (See Box below). Zero-waste urban planning includes reducing, recycling, reusing and composting waste to produce energy. All material flows need to be examined and fully understood, and special attention needs to be given to industrial waste and e-waste treatment. We need to plan for recycling centers, for zero landfill and ‘eliminating the concept of waste’ and better understanding nutrient flows. Eco-districts are neighborhoods where we reuse and recycle materials and significantly reduce the volume of solid waste and toxic chemical releases. All construction materials as well as the production of goods (and building components) need to be healthy and fully-recyclable.
Waste prevention is always better than the treatment or cleaning-up after waste is formed. Some other systems that need to be put in place are: the remanufacturing of metals, glass, plastics, paper into new products needs to be a routine (without down-grading the product); waste-to-energy strategies are needed for residual waste; and an `extended producer responsibility’ clause is needed for all products. In this context of waste, better management of the nitrogen cycle has emerged as an important topic: to restore the balance to the nitrogen cycle by developing improved fertilization technologies, and technologies in capturing and recycling waste. Controlling the impact of agriculture on the global cycle of nitrogen is a growing challenge for sustainable development. Essentially, we need to become (again) a recycling society, where it is common that around 60 to 90 per cent of all waste is recycled and composted.
Water
The various aspects of this principle include, in general, reducing water consumption, finding more efficient uses for water resources, ensuring good water quality and the protection of aquatic habitats. The city can be used as a water catchment area by educating the population in water efficiency, promoting rainwater collection and using wastewater recycling and storm water harvesting techniques. Storm water and flood management concepts need to be adopted as part of the urban design, and this includes storm water run-offs and improved drainage systems and the treatment of wastewater. As part of the eco-district’s adequate and affordable health care provisions, it needs to ensure the supply of safe water and sanitation. This includes such things as algae and bio-filtration systems for grey water and improving the quality of our rivers and lakes so that they are fishable and swimmable again. An integrated urban water cycle planning and management system that includes a high-performance infrastructure for sewage recycling (grey and black water recycling), storm water retention and harvesting the substantial run-off through storage, must be a routine in all design projects. On a household level we need to collect rain water and use it sparingly for washing and install dual-water systems and low-flush toilets. On a food production level we need to investigate the development of crops that need less water and are more drought resistant.
Traditional approaches have sought to rapidly move stormwater away from what we’ve built via gutters, sewers and artificial channels. While this approach on the micro scale is intended to prevent local flooding and undesired ponding, on the macro scale it may actually cause area wide flooding. It also short-circuits the opportunity for water to naturally soak into the ground – to water plants and recharge groundwater resources18, and, with traditional planting of lawns and other exotics, necessitates bringing more water in for irrigation. Best water management practices for sustainable cities would include:
- Green Roofs (Figure \(\PageIndex{2}\))
- Downspouts, Rain Barrels and Cisterns
- Permeable Paving
- Natural Landscaping
- Filter Strips
- Bioinfiltration using: Rain Gardens
- Drainage Swales
- Naturalized Detention Basins
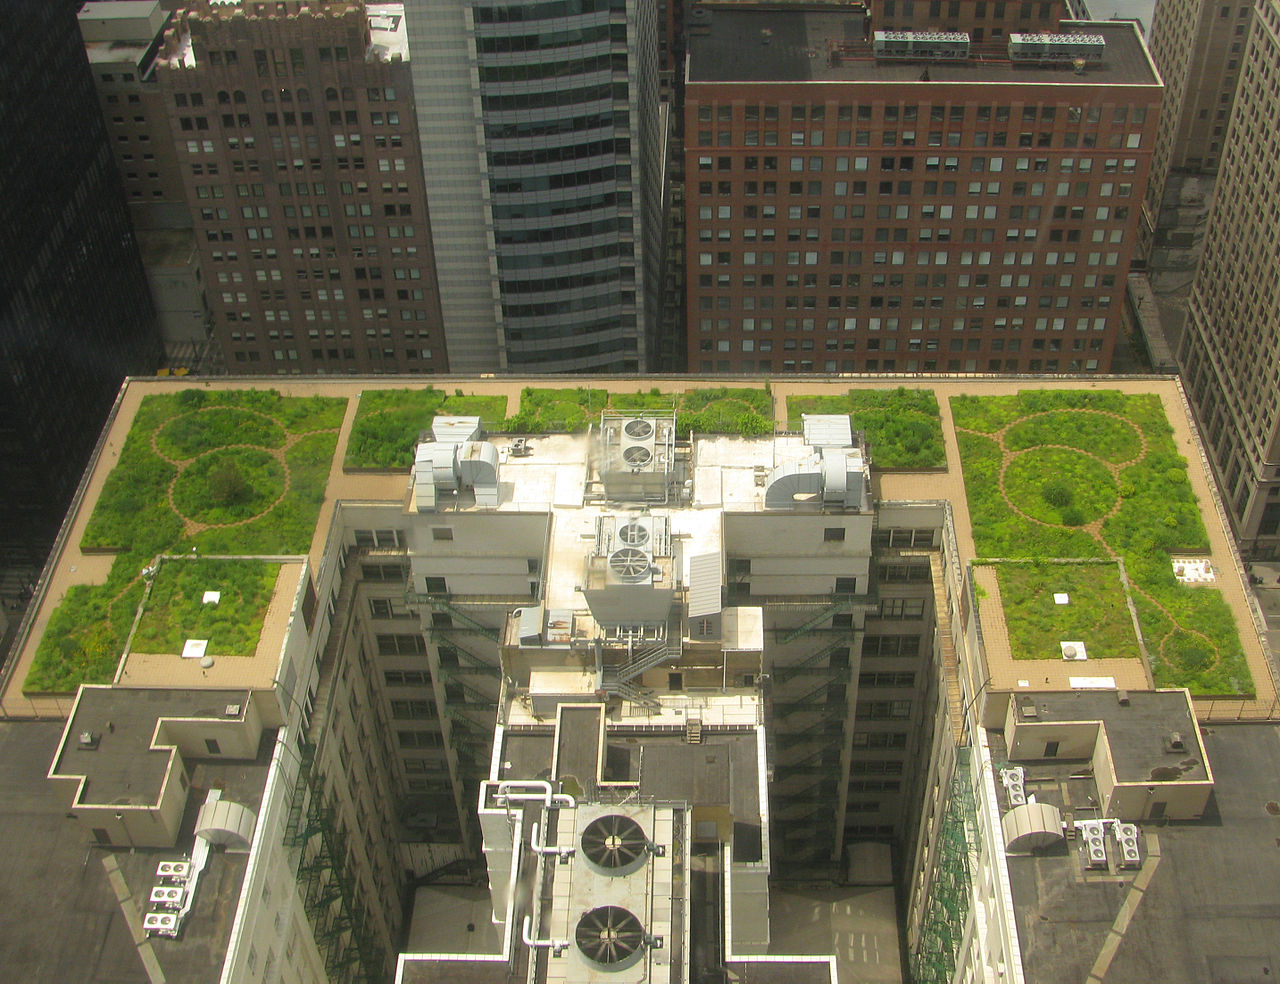
Figure \(\PageIndex{2}\): Green Roof The green roof of City Hall in Chicago, Illinois Source: TonyTheTiger [CC-BY-SA-3.0] via Wikimedia Commons
The sustainable city would recharge its local aquifer and surface water would flow primarily from groundwater and not storm water discharge. Instead of charging a flat tax for storm and sanitary sewer services, technology allows districts to charge usage fees based upon volume, thus providing a financial incentive for sustainable design. Governmental bodies could use these tools to encourage the reorientation and designers could use the techniques outlined above as divert stormwater into the ground rather than directly into surface water.19
Some visionaries see even more dramatic transformations in the way we deal with water. Sarah Dunn and Martin Felsen of Urbanlab envision Chicago’s evolution into a model city for “growing water” by creating a series of Eco-Boulevards that function as a giant Living Machine – treating the city’s waste and storm water naturally, using micro-organisms, small invertebrates such as snails, fish, and plants. Under their plan treated water would be returned to the Great Lakes Basin and create a closed water loop within Chicago, instead of being exported to the Mississippi and Gulf Coast.
Sustainable Transport: Compact and Poly-Centric Cities
Good access to basic transport services is crucial, as it helps to reduce automobile dependency, as does reducing the need to travel. We need to see integrated non-motorized transport, such as cycling or walking, and, consequently, bicycle/pedestrian-friendly environments, with safe bicycle ways, free rental bike schemes and pleasant public spaces. It is important to identify the optimal transport mix that offers inter-connections for public transport and the integration of private and public transport systems. Some ideas here include: eco-mobility concepts and smart infrastructure (electric vehicles); integrated transport systems (bus transit, light railway, bike stations); improved public space networks and connectivity, and a focus on transport-oriented development. It is a fact that more and wider roads result in more car and truck traffic, and CO2 emissions, and also allows for sprawling development and suburbs that increases electricity-demand and provides less green space. The transport sector is responsible for causing significant greenhouse-gas emissions (over 20 per cent). To combat this effect we need to change our lifestyles by, for example, taking public transport, driving the car less, or car-pooling. Alternatively, we can ride a bike or walk, if the city district has been designed for it. Personal arrangements have the potential to reduce commuting and to boost community spirit. We want a city district which is well-connected for pedestrians, a city with streetscapes that encourage a healthy, active lifestyle and where residents travel less and less by car.
Charge Full Costs
The economist Anthony Downs has written that traffic jams during rush hour are a good thing, because they indicate that infrastructure is useful and a lot of people are using it (Downs, 1992). He also notes that building more lanes on a highway is not a solution to congestion, because people who were staying away from the road during rush hour (by traveling at different times, along different routes, or by a different mode) will now start to use the wider road, and it will become just as congested as it was before it was widened. His point is that the road itself is a resource, and when people are using it for free, they will overuse it. If instead, variable tolls were charged depending on how crowded the road was—in other words, how much empty pavement is available—people would choose to either pay the toll (which could then be invested in alternative routes or modes) or stay off the road during congested times. The point is that every car on the road is taking up space that they aren't paying for and therefore slowing down the other people around them; charging a small amount for that space is one way of recovering costs.

Traffic congestion is an example of what economists call externalities, the costs of an activity that aren't paid by the person doing the activity. Suburbanites who drive into the city every day don't breathe the polluted air produced by their cars; urban residents suffer that externality. People around the country who use gasoline derived from oil wells in the Gulf of Mexico didn't experience oil washing up on their beaches after the BP disaster in 2010. By charging the full cost of travel via taxes on gas or insurance, we could, for example, pay for children's hospitalization for asthma caused by the cars speeding past their neighborhoods. Or we could purchase and preserve wetland areas that can absorb the floodwaters that run off of paved streets and parking lots, keeping people's basements and yards drier. Not only would this help to deal with some of the externalities that currently exist, but the higher cost of gas would probably lead us to focus on accessibility rather than mobility, reducing overall demand.
Walkability
Most agree that walkability is a key component of any sustainable neighborhood. Walkability not only reduces energy use, but also increases public health. How can we measure walkability? Walkscore.com identifies and measures nearby amenities and provides a rating for specific locations and neighborhoods. Try it for where you live.
Sustainable cities could consist of walkable neighborhoods that separate pedestrian, bike and vehicular traffic and are connected to each other through multiple transportation modes, with biking and mass transit choices in addition to the automobile. Instead of averaging 10 (auto) trips per unit per day15 most residents would not use an automobile daily and instead walk or bike or order online. Trip generation would be reduced through telework and ecommerce. Goods would be brought to residents in bulk delivery trucks using services like UPS, Fedex and Peapod. Under telework many would only visit an office to attend meetings once or twice a week (or less). Streets and intersections would be made less daunting to pedestrians through traffic calming techniques.
Most trips to other parts of the city would be made via mass transit. When an individual car is need it would be provided through car sharing, or taxis. Traffic congestion would be relieved not through artificial subsidies (overbuilding roads and providing free parking) but through congestion pricing, removal of free street parking, and providing viable bicycle and mass transit alternatives.
Bicycles
Unlike motorized transportation, riding a bicycle does not emit air pollutants such as NOx, SO2, hydrocarbons, or particulates. Moreover, bicycle manufacturing requires far less material and energy resources, and less infrastructure is needed to support these vehicles in terms of space for roads and parking. Therefore, bicycles represent an environmentally soft (or “green”) alternative to motorized vehicles for personal transportation. There are more than 1-billion million bicycles in the world, about half of them in China. Canadians own about 13 million bicycles, or 0.42 per person. In spite of this number, only 1% of all trips are made using a bicycle, which suggests that many bicycles are not well used. Great environmental benefits would result if more Canadians used bicycles instead of motor vehicles as a means of personal transportation. These benefits include less air pollution, smaller costs of transportation infrastructure, and less use of energy and material resources. Personal benefits include the convenience of bicycle travel and improved health from frequent exercise.
However, bicycle riding can be dangerous, mostly because of the risk of collisions with motor vehicles. About 2% of vehicle-related deaths in North America involve bicyclists (motor-vehicle accidents are the other 98%, but the per-trip and per-kilometre risk of death associated with bicycle use is more than twice as great; Insurance Institute for Highway Safety, 2014). In the United States in 2012, there were 772 bicycle-related fatalities, and Canadian data are about 10% of that. However, bicycle fatalities have decreased by 24% since 1975 because most cyclists now wear a helmet (98% of fatalities involve people without a helmet). Safer bicycle use requires separate lanes along busy roadways, improved awareness by automobile and truck drivers of the need to share the road with bicycle riders (and vice versa), and increased use of safety equipment by bicyclists, especially helmets and lights and reflective devices at night. The use of bicycles in cities can be encouraged in the following ways:
- by developing a network of cycleways (separate paths for bicycles), bike lanes, and paved shoulders on major roads
- by providing secure parking facilities at workplaces and public-transit stations (the latter is known as “bike and ride”)
- by having a fleet of bicycles for free use or inexpensive rental from a network of pick-up centres (this system, first used in several European cities, is being tried on a smaller scale in North America, including Montreal)
- by educating people about the advantages of bicycle transport and safety issues.
Other ways to increase bicycle use would be much more difficult to implement. For example, urban-planning options could encourage people to live closer to their workplaces, giving them shorter commutes. In addition, legislation could ensure that people using motorized transport pay the full costs of their choice of transportation by withdrawing subsidies for the construction of roads, bridges, parking lots, and other infrastructure and by applying realistic taxes (such as user fees) to offset the costs of associated air pollution and resource depletion.
Landscape, Gardens and Urban Biodiversity
A sustainable city takes pride in its many beautiful parks and public gardens. This pride is best formed through a strong focus on local biodiversity, habitat and ecology, wildlife rehabilitation, forest conservation and the protecting of regional characteristics. Ready access to these green spaces: public parks, gardens, with opportunities for leisure and recreation, are essential components of a healthy city. As is arresting the loss of biodiversity by enhancing the natural environment and landscape, and planning the city using ecological principles based on natural cycles (not on energy-intensive technology) as a guide, and increasing urban vegetation. A city that preserves and maximizes its open spaces, natural landscapes and recreational opportunities is a more healthy and resilient city. It needs to maximize the resilience of the eco-system through urban landscapes that mitigate the `urban heat island’ (UHI) effect, using plants for air-purification and urban cooling. Further, the narrowing of roads, which calms traffic and lowers the UHI effect, allows for more (all-important) tree planting. Preserving green space, gardens and farmland, maintaining a green belt around the city, and planting trees everywhere (including golf courses), as trees absorb CO2, is an important mission.
Green spaces are an essential feature of energy efficient and livable cities. However, many urban policies concerning green spaces in emerging countries’ cities boil down to a predetermined percentage of green space. What really matters is access and proximity of green spaces with diversified social activities instead of proportion only. The spatial distribution of green spaces in Paris results from policies and regulations that have ensured that every citizen lives less than 400 m from a public park, square, or garden (Figure \(\PageIndex{4}\)). This target has been reached whereas green spaces only represent 5 percent of the urban area. There are a few large parks that allow a wide range of activities for residents, and a large number of very successful pocket parks for daily family activities and intergenerational mix (300 green spaces less than ó ha). As a comparison, green spaces in Beijing represent 30 percent of the urban area. Most of the green spaces are very big parks, and the long tail of small parks is lacking. As a result, residents live more than 3 km away from public parks on average.
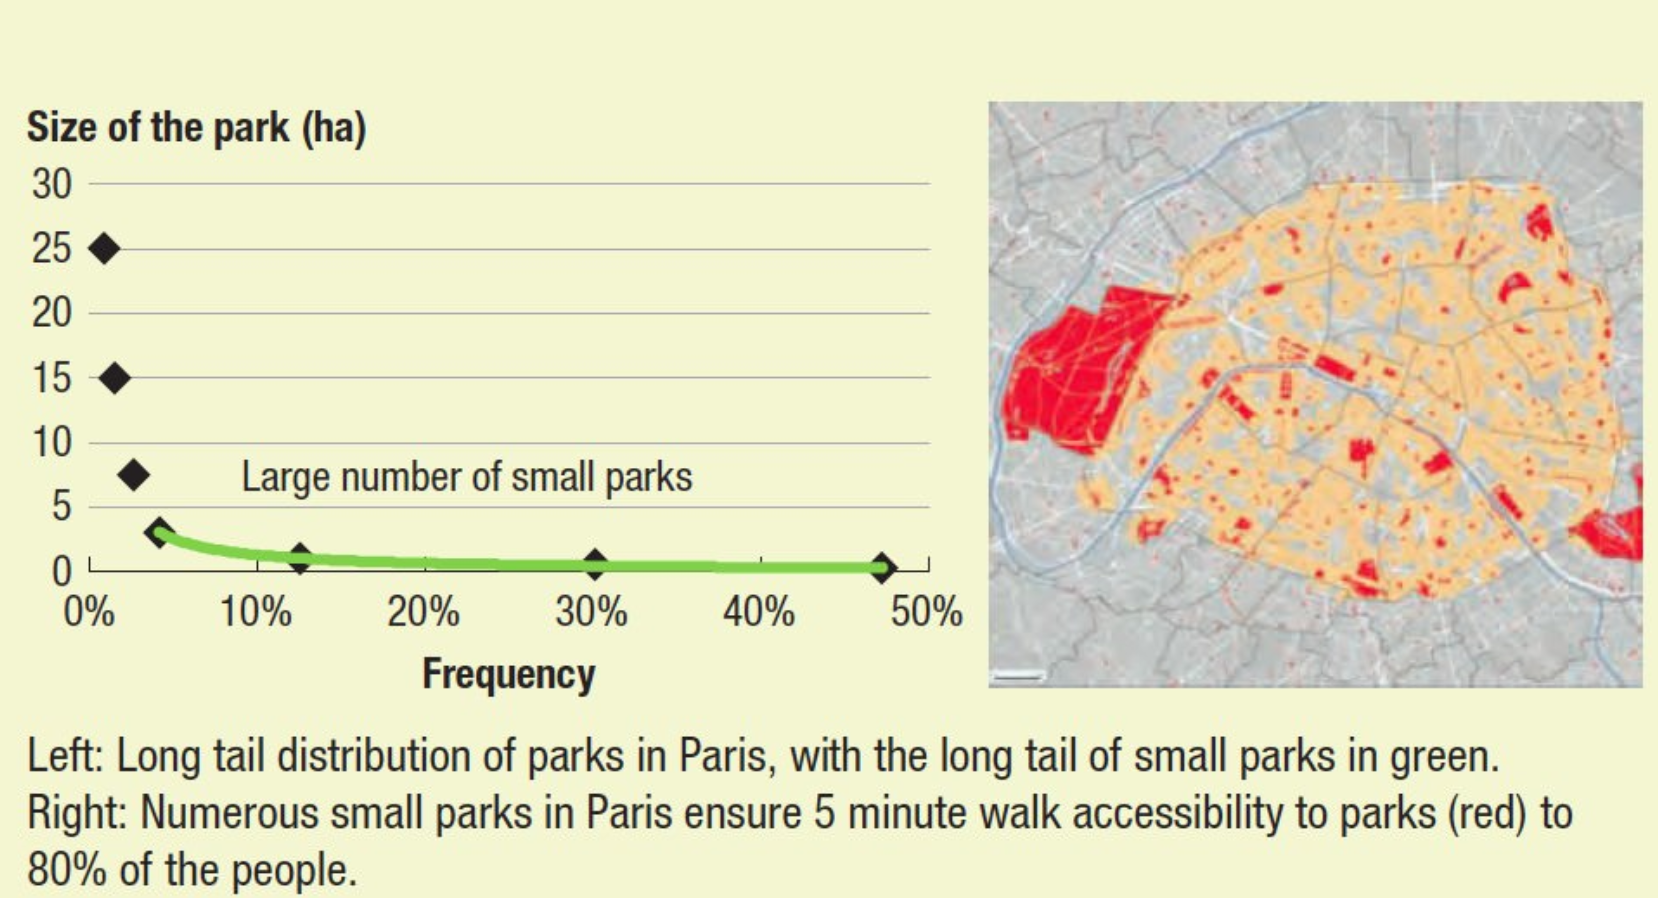
Figure \(\PageIndex{4}\): Greenspace in Paris.
Local Food and Green Roofs
The sustainable city also needs to introduce inner-city gardens, urban farming (Figure \(\PageIndex{5}\)) and green roofs (Figure \(\PageIndex{2}\)) in all its urban design projects (using the city for food supply). Other aspects of the local food principle include: local food production; regional supply; and the `eat local’ and `slow food’ initiatives. The sustainable city makes provision for adequate land for food production in the city, a return to the community and to the allotment gardens of past days, where roof gardens become an urban market garden. It is essential that we bridge the urban-rural disconnect and move cities towards models that deal in natural eco-systems and healthy food systems. The people of the eco-city would garden and farm locally, sharing food, creating compost with kitchen scraps and garden clippings and growing `community’ vegetables. Buying and consuming locally will be necessary to cut down on petrol-based transport. Such things as re-using bags and glass containers, paper recycling and the cost of food processing will need reconsideration.
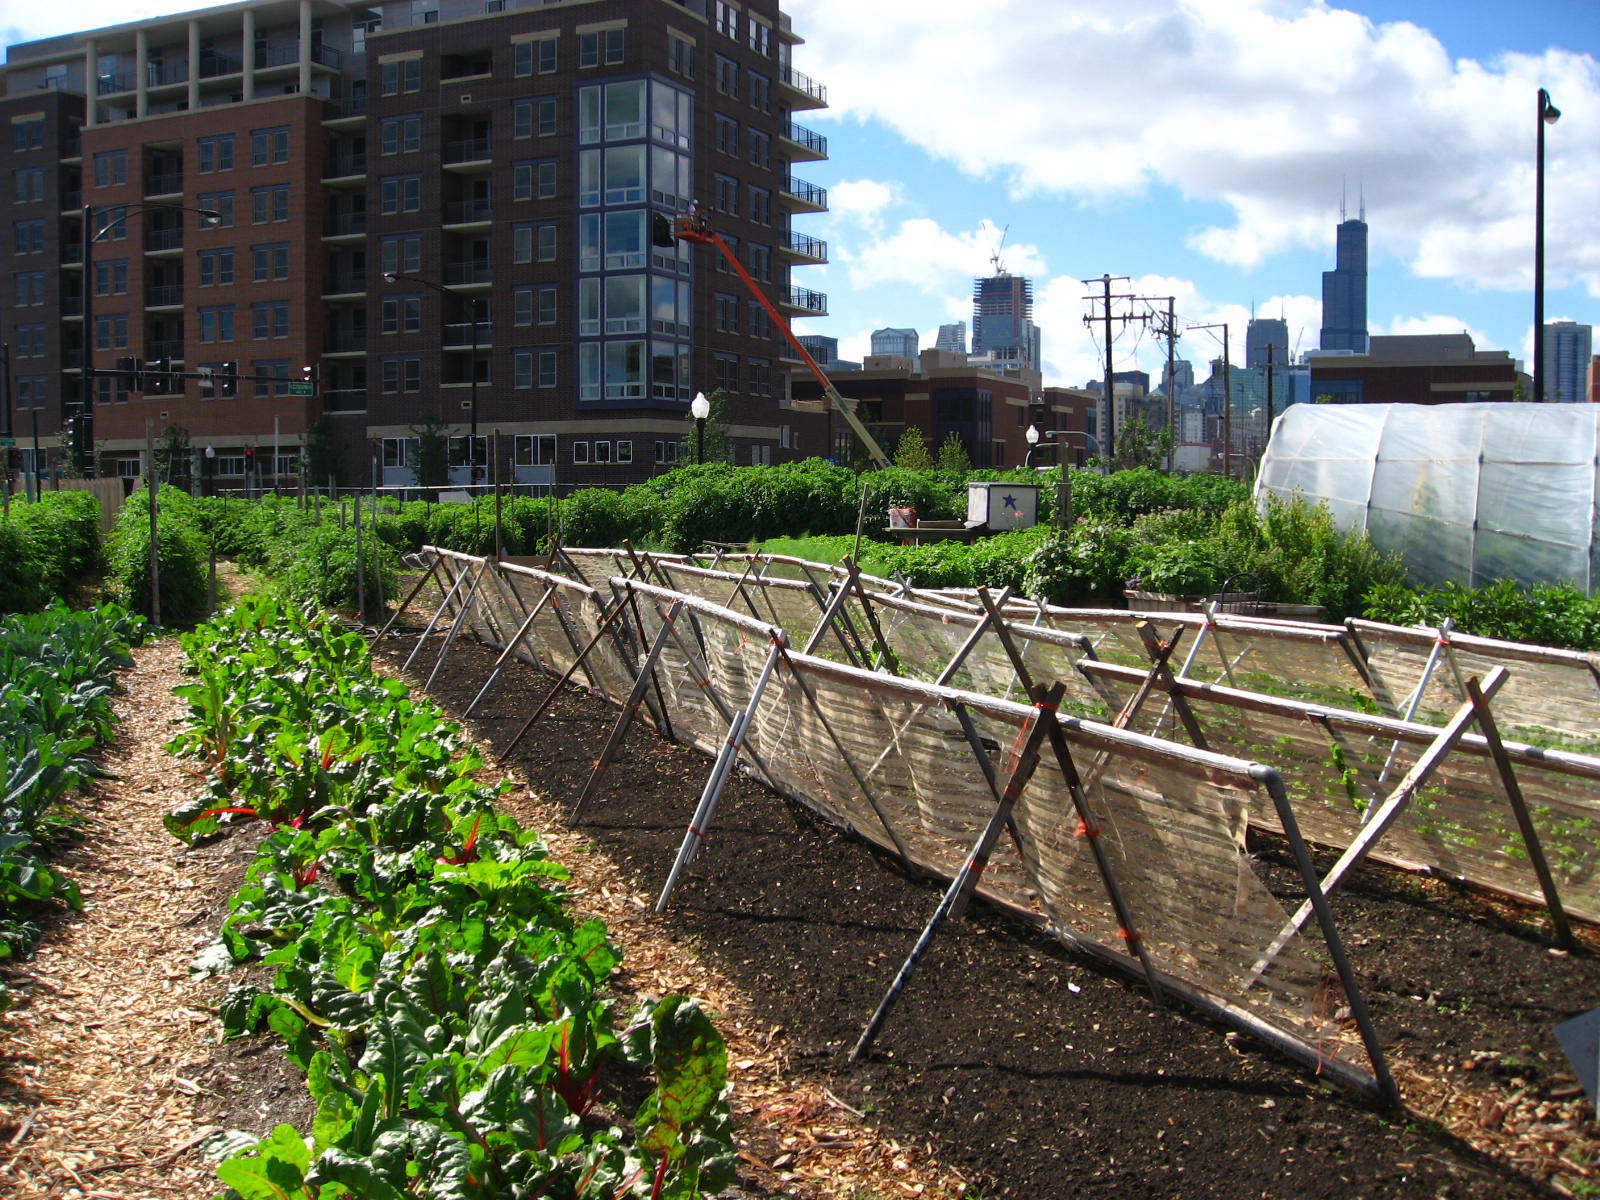
Figure \(\PageIndex{5}\): Some new crops being started, protected by shade cloth barriers to the west. Note the new construction in the background. This area used to be all public housing and are being replaced with mix of market-rate and low-income housing (also called mixed income housing.) The 1.5 acre parcel that City Farm sits on is owned by the City of Chicago and provided, rent-free, to this non-profit initiative. Taken on 1 August 2008 by Linda from Chicago, USA.
USEPA is encouraging urban agriculture as one of the solutions to the shrinking city.21 It sees urban agriculture as not only providing a use for vacant land, (thus addressing blight and the deleterious affect of neglect on property values) but also as a potential cleanup strategy for contamination. It addresses the problem of food deserts (lack of healthy, affordable, fresh produce) in blighted inner city neighborhoods while educating children and adults about farming and local enterprise. Practitioners have found that urban farming enhances social capital and community connections. Victory gardens produced about 40% of American vegetables consumed during World War II22 and urban gardens could be a prime user of the compost that we could generate either through individual compost bins or through collective efforts performed on a large scale by our waste haulers.
Urban Forests
The urban forest is another prominent habitat in cities and towns, although it does not always support native species. Neighborhoods with abundant trees can be studied using the same methods that are used to examine natural forest. One study looked at the urban forest in residential, institutional, and parkland areas of Halifax (Figure \(\PageIndex{6-7}\)). Older residential neighborhoods had a tree biomass similar to that of natural forest in the region, although the stem density was considerably less (many trees in the mature urban forest are relatively large). Younger neighborhoods had a smaller tree biomass but a higher density, suggesting a pattern of succession in the urban forest. Even an institutional neighborhood, consisting mostly of several hospitals and a university, had a substantial population of trees.
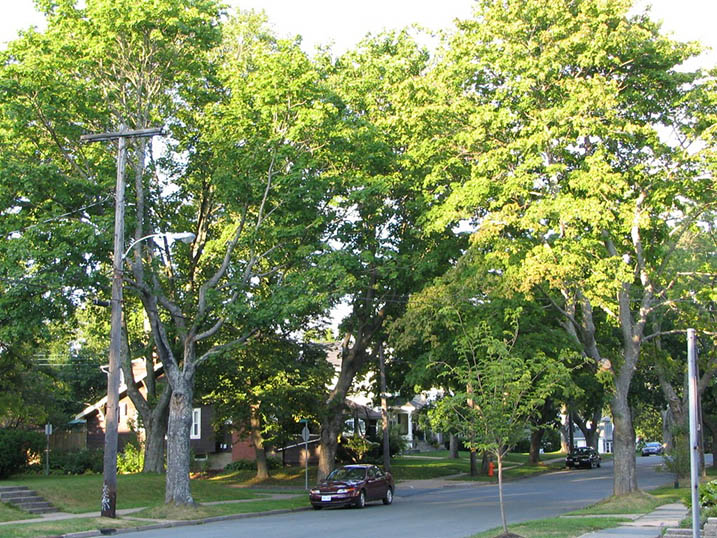
Figure \(\PageIndex{6}\): Streets with large numbers of mature trees are relatively pleasant, compared with places in which the urban forest is sparse or missing. This residential street in Halifax is mostly forested with alien trees, such as Norway maple (Acer platanoides) and linden (Tilia cordata). Source: B. Freedman.
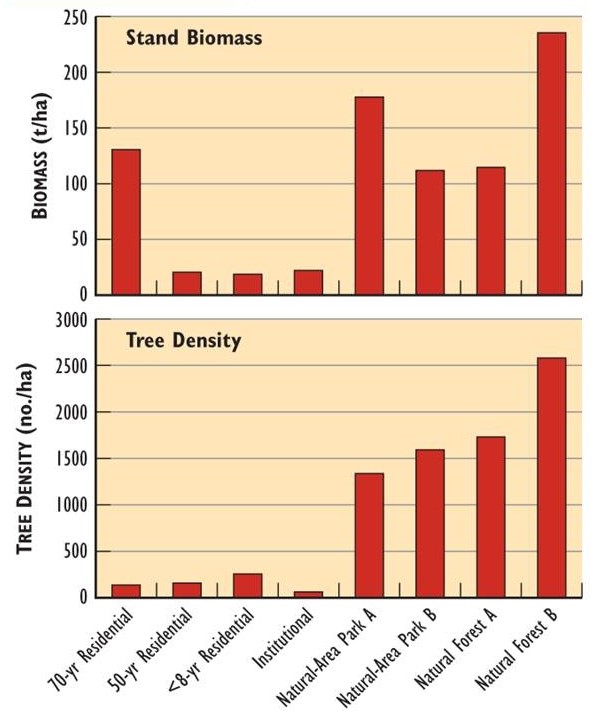
Figure \(\PageIndex{7}\): Characteristics of the Urban Forest in Halifax. Tree density and biomass are shown for stands of urban forest in different kinds of neighborhoods. The data for natural forest are for rural mature hardwood stands. Source: Freedman et al. (1996).
The urban forest provides many useful ecological services. For example, large amounts of carbon are stored in urban trees, which helps offset some emissions of CO2 from the combustion of fossil fuels. Urban parks and well-treed residential areas can store as much carbon in tree biomass as can a natural forest (Table 25.8). In addition, well-placed trees reduce the wind speed near buildings, which decreases the air-infiltration rate and thereby helps to conserve heat during cold weather. Trees can also shade buildings, reducing the energy needed for air conditioning during warm weather. Transpiration from tree foliage also helps to cool the ambient urban atmosphere, as does the shading of streets, lawns, and other areas. Urban trees also absorb some air pollutants (such as SO2 and particulates), help to reduce noise levels, and greatly improve outdoor aesthetics. A well-developed urban forest also provides habitat for lower-growing plants and for animals in built-up areas.
Waterfowl are also abundant in urban areas with aquatic habitat, such as beside an ocean or near a lake or river. For example, many cities have wild breeding populations of “giant” Canada goose (Branta canadensis maxima), which are descended from birds that were released in those places since the 1950s (Figure \(\PageIndex{8}\)). The geese find that grassy lawns near water provide suitable feeding habitat, and their population in some cities has increased enormously. However, many of these geese have lost the habit of migrating, and some people consider their abundance and year-round presence to be a nuisance. Some cities have attempted to alleviate their “over-population” of geese by capturing animals and shipping them to willing host cities elsewhere. Some cities are culling the geese by killing part of the population. During the spring and fall migrations, some cities with aquatic habitat support large numbers of native waterfowl and other birds. Some waterfowl may remain during the winter if open water is present. Urban birders from Victoria to St. John’s often spend time viewing the numerous native ducks, geese, swans, gulls, shorebirds, and other migrating and wintering birds in local aquatic habitats. Each autumn, for example, the Toronto waterfront provides habitat for thousands of long-tailed ducks (Clangula hyemalis) that are migrating from their arctic breeding grounds. St. John’s is the only city in the world where ivory gulls (Pagophila eburnea) can be regularly seen.
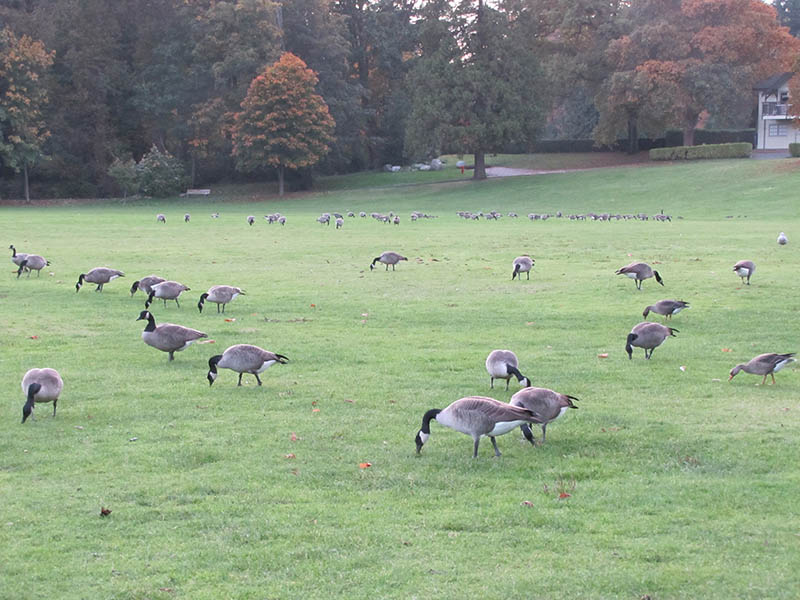
Figure \(\PageIndex{8}\): Stanley Park in Vancouver is a greenspace with a mixture of natural and cultural values. During the autumn and winter, geese and other migrating waterfowl use the local ponds and other habitats for feeding and other purposes. Source: B. Freedman.
Some native mammals also occur in urban habitats. Grey (black) squirrels (Sciurus carolinensis) and raccoons (Procyon lotor) may even inhabit downtown neighbourhoods as long as there is some open forest available. Urban areas with extensive shrubby and forested habitat may sustain white-tailed deer (Odocoileus virginianus), red fox (Vulpes vulpes), striped skunk (Mephites mephites), and coyote (Canis latrans). The key to sustaining populations of native animals in urban areas is to maintain as much relatively natural habitat as possible, dominated by indigenous plants. If this is done, even inner-city backyards can provide habitat for some native animals. This function is enhanced by the deliberate naturalization of urban habitats by growing native plants in horticulture.
Social Equity
Today we recognize that safe, sound and sanitary housing is not just indoor plumbing and more bedrooms, and that affordable housing is not just rent but includes utility and transportation costs and the right to live in a safe, mixed income, stably integrated neighborhood. Our sustainable city should stand upon the leg of social equity and include ethnic and income diversity.
Perhaps the most significant development that separates sustainability from its conservation antecedents is the element of social equity. The environmental and conservation movements have been criticized in the past for being too "white collar" and promoting the interests of the “haves”; these movements have traditionally not dealt with the needs of the underclass in the U.S. and, especially, developing countries. In Agenda 21, the manifesto of the Earth Summit conference on the environment held in Rio de Janeiro in 1992, sustainable development was viewed as the strategy that would be needed to increase the basic standard of living of the world's expanding population without unnecessarily depleting our finite natural resources and further degrading the environment upon which we all depend.9 The challenge, as viewed at the Earth Summit, was posed in terms of asking humanity to collectively step back from the brink of environmental collapse and, at the same time, lift its poorest members up to the level of basic human health and dignity.
The concept of ecological footprint asks each of us to limit resource use to our equitable share. Sitting on the apex of civilization the Western world is being asked to share the earth’s bounty with the masses of Asia, South America and Africa. If technology continues to advance we can do this without significant long-term degradation of our standard of living. Short-term economic dislocations are inevitable, however, as increasing demand from China and India bring us to peak oil and rising transportation costs will highlight the nexus between location efficiency and affordable housing. The Center for Neighborhood Technology, for instance, has mapped 337 metropolitan areas covering 80% of the United States population showing how efficient (near mass transit) locations reduce the cost of living (housing + utilities transportation) and vice versa. The reality of rising transportation costs could have a significant impact on the shape of the city. Looking backward we also realize that racial politics were one of the dynamics that fueled suburban expansion in the 50’s and 60’s decimating many of our urban centers. The Sustainable City of the future, if it works, will have stably integrated mixed income neighborhoods.
References Cited and Further Reading
American Public Transportation Association (APTA). 2014. Public Transportation Fact Book, Appendix A: Historical Tables. APTA, Washington, DC.
Berkowitz, A.R., C.H. Nilon, and K.S. Hollweg. 2002. Understanding Urban Ecosystems. Springer Verlag, Berlin, Germany.
Breuste, J., H. Feldmann, and O. Ohlmann (eds.). 1998. Urban Ecology. Springer Verlag, Berlin, Germany.
Brinkhoff, T. 2015. Major Agglomerations of the World. http://www.citypopulation.de/world/Agglomerations.html
Downs, A. 1992. Stuck in Traffic: Coping With Peak-Hour Traffic Congestion. Washington, DC: Brookings Institution Press.
Environment Canada. 1996. The State of Canada’s Environment. Government of Canada, Ottawa, ON.
Environment Canada. 1999. Air Quality Trends in Canadian Cities, 1979–1992. Ottawa, ON: State of the Environment Reporting, Environment Canada. https://web.archive.org/web/20010214040646/http://www.ec.gc.ca/pdb/uaqt/aqfact_e.html
Environment Canada. 2007. Municipal population served by wastewater treatment. State of Environment Infobase Ottawa, ON. https://web.archive.org/web/20040621114650/http://www.ec.gc.ca:80/soer-ree/English/Indicators/Issues/Urb_H2O/Bulletin/uwind3_e.cfm
Environment Canada. 2014. Air Quality Indicators. Environment Canada, Ottawa, ON. http://www.ec.gc.ca/indicateurs-indicators/default.asp?lang=en&n=7DCC2250-1
Ewing, B., D. Moore, A. Ourser, A. Reed, and M. Wackernagel. 2010. Ecological Footprint Atlas 2010. Global Footprint Network, Oakland, CA. https://www.footprintnetwork.org/content/images/uploads/Ecological_Footprint_Atlas_2010.pdf
Federation of Canadian Municipalities (FCM). 2009. Waste Diversion Success Stories from Canadian Municipalities. FCM, Ottawa, ON. http://www.fcm.ca/Documents/tools/GMF/Getting_to_50_percent_en.pdf
Fincher, R. and J.M. Jacobs (eds.). 1998. Cities of Difference. Guilford Press, New York, NY.
Freedman, B., S. Love, and B. O’Neil. 1996. Tree species, biomass, and carbon storage in stands of urban forest of varying character in Halifax, Nova Scotia, Canada. Canadian Field-Naturalist, 110: 675–682.
Gill, D. and P. Bonnett. 1973. Nature in the Urban Landscape: A Study of City Ecosystems. York Press, Baltimore, MD.
Global Footprint Network. 2007. Canadian Living Planet Report. World Wildlife Fund Canada, Toronto, ON, and the Global Footprint Network, Oakland, CA. https://web.archive.org/web/20180618150932/https://www.footprintnetwork.org/content/documents/2007_Canadian_Living_Planet_Report.pdf
Holcomb, M.C. 1987. Transportation Energy Data Book, 9th ed. Oak Ridge National Laboratory, Oak Ridge, TN.
Jacobs, J. 1961. The Death and Life of Great American Cities. Random House, New York, NY.
Jacobs, J. 1969. The Economy of Cities. Random House, New York, NY.
Kreith, F. (ed.). 1994. Handbook of Solid Waste Management. McGraw-Hill, New York, NY.
Kryter, K.D. 1985. The Effects of Noise. 2nd ed. Academic Press, Orlando, FL.
Landsberg, H.E. 1981. The Urban Climate. Academic Press, New York, NY.
Langford, T.E.L. 1990. Ecological Effects of Thermal Discharges. Elsevier Science, Amsterdam, The Netherlands.
Lowe, M.D. 1989. The Bicycle: Vehicle for a Small Planet. Worldwatch Institute, Washington, DC. Nathanson, J.A. 2002. Basic Environmental Technology: Water Supply, Waste Management, and Pollution Control. 3rd ed. Prentice Hall, Upper Saddle River, NJ.
National Round Table on the Environment and the Economy (NRTEE). 1998. Greenhouse Gas Emissions from Urban Transportation: Backgrounder. NRTEE, Ottawa, ON.
Platt, R.H., R.A. Rowntree, and P.C. Muick. 1994. The Ecological City: Preserving and Restoring Urban Biodiversity. University of Massachusetts Press Amherst, MA.
Ponting, C. 1991. A Green History of the World. Sinclair-Stevenson London, UK.
Rees, W.E. 1992. Ecological footprints and appropriated carrying capacity: What urban economics leaves out. Environment and Urbanization, 4: 121–130.
Rees, W.E. 1997. Is “sustainable city” an oxymoron? Local Environment, 2: 303–310.
Rees, W.E. 2010. The Human Nature of Unsustainability. The Post Carbon Institute, Santa Rosa, CA.
Savard, J.-P. 1978. Birds in Metropolitan Toronto: Distribution, Relationships with Habitat Features, and Nesting Sites. Unpublished M.Sc. Thesis, University of Toronto.
Statistics Canada. 2006. Human Activity and the Environment. Annual Statistics 2006. www.statcan.ca/english/freepub/16-201-XIE/16-201-XIE2006000.pdf
Statistics Canada. 2006. Road motor vehicle, trailer and snowmobile registration, annual (registrations). Table 405-0001, Statistics Canada, Ottawa, ON. http://www5.statcan.gc.ca/cansim/a26?lang=eng&retrLang=eng&id=4050001&pattern=automobiles&tabMode=dataTable&srchLan=-1&p1=1&p2=50
Statistics Canada. 2012. Human Activity and the Environment, Waste Management in Canada. Statistics Canada, Ottawa, ON. http://www5.statcan.gc.ca/olc-cel/olc.action?ObjId=16-201-X&ObjType=2&lang=en&limit=0
Statistics Canada. 2017. Road motor vehicle registrations, by type of vehicle. Table 23-10-0067-01 (formerly CANSIM 405-0004), Statistics Canada, Ottawa, ON. https://www150.statcan.gc.ca/t1/tbl1/en/tv.action?pid=2310006701
Statistics Canada. 2014b. Leading causes of death, by sex. CANSIM Table 102-0561, Statistics Canada, Ottawa, ON. http://www.statcan.gc.ca/tables-tableaux/sum-som/l01/cst01/hlth36a-eng.htm Accessed November, 2014.
Timerson, B.J. 1999. A Guide to Noise Control in Minnesota. Minnesota Pollution Control Agency. Minneapolis, MN.
Transport Canada. 2012. Canadian Motor Vehicle Traffic Collision Statistics, 2004. Transport Canada, Ottawa, ON. http://www.tc.gc.ca/eng/roadsafety/tp-tp3322-2004-menu-691.htm
Transport Canada. 2017. Annual Reports: Transportation in Canada. Transport Canada Ottawa, ON. https://www.tc.gc.ca/eng/policy/anre-menu.htm
Turner, K., L. Lefler, and B. Freedman. 2004. Plant communities of selected urbanized areas of Halifax, Nova Scotia, Canada. Landscape and Urban Planning, 71: 191–206.
Wackernagel, M. and W.E. Rees. 1996. Our Ecological Footprint: Reducing Human Impact on the Earth. New Society, Gabriola Island, BC.
15 based upon Institute of Traffic Engineers Trip Generation Manual, 1997 from http://www.maine.gov/mdot/planning-process-programs/trips.php accessed 4/25/11
18 Conservation Design Forum from A Guide to Stormwater Best Management Practices, http://www.cdfinc.com/xm_client/client_documents/Chicago_GuideTo_Stormwater_BMPs.pdf, accessed 4/25/11
19 Newport, Robert, USEPA lecture to UPP 594 class 9/7/10
21 http://www.epa.gov/brownfields/urbanag/index.html accessed 4/25/11
22 http://healthfreedoms.org/2011/03/10/food-crisis-triumph-part-2-victory-gardens/ accessed 4/25/11
27 http://energyfuture.wikidot.com/us-energy-use, accessed 4/25/11
28 http://www.energysavers.gov/your_home/designing_remodeling/index.cfm/mytopic=10360, accessed 4/25/11
Attribution
Modified by Kyle Whittinghill and Rachel Schleiger from the following sources:
- Environment and Society in a Changing World by PennState OER Initiative (CC-BY-NC-SA)
- The Sustainable City from Essentials of Environmental Science by Kamala Dorsner and CK-12 (CC-BY)
- Chapter 12: Urban Ecology from Environmental Science: A Canadian Perspective by Bill Freedman (Creative Commons Attribution NonCommercial)
- Sustainable Infrastructure from Sustainability: A Comprehensive Foundation by Tom Theis and Jonathan Tomkin, Editors (CC-BY). Download for free at CNX.
- The Sustainable City from Sustainability: A Comprehensive Foundation by Tom Theis and Jonathan Tomkin, Editors (CC-BY). Download for free at CNX.
- Sustainable Transportation: Accessibility, Mobility, and Derived Demand from Sustainability: A Comprehensive Foundation by Tom Theis and Jonathan Tomkin, Editors (CC-BY). Download for free at CNX.

