
16.1: Waste Generation
- Page ID
- 94350

\( \newcommand{\vecs}[1]{\overset { \scriptstyle \rightharpoonup} {\mathbf{#1}} } \)
\( \newcommand{\vecd}[1]{\overset{-\!-\!\rightharpoonup}{\vphantom{a}\smash {#1}}} \)
\( \newcommand{\dsum}{\displaystyle\sum\limits} \)
\( \newcommand{\dint}{\displaystyle\int\limits} \)
\( \newcommand{\dlim}{\displaystyle\lim\limits} \)
\( \newcommand{\id}{\mathrm{id}}\) \( \newcommand{\Span}{\mathrm{span}}\)
( \newcommand{\kernel}{\mathrm{null}\,}\) \( \newcommand{\range}{\mathrm{range}\,}\)
\( \newcommand{\RealPart}{\mathrm{Re}}\) \( \newcommand{\ImaginaryPart}{\mathrm{Im}}\)
\( \newcommand{\Argument}{\mathrm{Arg}}\) \( \newcommand{\norm}[1]{\| #1 \|}\)
\( \newcommand{\inner}[2]{\langle #1, #2 \rangle}\)
\( \newcommand{\Span}{\mathrm{span}}\)
\( \newcommand{\id}{\mathrm{id}}\)
\( \newcommand{\Span}{\mathrm{span}}\)
\( \newcommand{\kernel}{\mathrm{null}\,}\)
\( \newcommand{\range}{\mathrm{range}\,}\)
\( \newcommand{\RealPart}{\mathrm{Re}}\)
\( \newcommand{\ImaginaryPart}{\mathrm{Im}}\)
\( \newcommand{\Argument}{\mathrm{Arg}}\)
\( \newcommand{\norm}[1]{\| #1 \|}\)
\( \newcommand{\inner}[2]{\langle #1, #2 \rangle}\)
\( \newcommand{\Span}{\mathrm{span}}\) \( \newcommand{\AA}{\unicode[.8,0]{x212B}}\)
\( \newcommand{\vectorA}[1]{\vec{#1}} % arrow\)
\( \newcommand{\vectorAt}[1]{\vec{\text{#1}}} % arrow\)
\( \newcommand{\vectorB}[1]{\overset { \scriptstyle \rightharpoonup} {\mathbf{#1}} } \)
\( \newcommand{\vectorC}[1]{\textbf{#1}} \)
\( \newcommand{\vectorD}[1]{\overrightarrow{#1}} \)
\( \newcommand{\vectorDt}[1]{\overrightarrow{\text{#1}}} \)
\( \newcommand{\vectE}[1]{\overset{-\!-\!\rightharpoonup}{\vphantom{a}\smash{\mathbf {#1}}}} \)
\( \newcommand{\vecs}[1]{\overset { \scriptstyle \rightharpoonup} {\mathbf{#1}} } \)
\(\newcommand{\longvect}{\overrightarrow}\)
\( \newcommand{\vecd}[1]{\overset{-\!-\!\rightharpoonup}{\vphantom{a}\smash {#1}}} \)
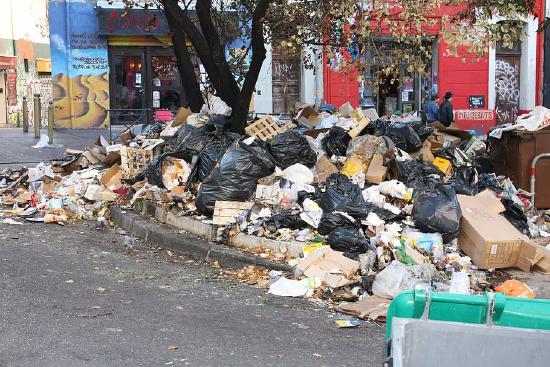
\(\newcommand{\avec}{\mathbf a}\) \(\newcommand{\bvec}{\mathbf b}\) \(\newcommand{\cvec}{\mathbf c}\) \(\newcommand{\dvec}{\mathbf d}\) \(\newcommand{\dtil}{\widetilde{\mathbf d}}\) \(\newcommand{\evec}{\mathbf e}\) \(\newcommand{\fvec}{\mathbf f}\) \(\newcommand{\nvec}{\mathbf n}\) \(\newcommand{\pvec}{\mathbf p}\) \(\newcommand{\qvec}{\mathbf q}\) \(\newcommand{\svec}{\mathbf s}\) \(\newcommand{\tvec}{\mathbf t}\) \(\newcommand{\uvec}{\mathbf u}\) \(\newcommand{\vvec}{\mathbf v}\) \(\newcommand{\wvec}{\mathbf w}\) \(\newcommand{\xvec}{\mathbf x}\) \(\newcommand{\yvec}{\mathbf y}\) \(\newcommand{\zvec}{\mathbf z}\) \(\newcommand{\rvec}{\mathbf r}\) \(\newcommand{\mvec}{\mathbf m}\) \(\newcommand{\zerovec}{\mathbf 0}\) \(\newcommand{\onevec}{\mathbf 1}\) \(\newcommand{\real}{\mathbb R}\) \(\newcommand{\twovec}[2]{\left[\begin{array}{r}#1 \\ #2 \end{array}\right]}\) \(\newcommand{\ctwovec}[2]{\left[\begin{array}{c}#1 \\ #2 \end{array}\right]}\) \(\newcommand{\threevec}[3]{\left[\begin{array}{r}#1 \\ #2 \\ #3 \end{array}\right]}\) \(\newcommand{\cthreevec}[3]{\left[\begin{array}{c}#1 \\ #2 \\ #3 \end{array}\right]}\) \(\newcommand{\fourvec}[4]{\left[\begin{array}{r}#1 \\ #2 \\ #3 \\ #4 \end{array}\right]}\) \(\newcommand{\cfourvec}[4]{\left[\begin{array}{c}#1 \\ #2 \\ #3 \\ #4 \end{array}\right]}\) \(\newcommand{\fivevec}[5]{\left[\begin{array}{r}#1 \\ #2 \\ #3 \\ #4 \\ #5 \\ \end{array}\right]}\) \(\newcommand{\cfivevec}[5]{\left[\begin{array}{c}#1 \\ #2 \\ #3 \\ #4 \\ #5 \\ \end{array}\right]}\) \(\newcommand{\mattwo}[4]{\left[\begin{array}{rr}#1 \amp #2 \\ #3 \amp #4 \\ \end{array}\right]}\) \(\newcommand{\laspan}[1]{\text{Span}\{#1\}}\) \(\newcommand{\bcal}{\cal B}\) \(\newcommand{\ccal}{\cal C}\) \(\newcommand{\scal}{\cal S}\) \(\newcommand{\wcal}{\cal W}\) \(\newcommand{\ecal}{\cal E}\) \(\newcommand{\coords}[2]{\left\{#1\right\}_{#2}}\) \(\newcommand{\gray}[1]{\color{gray}{#1}}\) \(\newcommand{\lgray}[1]{\color{lightgray}{#1}}\) \(\newcommand{\rank}{\operatorname{rank}}\) \(\newcommand{\row}{\text{Row}}\) \(\newcommand{\col}{\text{Col}}\) \(\renewcommand{\row}{\text{Row}}\) \(\newcommand{\nul}{\text{Nul}}\) \(\newcommand{\var}{\text{Var}}\) \(\newcommand{\corr}{\text{corr}}\) \(\newcommand{\len}[1]{\left|#1\right|}\) \(\newcommand{\bbar}{\overline{\bvec}}\) \(\newcommand{\bhat}{\widehat{\bvec}}\) \(\newcommand{\bperp}{\bvec^\perp}\) \(\newcommand{\xhat}{\widehat{\xvec}}\) \(\newcommand{\vhat}{\widehat{\vvec}}\) \(\newcommand{\uhat}{\widehat{\uvec}}\) \(\newcommand{\what}{\widehat{\wvec}}\) \(\newcommand{\Sighat}{\widehat{\Sigma}}\) \(\newcommand{\lt}{<}\) \(\newcommand{\gt}{>}\) \(\newcommand{\amp}{&}\) \(\definecolor{fillinmathshade}{gray}{0.9}\)In natural systems, there is no such thing as waste. Everything flows in a natural cycle of use and reuse. Living organisms consume materials and eventually return them to the environment, usually in a different form, for reuse. Solid waste (or trash) is a human concept. It refers to a variety of discarded materials, not liquid or gas, that are deemed useless or worthless (figure \(\PageIndex{a}\)). Humans modify natural substances, making them more difficult to breakdown, or store matter under conditions that slow its degradation. However, what is worthless to one person may be of value to someone else, and solid wastes can be considered misplaced resources. Learning effective ways to reduce the amount of wastes produced and to recycle valuable resources contained in the wastes is important if humans wish to maintain a livable and sustainable environment.
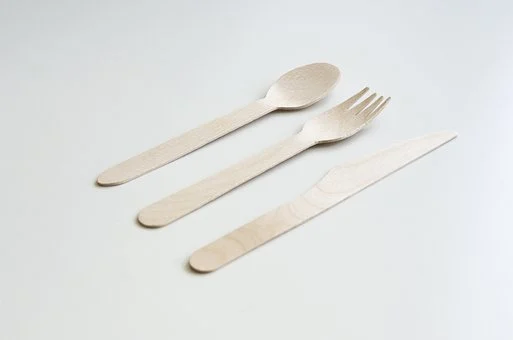
Types of Waste
There are many subcategories of waste (figure \(\PageIndex{b}\)). Biodegradable waste can be broken down by microbes whereas nondegradable waste does not readily break down. Hazardous waste is trash that presents a health risk. Specifically, hazardous wastes are defined as materials which are toxic, carcinogenic (cause cancer), mutagenic (cause DNA mutations), teratogenic (cause birth defects), highly flammable, corrosive, or explosive. Examples include batteries, fluorescent lights, various cleaners, and e-waste, which arises from discarded electronics. Precious metals can be extracted and recycled from hazardous waste, but it must be done safely.
Interactive Element
How do you dispose of household hazardous wastes? Check Earth 911 for disposal sites near you.
Solid Waste Sources and Composition
Agriculture and industry generate most of the waste globally followed by mining (figure \(\PageIndex{c}\)). Together, these generate non-municipal solid waste. Some common items that are classified as non-municipal waste are: construction materials (roofing shingles, electrical fixtures, bricks); waste-water sludge; incinerator residues; ash; scrubber sludge; oil/gas/mining waste; railroad ties, and pesticide containers. The remaining waste, municipal solid waste (MSW), is made up of discarded solid materials from residences, businesses, and city buildings. Globally, waste generated from industry generated was nearly 18 times that of MSW, and waste generated from agriculture was more than 4.5 times that of MSW.
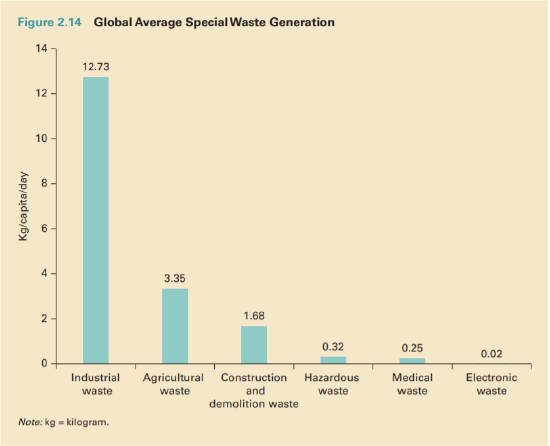
The world generates 2.21 billion tons of municipal solid waste annually. Municipal solid waste makes up 3-9% of all waste in the U.S., and 292.4 million tons were generated in U.S. in 2018 (4.9 lbs per person per day). This contrasts with average values in Sub-Saharan Africa (1.01 lbs per person per day), South Asia (1.15 lbs per person per day), and East Asia and the Pacific (1.23 lbs per person per day). Daily waste generation per person in high income countries is projected to increase by 19 percent by 2050, compared to low- and middle-income countries where it is anticipated to increase by approximately 40 percent or more.
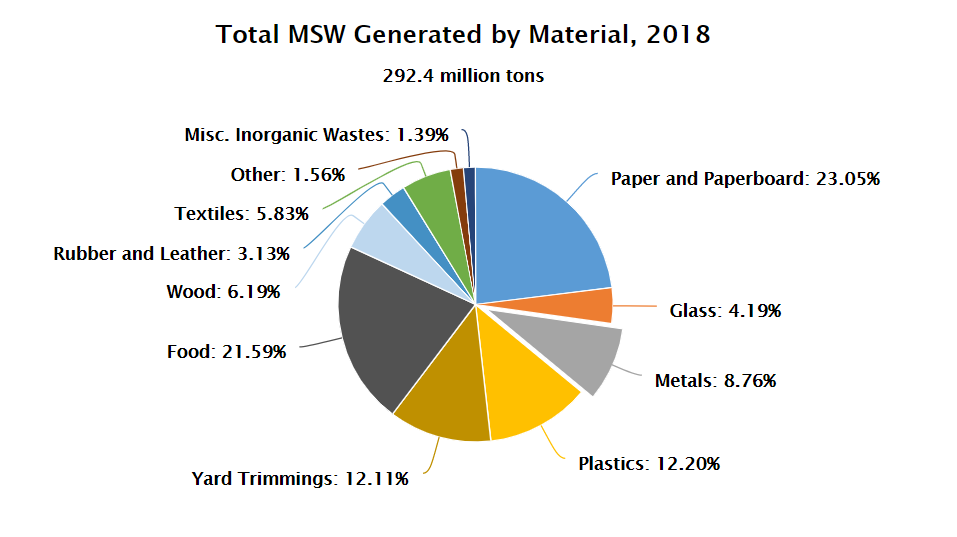
Municipal solid waste consists of materials from plastics to food scraps. The most common waste product is paper (about 23% of the total; figure \(\PageIndex{d}\)). Other common components are yard waste (green waste), plastics, metals, wood, glass and food waste. The composition of the municipal wastes can vary from region to region and from season to season.
Attribution
Modified by Melissa Ha from the following sources:
- Systems of Waste Management from Sustainability: A Comprehensive Foundation by Tom Theis and Jonathan Tomkin, Editors (CC-BY). Download for free at CNX.
- Solid Waste form AP Environmental Science by University of California College Prep (CC-BY). Download for free at CNX.
- Kaza, Silpa; Yao, Lisa C.; Bhada-Tata, Perinaz; Van Woerden, Frank. 2018. What a Waste 2.0 : A Global Snapshot of Solid Waste Management to 2050. Urban Development;. Washington, DC: World Bank. © World Bank. (CC-BY)