7.3: Threats to Biodiversity
- Last updated
- Save as PDF
- Page ID
- 94293
\( \newcommand{\vecs}[1]{\overset { \scriptstyle \rightharpoonup} {\mathbf{#1}} } \)
\( \newcommand{\vecd}[1]{\overset{-\!-\!\rightharpoonup}{\vphantom{a}\smash {#1}}} \)
\( \newcommand{\dsum}{\displaystyle\sum\limits} \)
\( \newcommand{\dint}{\displaystyle\int\limits} \)
\( \newcommand{\dlim}{\displaystyle\lim\limits} \)
\( \newcommand{\id}{\mathrm{id}}\) \( \newcommand{\Span}{\mathrm{span}}\)
( \newcommand{\kernel}{\mathrm{null}\,}\) \( \newcommand{\range}{\mathrm{range}\,}\)
\( \newcommand{\RealPart}{\mathrm{Re}}\) \( \newcommand{\ImaginaryPart}{\mathrm{Im}}\)
\( \newcommand{\Argument}{\mathrm{Arg}}\) \( \newcommand{\norm}[1]{\| #1 \|}\)
\( \newcommand{\inner}[2]{\langle #1, #2 \rangle}\)
\( \newcommand{\Span}{\mathrm{span}}\)
\( \newcommand{\id}{\mathrm{id}}\)
\( \newcommand{\Span}{\mathrm{span}}\)
\( \newcommand{\kernel}{\mathrm{null}\,}\)
\( \newcommand{\range}{\mathrm{range}\,}\)
\( \newcommand{\RealPart}{\mathrm{Re}}\)
\( \newcommand{\ImaginaryPart}{\mathrm{Im}}\)
\( \newcommand{\Argument}{\mathrm{Arg}}\)
\( \newcommand{\norm}[1]{\| #1 \|}\)
\( \newcommand{\inner}[2]{\langle #1, #2 \rangle}\)
\( \newcommand{\Span}{\mathrm{span}}\) \( \newcommand{\AA}{\unicode[.8,0]{x212B}}\)
\( \newcommand{\vectorA}[1]{\vec{#1}} % arrow\)
\( \newcommand{\vectorAt}[1]{\vec{\text{#1}}} % arrow\)
\( \newcommand{\vectorB}[1]{\overset { \scriptstyle \rightharpoonup} {\mathbf{#1}} } \)
\( \newcommand{\vectorC}[1]{\textbf{#1}} \)
\( \newcommand{\vectorD}[1]{\overrightarrow{#1}} \)
\( \newcommand{\vectorDt}[1]{\overrightarrow{\text{#1}}} \)
\( \newcommand{\vectE}[1]{\overset{-\!-\!\rightharpoonup}{\vphantom{a}\smash{\mathbf {#1}}}} \)
\( \newcommand{\vecs}[1]{\overset { \scriptstyle \rightharpoonup} {\mathbf{#1}} } \)
\(\newcommand{\longvect}{\overrightarrow}\)
\( \newcommand{\vecd}[1]{\overset{-\!-\!\rightharpoonup}{\vphantom{a}\smash {#1}}} \)
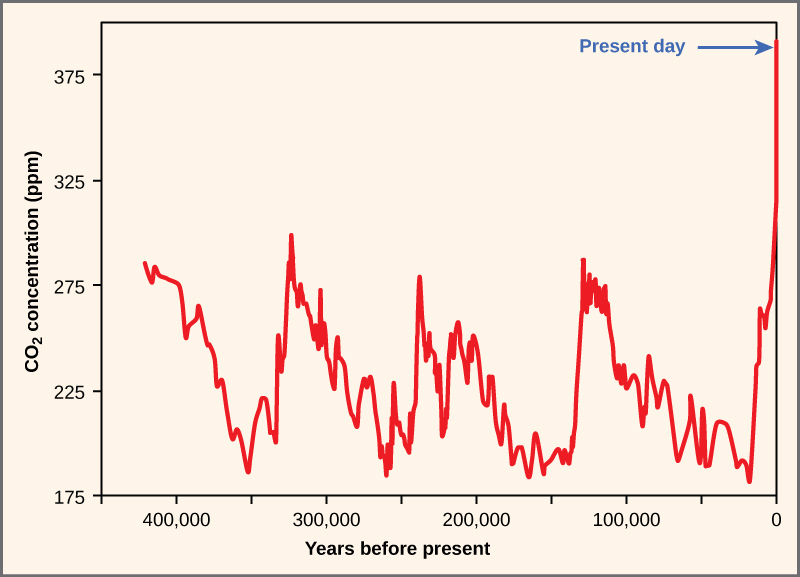
\(\newcommand{\avec}{\mathbf a}\) \(\newcommand{\bvec}{\mathbf b}\) \(\newcommand{\cvec}{\mathbf c}\) \(\newcommand{\dvec}{\mathbf d}\) \(\newcommand{\dtil}{\widetilde{\mathbf d}}\) \(\newcommand{\evec}{\mathbf e}\) \(\newcommand{\fvec}{\mathbf f}\) \(\newcommand{\nvec}{\mathbf n}\) \(\newcommand{\pvec}{\mathbf p}\) \(\newcommand{\qvec}{\mathbf q}\) \(\newcommand{\svec}{\mathbf s}\) \(\newcommand{\tvec}{\mathbf t}\) \(\newcommand{\uvec}{\mathbf u}\) \(\newcommand{\vvec}{\mathbf v}\) \(\newcommand{\wvec}{\mathbf w}\) \(\newcommand{\xvec}{\mathbf x}\) \(\newcommand{\yvec}{\mathbf y}\) \(\newcommand{\zvec}{\mathbf z}\) \(\newcommand{\rvec}{\mathbf r}\) \(\newcommand{\mvec}{\mathbf m}\) \(\newcommand{\zerovec}{\mathbf 0}\) \(\newcommand{\onevec}{\mathbf 1}\) \(\newcommand{\real}{\mathbb R}\) \(\newcommand{\twovec}[2]{\left[\begin{array}{r}#1 \\ #2 \end{array}\right]}\) \(\newcommand{\ctwovec}[2]{\left[\begin{array}{c}#1 \\ #2 \end{array}\right]}\) \(\newcommand{\threevec}[3]{\left[\begin{array}{r}#1 \\ #2 \\ #3 \end{array}\right]}\) \(\newcommand{\cthreevec}[3]{\left[\begin{array}{c}#1 \\ #2 \\ #3 \end{array}\right]}\) \(\newcommand{\fourvec}[4]{\left[\begin{array}{r}#1 \\ #2 \\ #3 \\ #4 \end{array}\right]}\) \(\newcommand{\cfourvec}[4]{\left[\begin{array}{c}#1 \\ #2 \\ #3 \\ #4 \end{array}\right]}\) \(\newcommand{\fivevec}[5]{\left[\begin{array}{r}#1 \\ #2 \\ #3 \\ #4 \\ #5 \\ \end{array}\right]}\) \(\newcommand{\cfivevec}[5]{\left[\begin{array}{c}#1 \\ #2 \\ #3 \\ #4 \\ #5 \\ \end{array}\right]}\) \(\newcommand{\mattwo}[4]{\left[\begin{array}{rr}#1 \amp #2 \\ #3 \amp #4 \\ \end{array}\right]}\) \(\newcommand{\laspan}[1]{\text{Span}\{#1\}}\) \(\newcommand{\bcal}{\cal B}\) \(\newcommand{\ccal}{\cal C}\) \(\newcommand{\scal}{\cal S}\) \(\newcommand{\wcal}{\cal W}\) \(\newcommand{\ecal}{\cal E}\) \(\newcommand{\coords}[2]{\left\{#1\right\}_{#2}}\) \(\newcommand{\gray}[1]{\color{gray}{#1}}\) \(\newcommand{\lgray}[1]{\color{lightgray}{#1}}\) \(\newcommand{\rank}{\operatorname{rank}}\) \(\newcommand{\row}{\text{Row}}\) \(\newcommand{\col}{\text{Col}}\) \(\renewcommand{\row}{\text{Row}}\) \(\newcommand{\nul}{\text{Nul}}\) \(\newcommand{\var}{\text{Var}}\) \(\newcommand{\corr}{\text{corr}}\) \(\newcommand{\len}[1]{\left|#1\right|}\) \(\newcommand{\bbar}{\overline{\bvec}}\) \(\newcommand{\bhat}{\widehat{\bvec}}\) \(\newcommand{\bperp}{\bvec^\perp}\) \(\newcommand{\xhat}{\widehat{\xvec}}\) \(\newcommand{\vhat}{\widehat{\vvec}}\) \(\newcommand{\uhat}{\widehat{\uvec}}\) \(\newcommand{\what}{\widehat{\wvec}}\) \(\newcommand{\Sighat}{\widehat{\Sigma}}\) \(\newcommand{\lt}{<}\) \(\newcommand{\gt}{>}\) \(\newcommand{\amp}{&}\) \(\definecolor{fillinmathshade}{gray}{0.9}\)The core threat to biodiversity on the planet, and therefore a threat to human welfare, is the combination of human population growth and resource exploitation. The human population requires resources to survive and grow, and those resources are being removed unsustainably from the environment. The three greatest proximate threats to biodiversity are habitat loss, overharvesting, and introduction of exotic species. The first two of these are a direct result of human population growth and resource use. The third results from increased mobility and trade. A fourth major cause of extinction, anthropogenic climate change, has not yet had a large impact, but it is predicted to become significant during this century. Global climate change is also a consequence of human population needs for energy and the use of fossil fuels to meet those needs (Figure \(\PageIndex{1}\)). Environmental issues, such as toxic pollution, have specific targeted effects on species, but they are not generally seen as threats at the magnitude of the others.
Habitat Loss
Humans rely on technology to modify their environment and replace certain functions that were once performed by the natural ecosystem. Other species cannot do this. Elimination of their ecosystem—whether it is a forest, a desert, a grassland, a freshwater estuarine, or a marine environment—will kill the individuals in the species. Remove the entire habitat within the range of a species and, unless they are one of the few species that do well in human-built environments, the species will become extinct. Human destruction of habitats accelerated in the latter half of the twentieth century. Consider the exceptional biodiversity of Sumatra: it is home to one species of orangutan, a species of critically endangered elephant, and the Sumatran tiger, but half of Sumatra’s forest is now gone. The neighboring island of Borneo, home to the other species of orangutan, has lost a similar area of forest. Forest loss continues in protected areas of Borneo. The orangutan in Borneo is listed as endangered by the International Union for Conservation of Nature (IUCN), but it is simply the most visible of thousands of species that will not survive the disappearance of the forests of Borneo. The forests are removed for timber and to plant palm oil plantations (Figure \(\PageIndex{2}\)). Palm oil is used in many products including food products, cosmetics, and biodiesel in Europe.
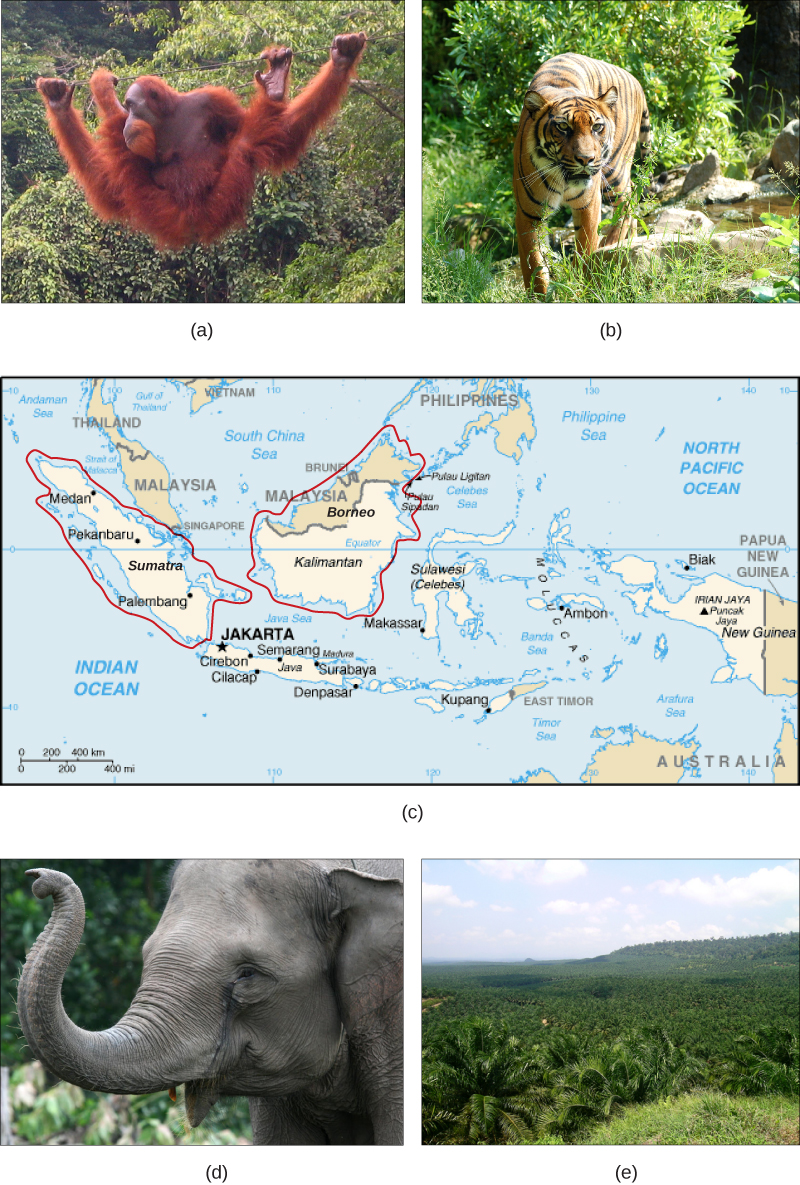
Figure \(\PageIndex{2}\): (a) One species of orangutan, Pongo pygmaeus, is found only in the rainforests of Borneo, and the other species of orangutan (Pongo abelii) is found only in the rainforests of Sumatra. These animals are examples of the exceptional biodiversity of (c) the islands of Sumatra and Borneo. Other species include the (b) Sumatran tiger (Panthera tigris sumatrae) and the (d) Sumatran elephant (Elephas maximus sumatranus), both critically endangered species. Rainforest habitat is being removed to make way for (e) oil palm plantations such as this one in Borneo’s Sabah Province. (credit a: modification of work by Thorsten Bachner; credit b: modification of work by Dick Mudde; credit c: modification of work by U.S. CIA World Factbook; credit d: modification of work by “Nonprofit Organizations”/Flickr; credit e: modification of work by Dr. Lian Pin Koh)
According to Global Forest Watch, 9.7% of tree cover was lost globally from 2002 to 2019, and 9% of that occurred in Indonesia and Malaysia (where Sumatra and Borneo are located). Figure \(\PageIndex{b}\) shows the average annual change in forest area around the world from 1990 to 2015. In the tropics, these losses certainly also represent the extinction of species because of high levels of endemism (species unique to those areas).
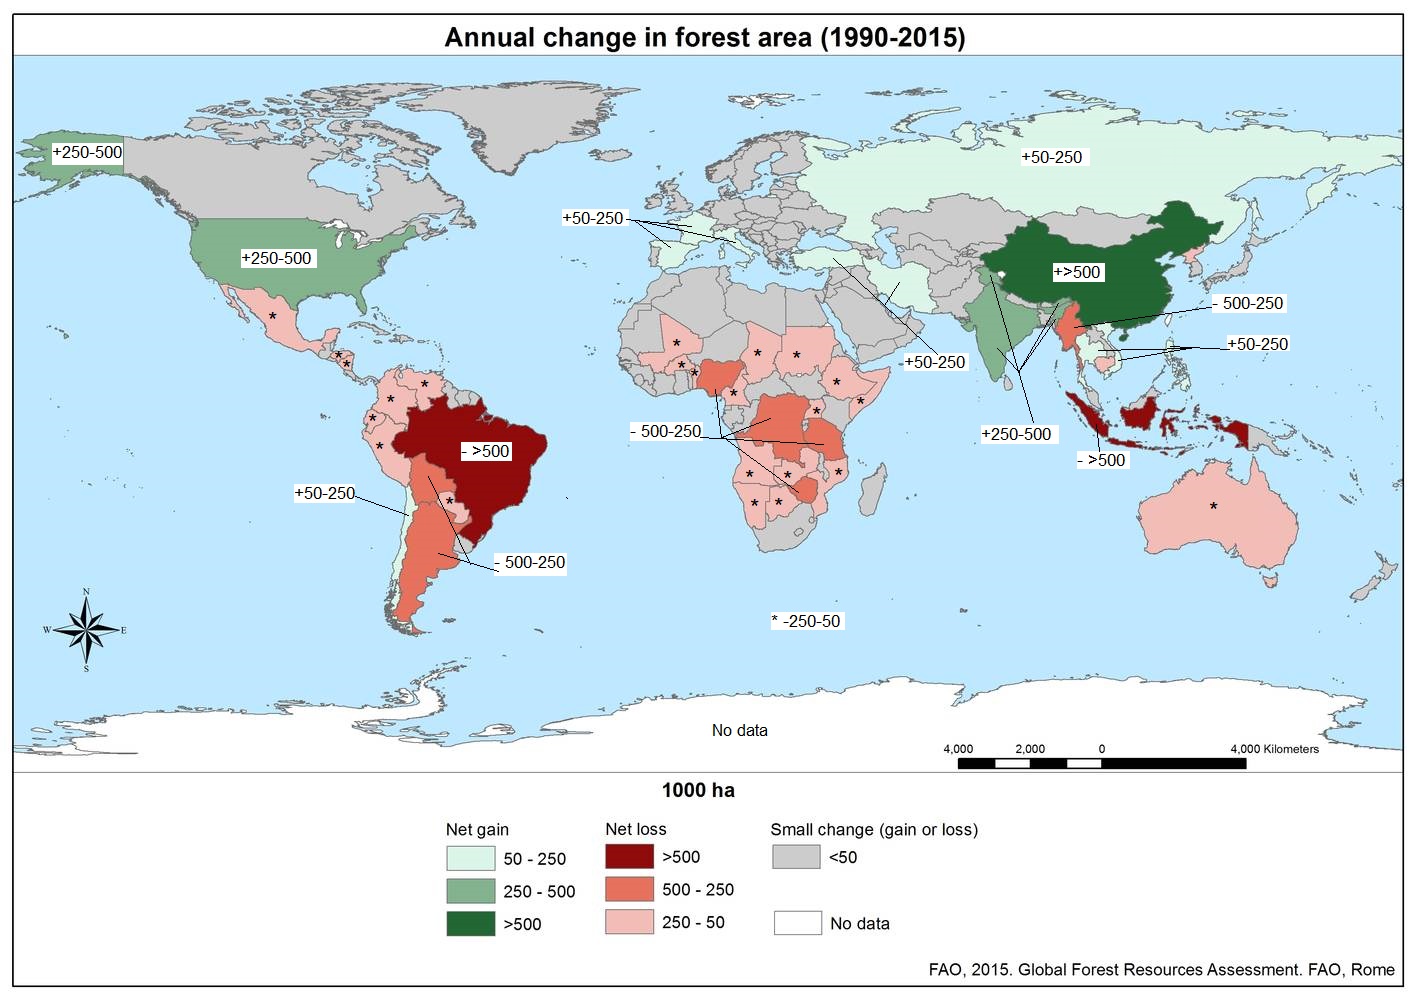
Figure \(\PageIndex{b}\): Average annual change in forest area globally from 2005 to 2015. China is dark green, indicating that have gained more than 500 "kilohectares" (kha) of forest. Medium green indicates countries that have gained 250-500 kha, including the the United States, India, Ghutan, and Bangladesh. Light green indicates countries that have gained 50-250 khA, including Chile, Spain, France, Italy, Turkey, Iran, Russia, Vietnam, and Thailand. Indonesia and Brazil lost more than 500 kha of forest (marked with dark red). Countries that lost 500-250 kha are marked with medium red, including Bolivia, Argentina, Nigeria, Democratic Republic of the Congo, Tanzania, Zimbabwe, and Myanmar. Countries that lost 250-50 kha are marked with light red and an asterisk (*). These include Mexico, Honduras, Nicaragua, Venezuela, Colombia, Ecuador, Peru, Paraguay, Mali, Burkina Faso, Benin, Cameroon, Chad, Sudan, Ethiopia, Somalia, Uganda, Angola, Namibia, Botswana, Zimbabwe, Mozambique, Cambodia, North Korea, and Australia. No data has been collected for Antarctica. All other regions have had lost or gained less than 50 kha in forest area. Image by FAO, 2015. Global Forest Resources Assessment. FAO. Rome (Open Access Policy).
Everyday Connection: Preventing Habitat Destruction with Wise Wood Choices
Most consumers do not imagine that the home improvement products they buy might be contributing to habitat loss and species extinctions. Yet the market for illegally harvested tropical timber is huge, and the wood products often find themselves in building supply stores in the United States. One estimate is that up to 10% of the imported timber stream in the United States, which is the world’s largest consumer of wood products, is illegally logged. A 2012 United Nations and Interpol report estimated that the illegal timber trade is worth $30-100 billion each year. Most of the illegal products are imported from countries that act as intermediaries and are not the originators of the wood.

Figure \(\PageIndex{c}\): The sawmill in Uaxactun, Guatamala is Forest Stewardship Council (FSC) certified and provides good income from a sustainable resource for not only the saw operators but also many others who help keep the operation running. Image by Jason Houston for USAID (public domain).
How is it possible to determine if a wood product, such as flooring, was harvested sustainably or even legally? The Forest Stewardship Council (FSC) certifies sustainably harvested forest products; therefore, looking for their certification on flooring and other hardwood products is one way to ensure that the wood has not been taken illegally from a tropical forest (figure \(\PageIndex{c}\)). Certification applies to specific products, not to a producer; some producers’ products may not have certification while other products are certified. There are certifications other than the FSC, but these are run by timber companies creating a conflict of interest. Another approach is to buy domestic wood species. While it would be great if there was a list of legal versus illegal woods, it is not that simple. Logging and forest management laws vary from country to country; what is illegal in one country may be legal in another. Where and how a product is harvested and whether the forest from which it comes is being sustainably maintained all factor into whether a wood product will be certified by the FSC. It is always a good idea to ask questions about where a wood product came from and how the supplier knows that it was harvested legally.
Habitat destruction can affect ecosystems other than forests. Worldwide, for example, the conversion of land to agriculture and cultivation have led to significant losses in grassland ecosystems. In North America, nearly 70% of the tallgrass prairie ecosystem (which once covered 142 million acres) has been converted to agriculture, and losses from other causes, such as urban development, have brought the total to about 90%. Current estimates indicate that agricultural activity and cultivation systems now cover nearly 25% of the Earth's surface.
Rivers and streams are important ecosystems and are frequently the target of habitat modification through building and from damming or water removal. Damming of rivers affects flows and access to all parts of a river. Altering a flow regime can reduce or eliminate populations that are adapted to seasonal changes in flow. For example, an estimated 91 percent of river lengths in the United States have been have modifications like dams, to create energy or store water; levees, to prevent flooding; or dredging or rerouting, to create land that is more suitable for human development. Many fish species in the United States, especially rare species or species with restricted distributions, have seen declines caused by river damming and habitat loss. The category "wetlands" includes many types of ecosystems, but current estimates indicate that about 50% of the world's wetland habitat has been lost. The former extent of wetland habitats worldwide (fresh, brackish and salt) is difficult to determine but certainly exceeded a billion acres.
Research has confirmed that species of amphibians that must carry out parts of their life cycles in both aquatic and terrestrial habitats are at greater risk of population declines and extinction because of the increased likelihood that one of their habitats or access between them will be lost. This is of particular concern because amphibians have been declining in numbers and going extinct more rapidly than many other groups for a variety of possible reasons.
Link to Learning

Explore a U.S. Fish & Wildlife Service interactive map of critical habitat for endangered and threatened species in the United States. To begin, select “Visit the online mapper.”
Habitat fragmentation occurs when the living space of a species is divided into discontinuous patches. For example, a mountain highway could divide a forest habitat into separate patches. This is especially problematic for consumers at the top of the food chain, which require large ranges to find adequate prey. Additionally, habitat fragmentation separates individuals from potential mates. Wildlife corridors mitigate the damage of habitat fragmentation by connecting patches with suitable habitat. For example, the bridge over a highway could allow animals to move between habitat patches (figure \(\PageIndex{d}\)). Riparian areas, areas of land adjacent to bodies of water, such as streams, can serve as natural wildlife corridors when left intact.

Figure \(\PageIndex{d}\): This overpass on the Trans-Canada Highway between Banff and Lake Louise, Alberta, serves as a wildlife corridor. Image by WikiPedant at Wikimedia Commons (CC-BY-SA).
Overharvesting
Overexploitation (overharvesting) involves hunting, fishing, or otherwise collecting organisms at a faster rate than they can be replenished. Aquatic species are particularly vulnerable to overexploitation, which is more specifically called overfishing in this case. For about one billion people, aquatic resources provide the main source of animal protein (figure \(\PageIndex{b}\)), but since 1990, production from global fisheries (areas for catching wild or farmed fish or other aquatic animals) has declined. This devastates the ability of coastal and open-ocean ecosystems to provide a wide range of ecosystem services such as food provisioning, water filtration, and detoxification (Worm et al., 2006). The collapse of fisheries also has dramatic and long-lasting effects on local human populations that work in the fishery.

Figure \(\PageIndex{b}\): Fishing boats at marine fishers. Alaskan waters have been fished by people for thousands of years, but they are under pressure from modern fishing technologies and large-scale extraction. Source: National Oceanic and Atmospheric Administration
There are many examples of regulated fisheries (including hunting of marine mammals and harvesting of crustaceans and other species) monitored by fisheries scientists that have nevertheless collapsed. The western Atlantic cod fishery is the most spectacular recent collapse. While it was a hugely productive fishery for 400 years, the introduction of modern factory trawlers in the 1980s and the pressure on the fishery led to it becoming unsustainable. Bluefin tuna are in danger of extinction. The once-abundant Mediterranean swordfish fishery have been depleted to commercial and biological exhaustion. Figure \(\PageIndex{c}\) illustrates the extent of overfishing in the U.S. Despite considerable effort, few fisheries are managed sustainability.

Figure \(\PageIndex{c}\): Map of overfishing and overfished stocks in the U.S. by region. Stocks on the overfishing list are being harvested too quickly, and those on the overfished list have population sizes that are too low. For example, stocks of Chinook salmon, Coho salmon, and Pacific sardines are overfished in the Pacific. Some species, including stocks of Pacific bluefin tuna and Atlantic cod, are on both the overfishing and overfished lists. Image by NOAA (public domain).
The causes of fishery collapse are both economic and political in nature. Most fisheries are managed as a common resource, available to anyone willing to fish, even when the fishing territory lies within a country’s territorial waters. Common resources are subject to an economic pressure known as the tragedy of the commons, in which fishers have little motivation to exercise restraint in harvesting a fishery when they do not own the fishery. The general outcome of harvests of resources held in common is their overexploitation. While large fisheries are regulated to attempt to avoid this pressure, it still exists in the background. This overexploitation is exacerbated when access to the fishery is open and unregulated and when technology gives fishers the ability to overfish. In a few fisheries, the biological growth of the resource is less than the potential growth of the profits made from fishing if that time and money were invested elsewhere. In these cases—whales are an example—economic forces will drive toward fishing the population to extinction.
Early efforts to control overfishing used several kinds of regulations on quotas, fishing effort, and gear. Some forms of fishery management limit the number of fish that can be caught in an entire fishery. Under a total allowable catch (TAC) system, fishers can fish when and how they want, but once the quota for the fishery has been met, fishing must stop until the next season. Unfortunately, TAC policies do not solve the underlying problem that fishermen compete for the fish, and often yield perverse incentives and undesirable outcomes such as overcapitalization of the industry (Beddington, Agnew, & Clark, 2007) and races between fishing boat crews to catch fish before the quota is reached. In the well-known case of the Alaskan halibut fishery, the race became so extreme that the fishing season was reduced to a single 24-hour mad dash; given that fish are perishable, this temporal clumping of the catch is not a desirable outcome. Resource economists developed the idea of a tradable permit scheme to help manage fisheries. Individual tradable quota (ITQ) schemes are cap-and-trade policies for fish, where total catch is limited but fishers in the fishery are given permits that guarantee them a right to a share of that catch. Players in the fishery can sell their quota shares to each other (helping the catch to flow voluntarily to the most efficient boats in the industry) and there is no incentive for captains to buy excessively large boats or fish too rapidly to beat the other boats to the catch. ITQ policies have rationalized the Alaskan halibut fishery completely: the fish stock is thriving, overcapitalization is gone, and the fish catch is spread out over time (Levy, 2010). ITQs have also been implemented in the fisheries of New Zealand, yielding large improvements in the biological status of the stocks (Annala, 1996).
For the most part, fishery extinction is not equivalent to biological extinction—the last fish of a species is rarely fished out of the ocean. But there are some instances in which true extinction is a possibility. Whales have slow-growing populations and are at risk of complete extinction through hunting. Also, there are some species of sharks with restricted distributions that are at risk of extinction. The groupers are another population of generally slow-growing fishes that, in the Caribbean, includes a number of species that are at risk of extinction from overfishing.
A related consequence of fishing practices is "bycatch," animals that fishers sometimes catch and discard because they do not want them, cannot sell them, or are not allowed to keep them. Bycatch can be fish, but also includes other animals such as dolphins, whales, sea turtles, and seabirds that become hooked or entangled in fishing gear. Fishing boats are forbidden in some places from using conventional longlines because that gear yields high levels of bycatch and kills endangered leatherback turtles.
Overfishing can result in a radical restructuring of the marine ecosystem in which a dominant species is so overexploited that it no longer serves its ecological function. For example, overfishing a tertiary consumer could causes populations of secondary consumers to increase. Secondary consumers would then feed on primary consumes (like zooplankton), decreasing their population size. With fewer zooplankton, populations of primary producers (phytoplankton, or photosynthetic microorganisms) would be unregulated.
Sustainable seafood is a movement that has gained momentum as more people become aware of overfishing and environmentally-destructive fishing methods. Sustainable seafood is seafood from either fished or farmed sources that can maintain or increase production in the future without jeopardizing the ecosystems from which it was acquired. In general, slow-growing fish that reproduce late in life, such as orange roughy, are vulnerable to overfishing and are considered unsustainable seafood. Seafood species that grow quickly and breed young, such as anchovies and sardines, are much more resistant to overfishing and are therefore labeled “sustainable” and promoted as good alternatives.
Coral reefs are extremely diverse marine ecosystems that face peril from several processes. Reefs are home to 1/3 of the world’s marine fish species—about 4,000 species—despite making up only 1 percent of marine habitat. Most home marine aquaria are stocked with wild-caught organisms, not cultured organisms. Although no species is known to have been driven extinct by the pet trade in marine species, there are studies showing that populations of some species have declined in response to harvesting, indicating that the harvest is not sustainable at those levels.
Terrestrial animals may be overexploited as sources of food, garments, jewelry, medicine, or pets. For example, the poaching of elephants for their valuable ivory and rhinos for their horns, which are used in traditional medicine, is a major threat to these species. There are also concerns about the effect of the pet trade on some terrestrial species such as turtles, amphibians, birds, plants, and even the orangutans. Harvesting of pangolins for their scales and meat, and as curiosities, has led to a drastic decline in population size (figure \(\PageIndex{a}\)).

Figure \(\PageIndex{a}\): Pangolins are threatened by overexploitation. This work by David Brossard is licensed under CC-BY.
Bush meat is the generic term used for wild animals killed for food. Hunting is practiced throughout the world, but hunting practices, particularly in equatorial Africa and parts of Asia, are believed to threaten several species with extinction. Traditionally, bush meat in Africa was hunted to feed families directly. However, recent commercialization of the practice now has bush meat available in grocery stores, which has increased harvest rates to the level of unsustainability. Additionally, human population growth has increased the need for protein foods that are not being met from agriculture. Species threatened by the bush meat trade are mostly mammals including many monkeys and the great apes living in the Congo basin.
Some plant and fungal species are also overexploited, particularly if they are slow-growing. For example, stocks of wild ginseng, which is valued for its health benefits, are dwindling. Peyote cactus, which causes hallucinations and is used in sacred ceremonies, is also declining. Yarsagumba, dead moth larvae that were infected by fungal parasites (caterpillar fungus, Ophiocordyceps sinensis), is overexploited because it is highly valued in traditional medicine and used as an aphrodisiac (figure \(\PageIndex{d}\)).

Figure \(\PageIndex{d}\): Yarsagumba is a combination of moth larvae and the fungus that infected and killed it. Image by Punya (CC-BY-SA).
Exotic Species
Non-native (exotic) refers to species occurring outside of their historic distribution. Exotic species are species that have been intentionally or unintentionally introduced by humans into an ecosystem in which they did not evolve. If an introduced species is able to survive in its new habitat, that introduction is now reflected in the observed range of the species. Human transportation of people and goods, including the intentional transport of organisms for trade, has dramatically increased the introduction of species into new ecosystems, sometimes at distances that are well beyond the capacity of the species to ever travel itself and outside the range of the species’ natural predators.
Most exotic species introductions probably fail because of the low number of individuals introduced or poor adaptation to the ecosystem they enter. Some species, however, have characteristics that can make them especially successful in a new ecosystem. These exotic species often undergo dramatic population increases in their new habitat and reset the ecological conditions in the new environment, threatening the species that exist there. When this happens, the exotic species also becomes an invasive species. I Invasive species can cause ecological and economic damage. They threaten other species through competition for resources, predation, or disease. For example, Kudzu (Pueraria lobata), which is native to Japan, was introduced in the United States in 1876. It was later planted for soil conservation. Problematically, it grows too well in the southeastern United States—up to a foot a day. It is now a pest species and covers over 7 million acres in the southeastern United States. In the United States, invasive species like the purple loosestrife (Lythrum salicaria) and the zebra mussel (Dreissena polymorpha) have drastically altered the ecosystems they invaded. Some well-known invasive animals include the emerald ash borer (Agrilus planipennis) and the European starling (Sturnus vulgaris; figure \(\PageIndex{a}\)). Whether enjoying a forest hike, taking a summer boat trip, or simply walking down an urban street, you have likely encountered an invasive species.

Figure \(\PageIndex{a}\): In the United States, invasive species like (a) purple loosestrife (Lythrum salicaria) and the (b) zebra mussel (Dreissena polymorpha) threaten certain aquatic ecosystems. Some forests are threatened by the spread of (c) common buckthorn (Rhamnus cathartica), (d) garlic mustard (Alliaria petiolata), and (e) the emerald ash borer (Agrilus planipennis). The (f) European starling (Sturnus vulgaris) may compete with native bird species for nest holes. (credit a: modification of work by Liz West; credit b: modification of work by M. McCormick, NOAA; credit c: modification of work by E. Dronkert; credit d: modification of work by Dan Davison; credit e: modification of work by USDA; credit f: modification of work by Don DeBold)
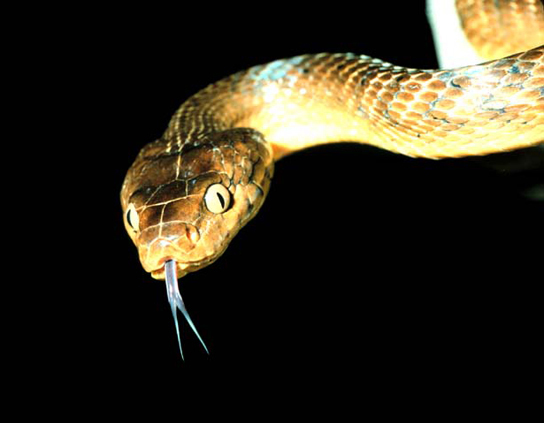
Lakes and islands are particularly vulnerable to extinction threats from introduced species. In Lake Victoria, the intentional introduction of the Nile perch was largely responsible for the extinction of about 200 species of cichlids. The accidental introduction of the brown tree snake via aircraft (Figure \(\PageIndex{3}\)) from the Solomon Islands to Guam in 1950 has led to the extinction of three species of birds and three to five species of reptiles endemic to the island. Several other species are still threatened. The brown tree snake is adept at exploiting human transportation as a means to migrate; one was even found on an aircraft arriving in Corpus Christi, Texas. Constant vigilance on the part of airport, military, and commercial aircraft personnel is required to prevent the snake from moving from Guam to other islands in the Pacific, especially Hawaii. Islands do not make up a large area of land on the globe, but they do contain a disproportionate number of endemic species because of their isolation from mainland ancestors.
Many introductions of aquatic species, both marine and freshwater, have occurred when ships have dumped ballast water taken on at a port of origin into waters at a destination port. Water from the port of origin is pumped into tanks on a ship empty of cargo to increase stability. The water is drawn from the ocean or estuary of the port and typically contains living organisms such as plant parts, microorganisms, eggs, larvae, or aquatic animals. The water is then pumped out before the ship takes on cargo at the destination port, which may be on a different continent. The zebra mussel was introduced to the Great Lakes from Europe prior to 1988 in ship ballast. The zebra mussels in the Great Lakes have cost the industry millions of dollars in clean up costs to maintain water intakes and other facilities. The mussels have also altered the ecology of the lakes dramatically. They threaten native mollusk populations, but have also benefited some species, such as smallmouth bass. The mussels are filter feeders and have dramatically improved water clarity, which in turn has allowed aquatic plants to grow along shorelines, providing shelter for young fish where it did not exist before. The European green crab, Carcinus maenas, was introduced to San Francisco Bay in the late 1990s, likely in ship ballast water, and has spread north along the coast to Washington. The crabs have been found to dramatically reduce the abundance of native clams and crabs with resulting increases in the prey of native crabs.
One of the many recent proliferations of an invasive species concerns the Asian carp in the United States. Asian carp were introduced to the United States in the 1970s by fisheries (commercial catfish ponds) and by sewage treatment facilities that used the fish’s excellent filter feeding abilities to clean their ponds of excess plankton. Some of the fish escaped, and by the 1980s they had colonized many waterways of the Mississippi River basin, including the Illinois and Missouri Rivers. Voracious feeders and rapid reproducers, Asian carp may outcompete native species for food and could lead to their extinction. One species, the grass carp, feeds on phytoplankton and aquatic plants. It competes with native species (those that historically occurred in the area and are adapted to the local ecosystem) for these resources and alters habitats for other fish by removing aquatic plants. In some parts of the Illinois River, Asian carp constitute 95 percent of the community’s biomass. Although edible, the fish is bony and not desired in the United States. The Great Lakes and their prized salmon and lake trout fisheries are being threatened by Asian carp. The carp are not yet present in the Great Lakes, and attempts are being made to prevent its access to the lakes through the Chicago Ship and Sanitary Canal, which is the only connection between the Mississippi River and Great Lakes basins. To prevent the Asian carp from leaving the canal, a series of electric barriers have been used to discourage their migration; however, the threat is significant enough that several states and Canada have sued to have the Chicago channel permanently cut off from Lake Michigan. Local and national politicians have weighed in on how to solve the problem. In general, governments have been ineffective in preventing or slowing the introduction of invasive species.
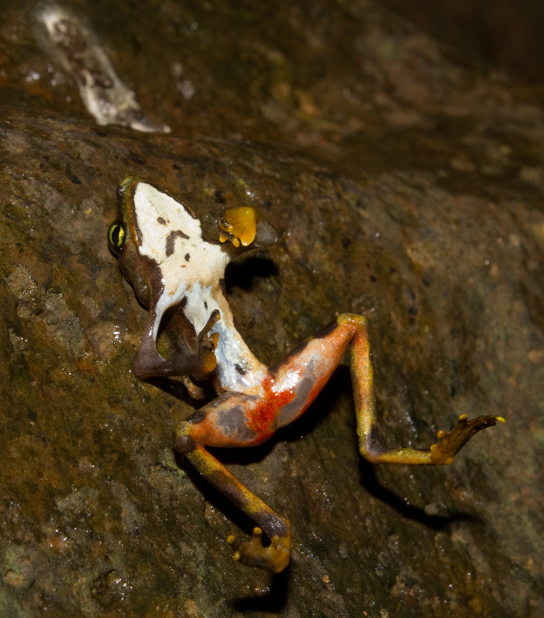
Invading exotic species can also be disease organisms. It now appears that the global decline in amphibian species recognized in the 1990s is, in some part, caused by the fungus Batrachochytrium dendrobatidis, which causes the disease chytridiomycosis (Figure \(\PageIndex{4}\)). There is evidence that the fungus is native to Africa and may have been spread throughout the world by transport of a commonly used laboratory and pet species: the African clawed toad (Xenopus laevis). It may well be that biologists themselves are responsible for spreading this disease worldwide. The North American bullfrog, Rana catesbeiana, which has also been widely introduced as a food animal but which easily escapes captivity, survives most infections of Batrachochytrium dendrobatidis and can act as a reservoir for the disease.
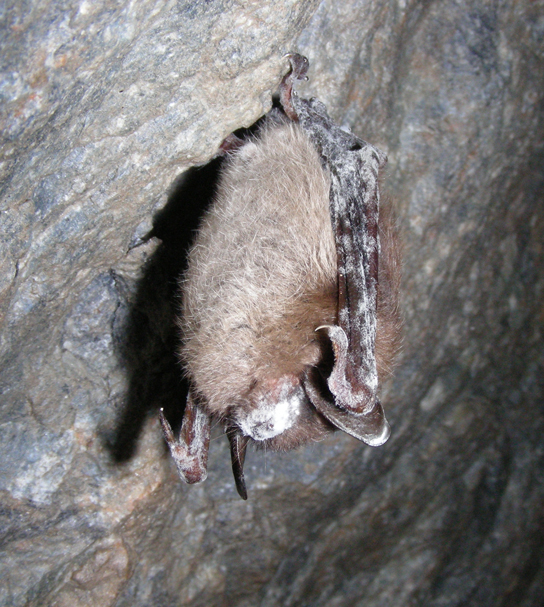
Early evidence suggests that another fungal pathogen, Geomyces destructans, introduced from Europe is responsible for white-nose syndrome, which infects cave-hibernating bats in eastern North America and has spread from a point of origin in western New York State (Figure \(\PageIndex{5}\)). The disease has decimated bat populations and threatens extinction of species already listed as endangered: the Indiana bat, Myotis sodalis, and potentially the Virginia big-eared bat, Corynorhinus townsendii virginianus. How the fungus was introduced is unclear, but one logical presumption would be that recreational cavers unintentionally brought the fungus on clothes or equipment from Europe.
Biological Control of Invasive Species
One reason why invasive species proliferate dramatically outside of their native range is due to release from predators. This means that parasites, predators, or herbivores that usually regulate their populations are not present, allowing them to outcompete or overpredate native species, which are still regulated. Based on this principle, organisms that regulate the invasive species populations have been introduced to the newly colonized areas in some cases. The release of organisms (or viruses) to limit population size is called biological control. As described in the examples below, biological control of invasive species has had varying success, exacerbating the problem in some cases and solving it in others.
Introduced into Australia, this Prickly-pear Cactus (Opuntia) soon spread over millions of hectares of range land driving out forage plants. In 1924, the cactus moth, Cactoblastis cactorum, was introduced (from Argentina) into Australia. The caterpillars of the moth are voracious feeders on prickly-pear cactus, and within a few years, the caterpillars had reclaimed the range land without harming a single native species. However, its introduction into the Caribbean in 1957 did not produce such happy results. By 1989, the cactus moth had reached Florida, and now threatens five species of native cacti there.
The leaf beetle (Galerucella calmariensis) has been introduced to suppress purple loosestrife, a noxious weed (figure \(\PageIndex{e}\)). A combination of four biological controls, including the leaf beetle were released in Minnesota since 1992. While it has not eradicated populations of this invasive species, biological control largely removed leaves from 20% of the purple loosestrive populations where it was released, which could reduce competition for native species. The biological controls established populations in most locations where they were released and even spread to new patches of purple loosestrife.
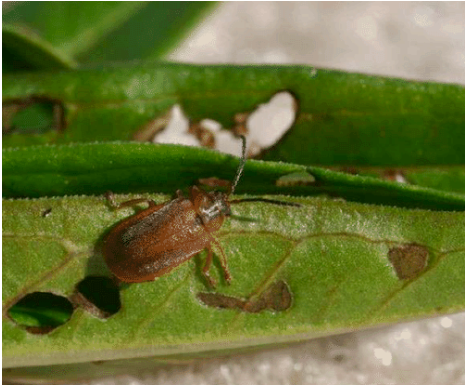
Figure \(\PageIndex{e}\): Young larvae of the leaf-beetle feed in and on the developing buds of plants, often destroying them. This may stunt plant growth and delay or prevent flowering. Adults (shown) and older larvae feed on leaves and cause severe defoliation. Leaf-beetles can be used to as a biocontrol for invasive plants such as purple loosestrife.
In 1946 two species of Chrysolina beetles were introduced into California to control the Klamath weed (St. Johnswort) that was ruining millions of acres of range land in California and the Pacific Northwest. Before their release, the beetles were carefully tested to make certain that they would not turn to valuable plants once they had eaten all the Klamath weed they could find. The beetles succeeded beautifully, restoring about 99% of the endangered range land and earning them a commemorative plaque at the Agricultural Center Building in Eureka, California.
In 1859, the European rabbit was introduced into Australia for sport. With no important predator there, it multiplied explosively (figure \(\PageIndex{f}\)). The raising of sheep (another imported species) suffered badly as the rabbits competed with them for forage. In 1950, the myxoma virus was brought from Brazil and released. The epidemic that followed killed off millions of rabbits (more than 99% of the population). Green grass returned, and sheep raising once again became profitable. Rabbit populations gradually increased, however, because the rabbits evolved to be more resistant to the virus, and the myxoma virus evolved to cause less damage. (Parasites, like viruses, benefit from multiplying inside the host and spreading to other individuals. If they kill their hosts too soon, they typically limit opportunities to multiply and spread.) More recently, the rabbit hemorrhagic disease virus has been used as biological control.
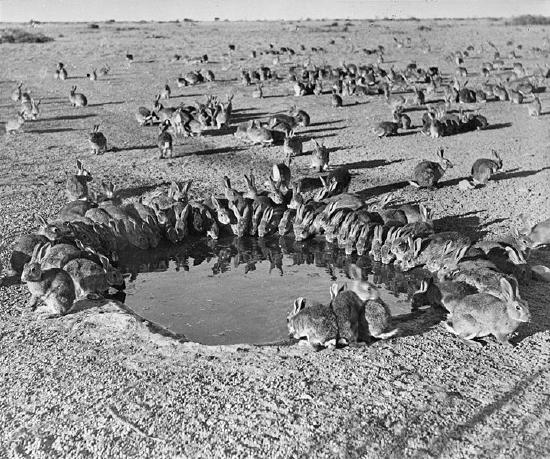
Figure \(\PageIndex{f}\): These rabbits in Australia removed all forage plants, which ordinarily supply them with water as well as food. They thus had to drink from a pool. Image by National Archives of Australia (public domain).
To summarize the lessons learned from biological control successes and failures, only candidates that have a very narrow target preference (eat only a sharply-limited range of hosts) should be chosen. Each candidate should be carefully tested to be sure that once it has cleaned up the intended target, it does not turn to desirable species. Biological controls must not be used against native species. Finally, introduction of non-native species into the environment should be avoided because they could themselves be invasive.
Climate Change
Climate change, and specifically the anthropogenic (meaning, caused by humans) warming trend presently underway, is recognized as a major extinction threat, particularly when combined with other threats such as habitat loss. Anthropogenic warming of the planet has been observed and is hypothesized to continue due to past and continuing emission of greenhouse gases, primarily carbon dioxide and methane, into the atmosphere caused by the burning of fossil fuels and deforestation. These gases decrease the degree to which Earth is able to radiate heat energy created by the sunlight that enters the atmosphere. The changes in climate and energy balance caused by increasing greenhouse gases are complex and our understanding of them depends on predictions generated from detailed computer models. Scientists generally agree the present warming trend is caused by humans and some of the likely effects include dramatic and dangerous climate changes in the coming decades.
However, there is still a lack of understanding about outcomes for specific species related to climate change. Scientists disagree about the likely magnitude of the effects, with extinction rate estimates ranging from 15 percent to 40 percent of species committed to extinction by 2050. Scientists do agree, however, that climate change will alter regional climates, including rainfall and snowfall patterns, making habitats less hospitable to the species living in them. The warming trend will shift colder climates toward the north and south poles, forcing species to move with their adapted climate norms while facing habitat gaps along the way. Range shifts are already being observed: for example, on average, European bird species ranges have moved 91 km (56.5 mi) northward. The same study suggested that the optimal shift based on warming trends was double that distance, suggesting that the populations are not moving quickly enough. Range shifts have also been observed in plants, butterflies, other insects, freshwater fishes, reptiles, amphibians, and mammals.
The shifting ranges will impose new competitive regimes on species as they find themselves in contact with other species not present in their historic range. One such unexpected species contact is between polar bears and grizzly bears (figure \(\PageIndex{f}\)). Previously, these two species had separate ranges. Now, their ranges are overlapping and there are documented cases of these two species mating and producing viable offspring.
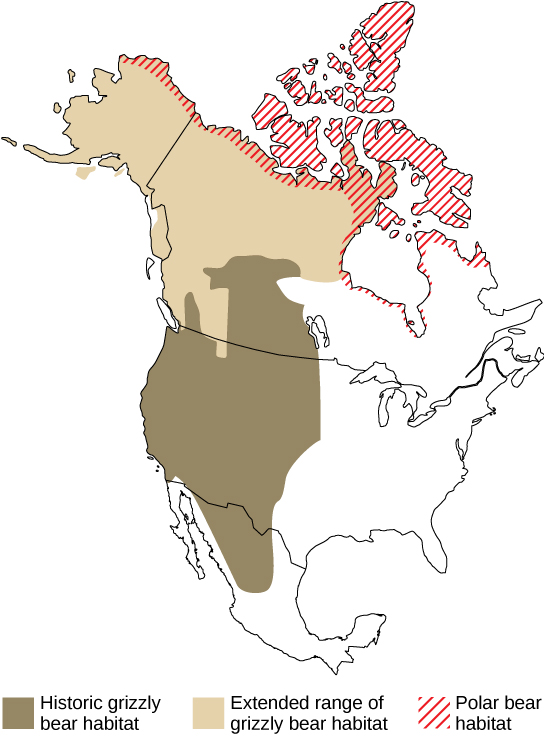
Changing climates also throw off species’ delicate timing adaptations to seasonal food resources and breeding times. Many contemporary mismatches to shifts in resource availability and timing have already been documented.
Climate gradients will also move up mountains, eventually crowding species higher in altitude and eliminating the habitat for those species adapted to the highest elevations. Some climates will completely disappear. The rate of warming appears to be accelerated in the arctic, which is recognized as a serious threat to polar bear populations that require sea ice to hunt seals during the winter months: seals are the only source of protein available to polar bears. A trend to decreasing sea ice and glacier coverage has occurred since observations began in the mid-twentieth century. The rate of decline observed in recent years is far greater than previously predicted by climate models (Figure \(\PageIndex{6}\)).

Finally, global warming will raise ocean levels due to meltwater from glaciers and the greater volume occupied by warmer water. Shorelines will be inundated, reducing island size, which will have an effect on some species, and a number of islands will disappear entirely. Additionally, the gradual melting and subsequent refreezing of the poles, glaciers, and higher elevation mountains—a cycle that has provided freshwater to environments for centuries—will be altered. This could result in an overabundance of salt water and a shortage of fresh water.
References
Global Forest Watch. 2020. World Resources Institute. Accessed 2020-07-29.
Illegal logging nets organized crime up to 100 billion dollars a year, INTERPOL–UNEP report reveals. 2012. Interpol. Accessed 2020-07-29.
Acheson, J. M. (1988). The Lobster Gangs of Maine. Lebanon, NH: University of New England Press.
Annala, J. H. (1996). New Zealand’s ITQ system: have the first eight years been a success or a failure? Reviews in Fish Biology and Fisheries. 6(1), 43–62. doi: 10.1007/BF00058519
Beddington, J. R., Agnew, D.J., & Clark, C. W. (2007). Current problems in the management of marine fisheries. Science, 316(5832), 1713-1716. doi:10.1126/science.1137362
Costello, C., Gaines, S. D., & Lynham, J. (2008). Can catch shares prevent fisheries collapse? Science, 321(5896), 1678 – 1681. doi10.1126/science.1159478
Levy, S. (2010). Catch shares management. BioScience, 60(10), 780–785. doi:10.1525/bio.2010.60.10.3
Montaigne, F. (2007, April). Still waters, the global fish crisis. National Geographic Magazine. Retrieved from http://ngm.nationalgeographic.com/print/2007/04/global-fisheries-crisis/montaigne-text.
Worm, B., Barbier, E. B., Beaumont, N., Duffy, J. E., Folke, C., Halpern, B. S., Hackson, J. B. C., Lotze, H. K., Micheli, F., Palumbi, S. R., Sala, E., Selkoe, K. A., Stachowicz, J. J., & Watson, R. (2006). Impacts of biodiversity loss on ocean ecosystem services. Science, 314(5800), 787 – 790. doi:10.1126/science.1132294
Modified by Kyle Whittinghill and Melissa Ha from the following sources:
- Threats to Biodiversity, Importance of Biodiversity, Community Ecology, and Sustainable Agriculture from Environmental Biology by Matthew R. Fisher (licensed under CC-BY)
- Threats to Biodiversity from General Biology by OpenStax (licensed under CC-BY) by
Connie Rye (East Mississippi Community College), Robert Wise (University of Wisconsin, Oshkosh), Vladimir Jurukovski (Suffolk County Community College), Jean DeSaix (University of North Carolina at Chapel Hill), Jung Choi (Georgia Institute of Technology), Yael Avissar (Rhode Island College) among other contributing authors. Original content by OpenStax (CC BY 4.0; Download for free at http://cnx.org/contents/185cbf87-c72...f21b5eabd@9.87).
- Case Study: Marine Fisheries, and Biodiversity, Species Loss, and Ecosystem Function from Sustainability: A Comprehensive Foundation by Tom Theis and Jonathan Tomkin, Editors. Download for free at CNX. (licensed under CC-BY)
- Understanding Bycatch. NOAA Fisheries. Accessed 28 March 2021 (public domain)
- Biological Control and Symbiosis from Biology by John W. Kimball (licensed under CC-BY)
- Environmental Science by Kamala Dorsner
- 47.2C: Managing Fisheries by Boundless has no license indicated.


