
57.1.2: Radiative Differential Heating
- Page ID
- 121556
The general circulation is driven by differential heating. Incoming solar radiation (insolation) nearly balances the outgoing infrared (IR) radiation when averaged over the whole globe. However, at different latitudes are significant imbalances (Fig. \(\PageIndex{1}\)), which cause the differential heating.
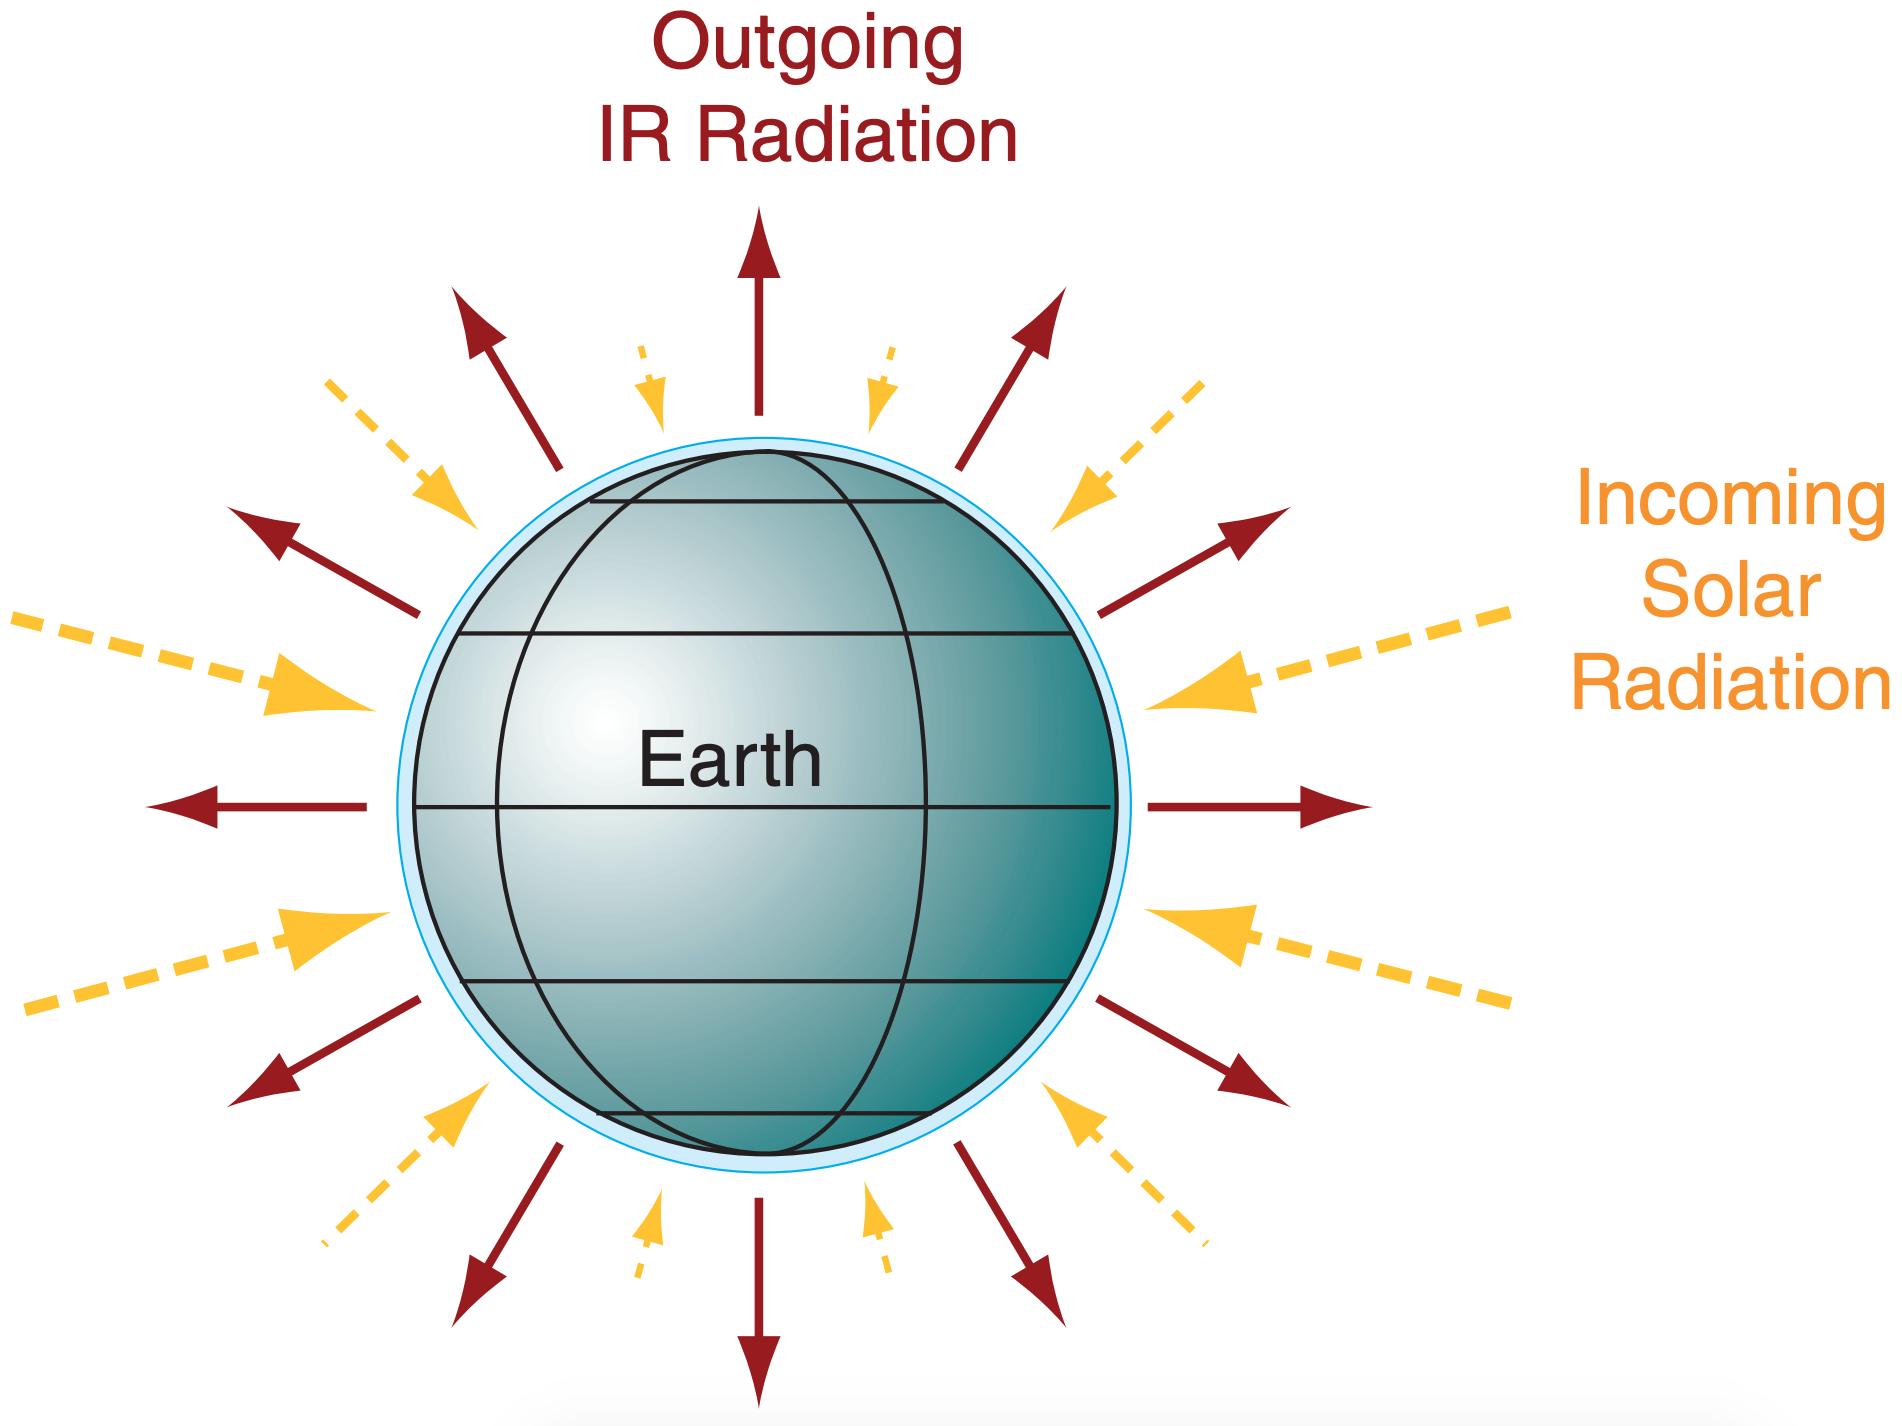
Figure \(\PageIndex{1}\): Annual average incoming solar radiation (yellow dashed arrows) and outgoing infrared (IR) radiation (solid dark red arrows), where arrow length indicates relative magnitude. [Because the Earth rotates and exposes all locations to the sun at one time or another during the year, the incoming solar radiation is sketched as approaching all locations on the Earth’s surface.]
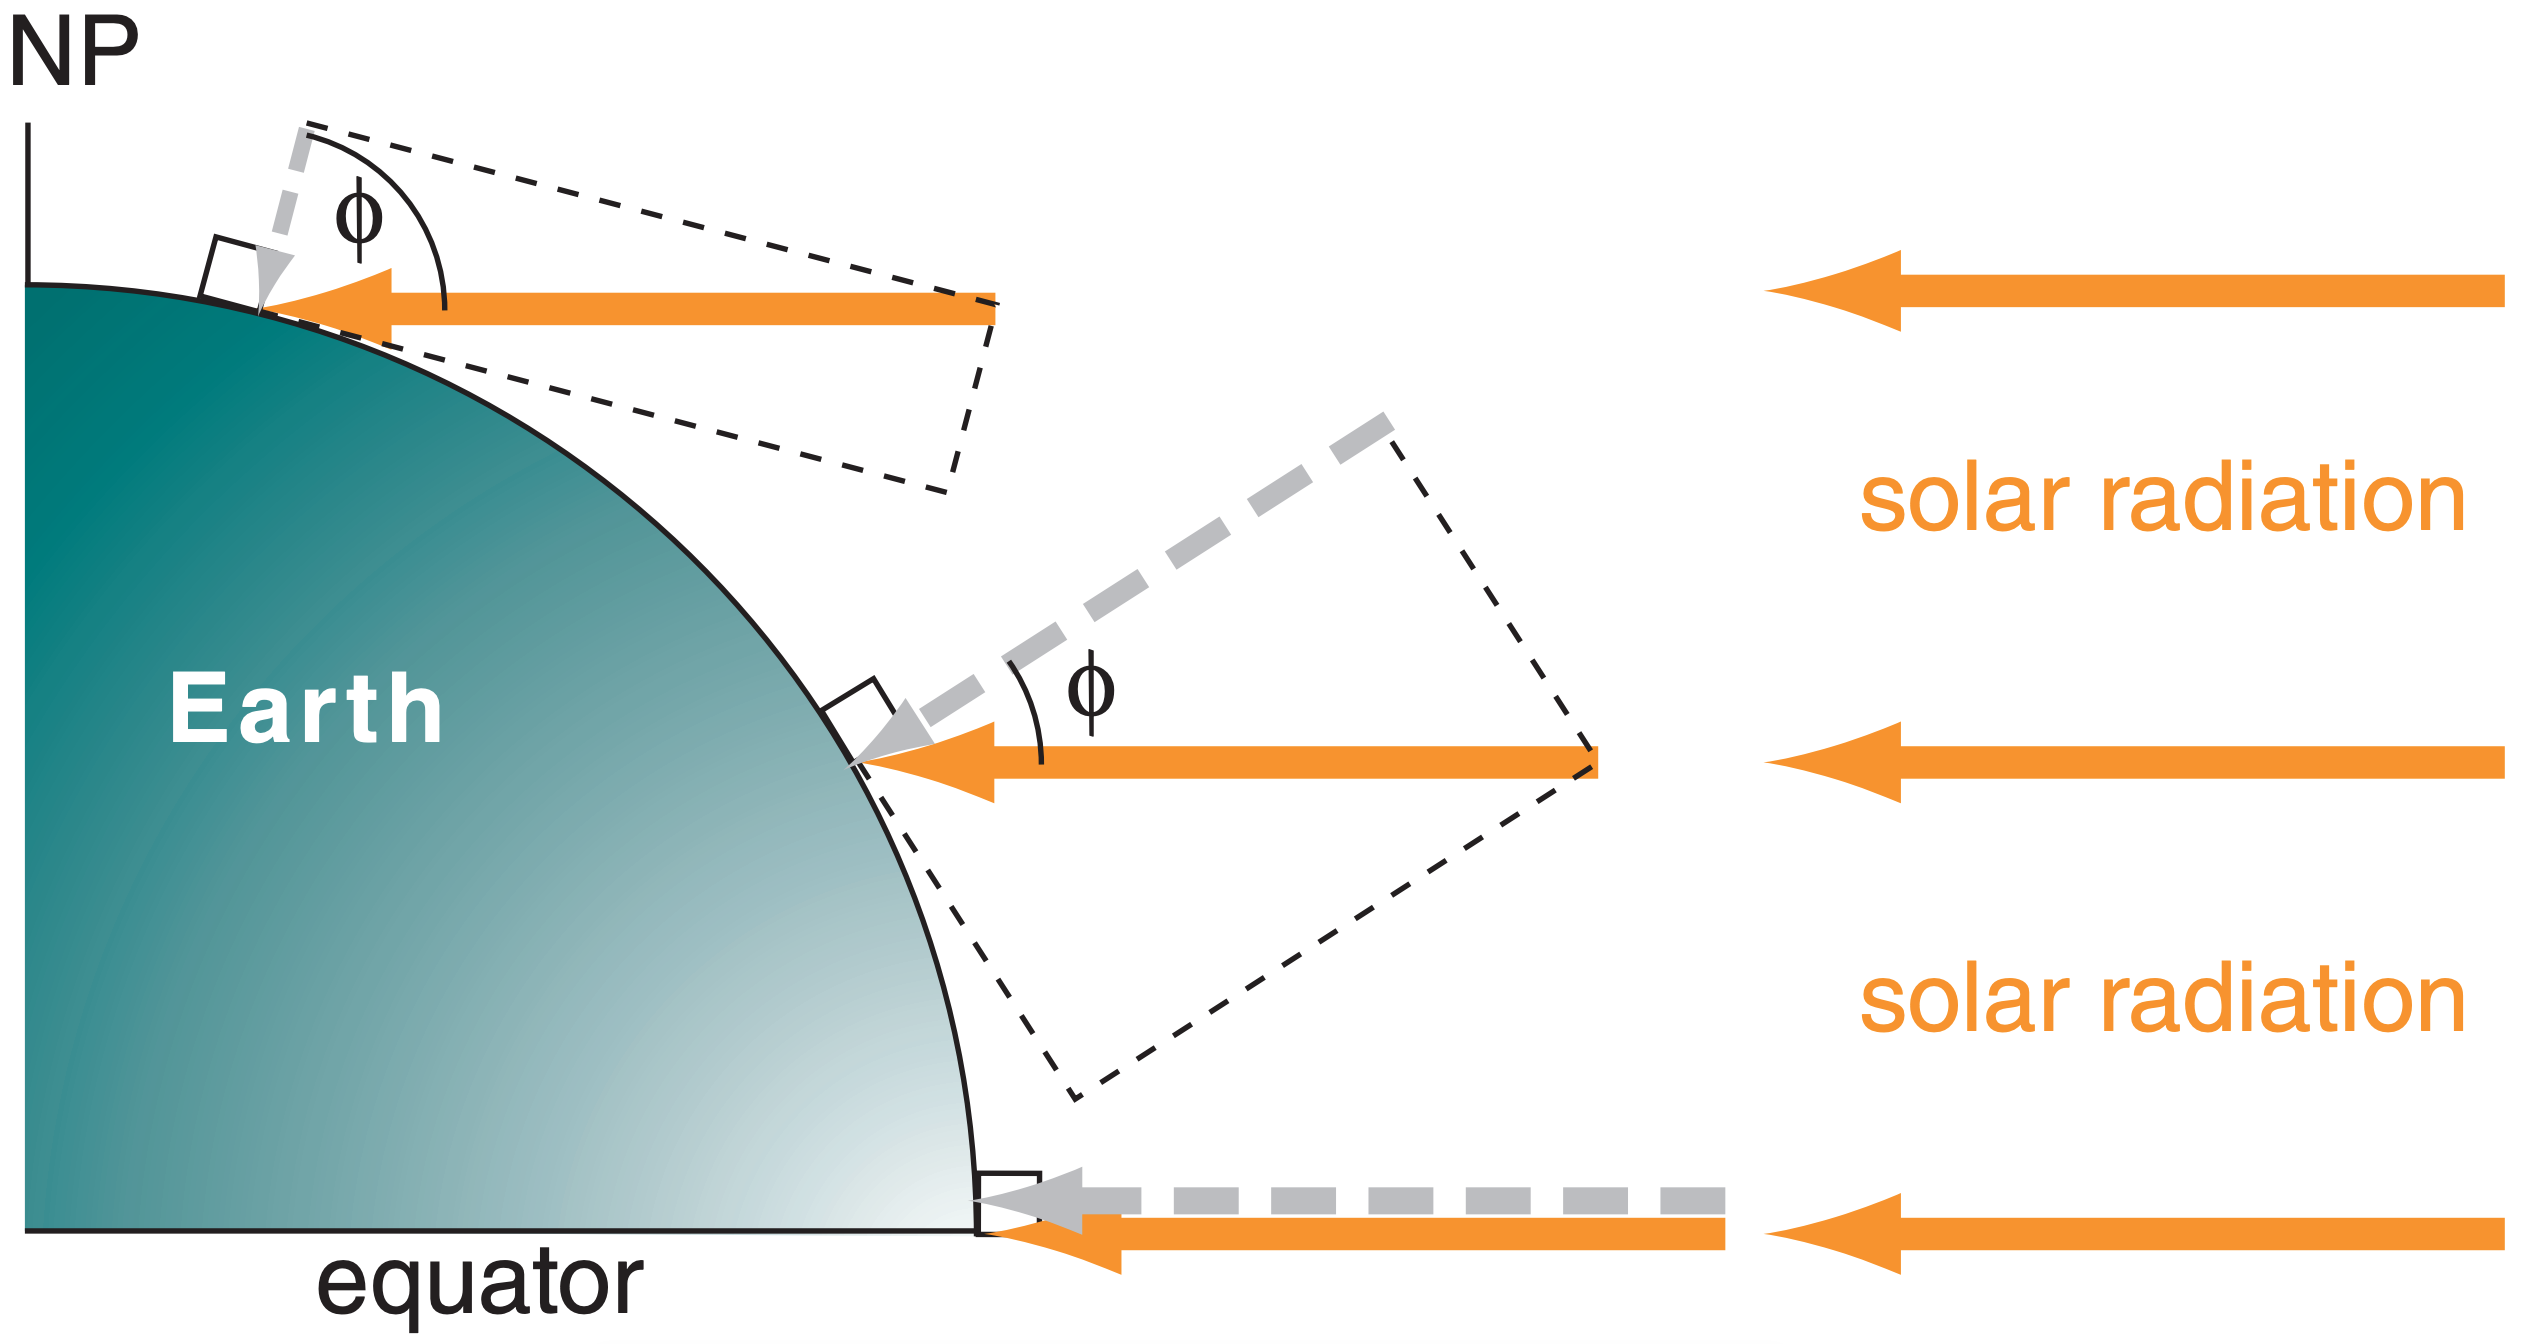
Figure \(\PageIndex{2}\): Of the solar radiation approaching the Earth (thick solid yellow arrows), the component (dashed grey arrow) that is perpendicular to the top of the atmosphere is proportional to the cosine of the latitude ϕ (during the equinox).
Recall from the Solar & Infrared Radiation chapter that the flux of solar radiation incident on the top of the atmosphere depends more or less on the cosine of the latitude, as shown in Fig. \(\PageIndex{2}\). The component of the incident ray of sunlight that is perpendicular to the Earth’s surface is small in polar regions, but larger toward the equator (grey dashed arrows in Figs. \(\PageIndex{1}\) and \(\PageIndex{2}\)). The incoming energy adds heat to the Earth-atmosphere-ocean system.
Heat is lost due to infrared (IR) radiation emitted from the Earth-ocean-atmosphere system to space. Since all locations near the surface in the Earthocean-atmosphere system are relatively warm compared to absolute zero, the Stefan-Boltzmann law from the Solar & Infrared Radiation chapter tells us that the emission rates are also more or less uniform around the Earth. This is sketched by the solid red arrows in Fig. \(\PageIndex{1}\).
Thus, at low latitudes, more solar radiation is absorbed than leaves as IR, causing net warming. At high latitudes, the opposite is true: IR radiative losses exceed solar heating, causing net cooling. This differential heating drives the global circulation.
The general circulation can’t instantly eliminate all the global north-south temperature differences. What remains is a meridional temperature gradient — the focus of the next subsection.
North-South Temperature Gradient
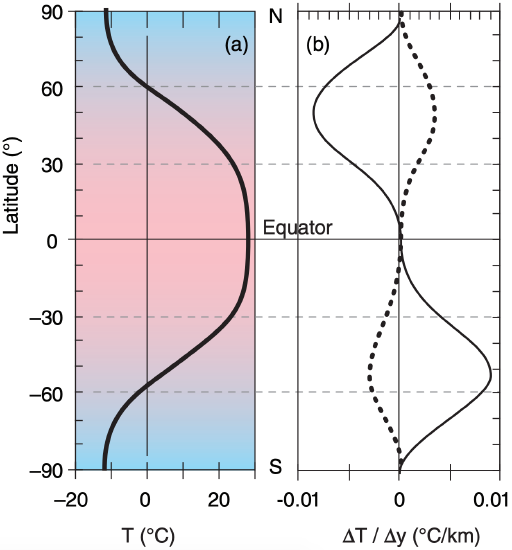
To create a first-order toy model, neglect monthly variations, monsoonal variations and mountains. Instead, focus on surface temperatures averaged around separate latitude belts and over one year. Those latitude belts near the equator are warmer, and those near the poles are colder (Fig. \(\PageIndex{3}\)).