
24.8: Population Dynamics
- Page ID
- 17821

\( \newcommand{\vecs}[1]{\overset { \scriptstyle \rightharpoonup} {\mathbf{#1}} } \)
\( \newcommand{\vecd}[1]{\overset{-\!-\!\rightharpoonup}{\vphantom{a}\smash {#1}}} \)
\( \newcommand{\dsum}{\displaystyle\sum\limits} \)
\( \newcommand{\dint}{\displaystyle\int\limits} \)
\( \newcommand{\dlim}{\displaystyle\lim\limits} \)
\( \newcommand{\id}{\mathrm{id}}\) \( \newcommand{\Span}{\mathrm{span}}\)
( \newcommand{\kernel}{\mathrm{null}\,}\) \( \newcommand{\range}{\mathrm{range}\,}\)
\( \newcommand{\RealPart}{\mathrm{Re}}\) \( \newcommand{\ImaginaryPart}{\mathrm{Im}}\)
\( \newcommand{\Argument}{\mathrm{Arg}}\) \( \newcommand{\norm}[1]{\| #1 \|}\)
\( \newcommand{\inner}[2]{\langle #1, #2 \rangle}\)
\( \newcommand{\Span}{\mathrm{span}}\)
\( \newcommand{\id}{\mathrm{id}}\)
\( \newcommand{\Span}{\mathrm{span}}\)
\( \newcommand{\kernel}{\mathrm{null}\,}\)
\( \newcommand{\range}{\mathrm{range}\,}\)
\( \newcommand{\RealPart}{\mathrm{Re}}\)
\( \newcommand{\ImaginaryPart}{\mathrm{Im}}\)
\( \newcommand{\Argument}{\mathrm{Arg}}\)
\( \newcommand{\norm}[1]{\| #1 \|}\)
\( \newcommand{\inner}[2]{\langle #1, #2 \rangle}\)
\( \newcommand{\Span}{\mathrm{span}}\) \( \newcommand{\AA}{\unicode[.8,0]{x212B}}\)
\( \newcommand{\vectorA}[1]{\vec{#1}} % arrow\)
\( \newcommand{\vectorAt}[1]{\vec{\text{#1}}} % arrow\)
\( \newcommand{\vectorB}[1]{\overset { \scriptstyle \rightharpoonup} {\mathbf{#1}} } \)
\( \newcommand{\vectorC}[1]{\textbf{#1}} \)
\( \newcommand{\vectorD}[1]{\overrightarrow{#1}} \)
\( \newcommand{\vectorDt}[1]{\overrightarrow{\text{#1}}} \)
\( \newcommand{\vectE}[1]{\overset{-\!-\!\rightharpoonup}{\vphantom{a}\smash{\mathbf {#1}}}} \)
\( \newcommand{\vecs}[1]{\overset { \scriptstyle \rightharpoonup} {\mathbf{#1}} } \)
\(\newcommand{\longvect}{\overrightarrow}\)
\( \newcommand{\vecd}[1]{\overset{-\!-\!\rightharpoonup}{\vphantom{a}\smash {#1}}} \)
\(\newcommand{\avec}{\mathbf a}\) \(\newcommand{\bvec}{\mathbf b}\) \(\newcommand{\cvec}{\mathbf c}\) \(\newcommand{\dvec}{\mathbf d}\) \(\newcommand{\dtil}{\widetilde{\mathbf d}}\) \(\newcommand{\evec}{\mathbf e}\) \(\newcommand{\fvec}{\mathbf f}\) \(\newcommand{\nvec}{\mathbf n}\) \(\newcommand{\pvec}{\mathbf p}\) \(\newcommand{\qvec}{\mathbf q}\) \(\newcommand{\svec}{\mathbf s}\) \(\newcommand{\tvec}{\mathbf t}\) \(\newcommand{\uvec}{\mathbf u}\) \(\newcommand{\vvec}{\mathbf v}\) \(\newcommand{\wvec}{\mathbf w}\) \(\newcommand{\xvec}{\mathbf x}\) \(\newcommand{\yvec}{\mathbf y}\) \(\newcommand{\zvec}{\mathbf z}\) \(\newcommand{\rvec}{\mathbf r}\) \(\newcommand{\mvec}{\mathbf m}\) \(\newcommand{\zerovec}{\mathbf 0}\) \(\newcommand{\onevec}{\mathbf 1}\) \(\newcommand{\real}{\mathbb R}\) \(\newcommand{\twovec}[2]{\left[\begin{array}{r}#1 \\ #2 \end{array}\right]}\) \(\newcommand{\ctwovec}[2]{\left[\begin{array}{c}#1 \\ #2 \end{array}\right]}\) \(\newcommand{\threevec}[3]{\left[\begin{array}{r}#1 \\ #2 \\ #3 \end{array}\right]}\) \(\newcommand{\cthreevec}[3]{\left[\begin{array}{c}#1 \\ #2 \\ #3 \end{array}\right]}\) \(\newcommand{\fourvec}[4]{\left[\begin{array}{r}#1 \\ #2 \\ #3 \\ #4 \end{array}\right]}\) \(\newcommand{\cfourvec}[4]{\left[\begin{array}{c}#1 \\ #2 \\ #3 \\ #4 \end{array}\right]}\) \(\newcommand{\fivevec}[5]{\left[\begin{array}{r}#1 \\ #2 \\ #3 \\ #4 \\ #5 \\ \end{array}\right]}\) \(\newcommand{\cfivevec}[5]{\left[\begin{array}{c}#1 \\ #2 \\ #3 \\ #4 \\ #5 \\ \end{array}\right]}\) \(\newcommand{\mattwo}[4]{\left[\begin{array}{rr}#1 \amp #2 \\ #3 \amp #4 \\ \end{array}\right]}\) \(\newcommand{\laspan}[1]{\text{Span}\{#1\}}\) \(\newcommand{\bcal}{\cal B}\) \(\newcommand{\ccal}{\cal C}\) \(\newcommand{\scal}{\cal S}\) \(\newcommand{\wcal}{\cal W}\) \(\newcommand{\ecal}{\cal E}\) \(\newcommand{\coords}[2]{\left\{#1\right\}_{#2}}\) \(\newcommand{\gray}[1]{\color{gray}{#1}}\) \(\newcommand{\lgray}[1]{\color{lightgray}{#1}}\) \(\newcommand{\rank}{\operatorname{rank}}\) \(\newcommand{\row}{\text{Row}}\) \(\newcommand{\col}{\text{Col}}\) \(\renewcommand{\row}{\text{Row}}\) \(\newcommand{\nul}{\text{Nul}}\) \(\newcommand{\var}{\text{Var}}\) \(\newcommand{\corr}{\text{corr}}\) \(\newcommand{\len}[1]{\left|#1\right|}\) \(\newcommand{\bbar}{\overline{\bvec}}\) \(\newcommand{\bhat}{\widehat{\bvec}}\) \(\newcommand{\bperp}{\bvec^\perp}\) \(\newcommand{\xhat}{\widehat{\xvec}}\) \(\newcommand{\vhat}{\widehat{\vvec}}\) \(\newcommand{\uhat}{\widehat{\uvec}}\) \(\newcommand{\what}{\widehat{\wvec}}\) \(\newcommand{\Sighat}{\widehat{\Sigma}}\) \(\newcommand{\lt}{<}\) \(\newcommand{\gt}{>}\) \(\newcommand{\amp}{&}\) \(\definecolor{fillinmathshade}{gray}{0.9}\)Population growth refers to changes in population size over time. Figure \(\PageIndex{1}\) illustrates one way that populations grow: adding babies through births. Can you think of other ways that populations change in size in a given area?
Patterns of Population Growth
Populations are dynamic. They are continuously gaining individuals through births and losing individuals through deaths. Populations may also gain or lose a significant number of individuals through migration when people either enter or leave a population. All of these factors together determine whether and how quickly a population grows. Population growth rates may change over time. Two well-studied patterns of change in population growth rates are exponential and logistic growth.
Exponential and Logistic Growth
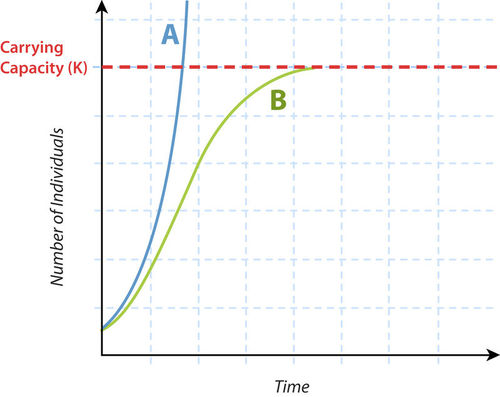
Under ideal conditions, populations of most species, including Homo sapiens, have the potential for exponential growth, represented by curve A in Figure \(\PageIndex{2}\). With exponential growth, the population starts out growing slowly, but as population size increases, the growth rate also increases. The larger the population becomes, the more quickly it grows.
Almost no populations live under ideal conditions. Therefore, most do not grow exponentially, at least not indefinitely. They may start outgrowing exponentially, but sooner or later, something will limit their growth. Many factors may limit population growth so it slows down or even stops. Often, the factors are density-dependent. Density-dependent factors are those that cause population growth to slow down when the population becomes too large and crowded. For example, the population may start to run out of food, or crowding may lead to infectious disease epidemics. More deaths may occur or more people may emigrate, causing population growth to slow and population size to level off. Curve B inFigure \(\PageIndex{2}\) represents this pattern of growth, which is called logistic growth.
At what size does a population stop growing in the logistic growth pattern? That depends on the population’s carrying capacity (Figure \(\PageIndex{2}\)). The carrying capacity (K) is the largest population size that can be supported by available resources without harming the environment. Population growth hits a ceiling at that size in the logistic growth model.
Exponential Growth of the Human Population
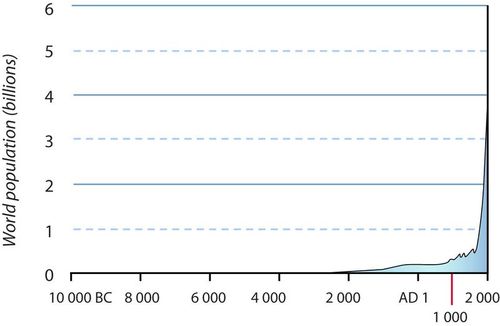
For most of our species’ existence, the global population grew very slowly. Then, starting a few centuries ago, the human population started to grow exponentially. You can see this clearly in the graph in Figure \(\PageIndex{3}\). It took the human population many millennia to reach 1 billion people, which occurred around 1800 CE. After that, it took only a little over a century for the number to reach 2 billion. In less than another century, we added another 5 billion people, reaching a total of 7 billion people by 2012. Today, the human population is rapidly approaching the 8 billion mark. At a global growth rate of 1.03 percent in 2021, we are adding a net number of more than 80 million people each year. If that growth rate were to continue, the total human population would double in just 58 years.
Is it possible for the human population to keep growing at 1.2 percent? The late-18th century economist Thomas Malthus predicted that the continued rapid growth of the human population would soon outstrip food production, leading to increasing famine and higher death rates. This would be evidence that the population had reached its carrying capacity and could no longer keep growing. Unless population growth was reigned in before the carrying capacity was reached, Malthus argued, there would be a population crash caused by heightened warfare, malnutrition, and disease.
Overpopulation
Since Malthus made his dire warning, the human population has grown from just under a billion to more than 7 billion people. Has the human population already reached or surpassed its carrying capacity? Is the planet overpopulated with people? Do we have a human overpopulation problem?
Human Carrying Capacity
Attempts to calculate the carrying capacity for the global human population have produced widely varying estimates. However, a meta-analysis of 69 such studies concluded that the best estimate of the human carrying capacity is 7.7 billion people. The human population is projected to reach 10.88 billion people by the year 2100. If these estimates are correct, it suggests that the human population is at the tipping point and must stop growing. Some human populations already suffer shortages of food, water, and other resources; and our use and acquisition of resources have already damaged the environment. Such evidence suggests that we have reached our carrying capacity and there really is an overpopulation problem.
Not Just Overpopulation
Although many environmental problems are aggravated by the size of the human population, some experts think that over-consumption and waste by populations in wealthy nations are worse problems than sheer human population numbers. People in the more-developed nations use resources at a rate more than 30 times greater than the rate in less-developed nations, where the majority of people live today. If everyone used resources at the rate of people in developed countries, the total human population would need more than one planet Earth to supply their demands. Reducing profligate consumption of resources and our ecological footprint are clearly needed to help solve the overpopulation problem.
Slowing Human Population Growth
Environmental problems are not caused solely by human overpopulation. However, having so many people on the planet certainly makes problems worse, so it is important to reduce the rate of human population growth. A widely accepted goal is an overall zero growth rate for the human population. Zero population growth (ZPG) occurs when the birth rate equals the death rate (assuming no net migration for the human population as a whole). ZPG can be achieved if women average only enough children to replace themselves and their partners in the population. This is called the replacement fertility rate. It ranges from just over 2 to almost 3 children per woman, depending on the death rate. At a higher death rate, the replacement fertility rate is higher because fewer children survive to adulthood to replace their parents in the population. Even if the fertility rate falls to the replacement level, however, there will still be a time lag before the population growth rate levels off. That’s because populations that have recently had high birth rates have a youthful age distribution, with a large proportion of women at peak childbearing ages. With so many young women, the population birth rate will remain high for at least another generation.
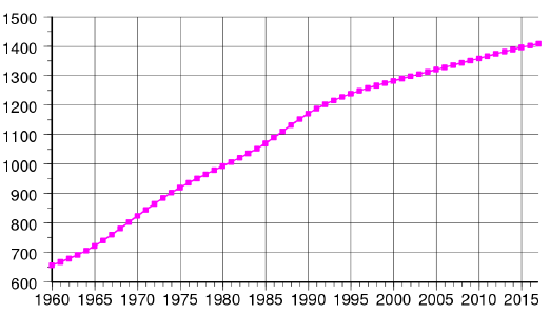
Childbearing is a deeply important and personal decision that is influenced by many socioeconomic and cultural factors. Obviously, trying to influence how many children women have is a complex problem. A top-down approach was instituted in China in 1979 when it enacted a one-child-per-woman policy. The Chinese government has credited the policy with reducing China’s population by 400 million people. However, China’s fertility rate was already falling when the policy was put into effect, so the impact of the policy is disputed. The actual growth of the Chinese population is shown in the graph in Figure \(\PageIndex{4}\). The tiny dip in the curve starting around 1979 suggests the policy’s impact on population growth was minimal.
Unlike in China, most countries do not have direct policies to limit fertility rates. However, evidence from many populations shows that women start having fewer children when there are more educational and economic opportunities for females, advances in gender equality, greater knowledge of family planning, and better access to contraception. Needless to say, such society-wide changes are often very difficult to achieve and require multiple approaches, but the future of our species may depend on them.
Feature: Human Biology in the News
Just days into his presidency on January 23, 2017, and surrounded solely by male members of his administration, President Donald Trump signed an executive order reinstating the so-called “Mexico City Policy.” This policy also referred to as the “global gag rule,” was first put into effect by President Ronald Reagan in 1984. The policy withholds U.S. government funding from any international non-governmental organization that performs or promotes abortions as a family planning option. The Mexico City Policy was rescinded by the Clinton Administration in 1993, reinstated by the Bush Administration in 2001, and rescinded again by the Obama Administration in 2009.
While Trump’s reinstatement of the Mexico City Policy was praised by Republican politicians and anti-abortion activists, Democratic politicians and abortion-rights activists reacted to it with newsworthy alarm. They called the reinstatement a “catastrophe” for women in less-developed countries, arguing that it will lead to large increases in unintended pregnancies, unsafe abortions, and neonatal and maternal deaths.
The Mexico City Policy shows how politically charged the control of fertility can be. However, promoting family planning in high-fertility populations is an important part of the solution to the overpopulation problem. Unless fertility is reduced to replacement levels, human populations will continue to grow.
Review
- Why are populations dynamic?
- What factors determine the growth rate of the human population?
- Describe variation in recent human population growth rates.
- Compare and contrast exponential and logistic patterns of population growth.
- Define carrying capacity.
- Briefly summarize how the population of the human species has grown.
- Discuss evidence for and concerns about human overpopulation.
- Define the replacement fertility rate, and explain why it depends on the death rate.
- Assuming the death rate remains constant, why is there a time lag between a decrease in fertility and the slowing of population growth?
- Identify evidence-based factors that lead to fertility decline.
Explore More
Watch this video to learn more about population dynamics.
Attributions
- Kids at daycare by Grant Barrett, CC BY 2.0 via Wikimedia Commons
- Population growth patterns by Hana Zavadska via CK-12 licensed CC BY-NC 3.0
- Growth of the human population by Hana Zavadska via CK-12 CC BY-NC 3.0
- China Demography by Quilokos, Demmo, CC BY 3.0 via Wikimedia Commons
- Text adapted from Human Biology by CK-12 licensed CC BY-NC 3.0