
12.2: The Rate of Human Population Growth
- Page ID
- 33897

\( \newcommand{\vecs}[1]{\overset { \scriptstyle \rightharpoonup} {\mathbf{#1}} } \)
\( \newcommand{\vecd}[1]{\overset{-\!-\!\rightharpoonup}{\vphantom{a}\smash {#1}}} \)
\( \newcommand{\dsum}{\displaystyle\sum\limits} \)
\( \newcommand{\dint}{\displaystyle\int\limits} \)
\( \newcommand{\dlim}{\displaystyle\lim\limits} \)
\( \newcommand{\id}{\mathrm{id}}\) \( \newcommand{\Span}{\mathrm{span}}\)
( \newcommand{\kernel}{\mathrm{null}\,}\) \( \newcommand{\range}{\mathrm{range}\,}\)
\( \newcommand{\RealPart}{\mathrm{Re}}\) \( \newcommand{\ImaginaryPart}{\mathrm{Im}}\)
\( \newcommand{\Argument}{\mathrm{Arg}}\) \( \newcommand{\norm}[1]{\| #1 \|}\)
\( \newcommand{\inner}[2]{\langle #1, #2 \rangle}\)
\( \newcommand{\Span}{\mathrm{span}}\)
\( \newcommand{\id}{\mathrm{id}}\)
\( \newcommand{\Span}{\mathrm{span}}\)
\( \newcommand{\kernel}{\mathrm{null}\,}\)
\( \newcommand{\range}{\mathrm{range}\,}\)
\( \newcommand{\RealPart}{\mathrm{Re}}\)
\( \newcommand{\ImaginaryPart}{\mathrm{Im}}\)
\( \newcommand{\Argument}{\mathrm{Arg}}\)
\( \newcommand{\norm}[1]{\| #1 \|}\)
\( \newcommand{\inner}[2]{\langle #1, #2 \rangle}\)
\( \newcommand{\Span}{\mathrm{span}}\) \( \newcommand{\AA}{\unicode[.8,0]{x212B}}\)
\( \newcommand{\vectorA}[1]{\vec{#1}} % arrow\)
\( \newcommand{\vectorAt}[1]{\vec{\text{#1}}} % arrow\)
\( \newcommand{\vectorB}[1]{\overset { \scriptstyle \rightharpoonup} {\mathbf{#1}} } \)
\( \newcommand{\vectorC}[1]{\textbf{#1}} \)
\( \newcommand{\vectorD}[1]{\overrightarrow{#1}} \)
\( \newcommand{\vectorDt}[1]{\overrightarrow{\text{#1}}} \)
\( \newcommand{\vectE}[1]{\overset{-\!-\!\rightharpoonup}{\vphantom{a}\smash{\mathbf {#1}}}} \)
\( \newcommand{\vecs}[1]{\overset { \scriptstyle \rightharpoonup} {\mathbf{#1}} } \)
\(\newcommand{\longvect}{\overrightarrow}\)
\( \newcommand{\vecd}[1]{\overset{-\!-\!\rightharpoonup}{\vphantom{a}\smash {#1}}} \)
\(\newcommand{\avec}{\mathbf a}\) \(\newcommand{\bvec}{\mathbf b}\) \(\newcommand{\cvec}{\mathbf c}\) \(\newcommand{\dvec}{\mathbf d}\) \(\newcommand{\dtil}{\widetilde{\mathbf d}}\) \(\newcommand{\evec}{\mathbf e}\) \(\newcommand{\fvec}{\mathbf f}\) \(\newcommand{\nvec}{\mathbf n}\) \(\newcommand{\pvec}{\mathbf p}\) \(\newcommand{\qvec}{\mathbf q}\) \(\newcommand{\svec}{\mathbf s}\) \(\newcommand{\tvec}{\mathbf t}\) \(\newcommand{\uvec}{\mathbf u}\) \(\newcommand{\vvec}{\mathbf v}\) \(\newcommand{\wvec}{\mathbf w}\) \(\newcommand{\xvec}{\mathbf x}\) \(\newcommand{\yvec}{\mathbf y}\) \(\newcommand{\zvec}{\mathbf z}\) \(\newcommand{\rvec}{\mathbf r}\) \(\newcommand{\mvec}{\mathbf m}\) \(\newcommand{\zerovec}{\mathbf 0}\) \(\newcommand{\onevec}{\mathbf 1}\) \(\newcommand{\real}{\mathbb R}\) \(\newcommand{\twovec}[2]{\left[\begin{array}{r}#1 \\ #2 \end{array}\right]}\) \(\newcommand{\ctwovec}[2]{\left[\begin{array}{c}#1 \\ #2 \end{array}\right]}\) \(\newcommand{\threevec}[3]{\left[\begin{array}{r}#1 \\ #2 \\ #3 \end{array}\right]}\) \(\newcommand{\cthreevec}[3]{\left[\begin{array}{c}#1 \\ #2 \\ #3 \end{array}\right]}\) \(\newcommand{\fourvec}[4]{\left[\begin{array}{r}#1 \\ #2 \\ #3 \\ #4 \end{array}\right]}\) \(\newcommand{\cfourvec}[4]{\left[\begin{array}{c}#1 \\ #2 \\ #3 \\ #4 \end{array}\right]}\) \(\newcommand{\fivevec}[5]{\left[\begin{array}{r}#1 \\ #2 \\ #3 \\ #4 \\ #5 \\ \end{array}\right]}\) \(\newcommand{\cfivevec}[5]{\left[\begin{array}{c}#1 \\ #2 \\ #3 \\ #4 \\ #5 \\ \end{array}\right]}\) \(\newcommand{\mattwo}[4]{\left[\begin{array}{rr}#1 \amp #2 \\ #3 \amp #4 \\ \end{array}\right]}\) \(\newcommand{\laspan}[1]{\text{Span}\{#1\}}\) \(\newcommand{\bcal}{\cal B}\) \(\newcommand{\ccal}{\cal C}\) \(\newcommand{\scal}{\cal S}\) \(\newcommand{\wcal}{\cal W}\) \(\newcommand{\ecal}{\cal E}\) \(\newcommand{\coords}[2]{\left\{#1\right\}_{#2}}\) \(\newcommand{\gray}[1]{\color{gray}{#1}}\) \(\newcommand{\lgray}[1]{\color{lightgray}{#1}}\) \(\newcommand{\rank}{\operatorname{rank}}\) \(\newcommand{\row}{\text{Row}}\) \(\newcommand{\col}{\text{Col}}\) \(\renewcommand{\row}{\text{Row}}\) \(\newcommand{\nul}{\text{Nul}}\) \(\newcommand{\var}{\text{Var}}\) \(\newcommand{\corr}{\text{corr}}\) \(\newcommand{\len}[1]{\left|#1\right|}\) \(\newcommand{\bbar}{\overline{\bvec}}\) \(\newcommand{\bhat}{\widehat{\bvec}}\) \(\newcommand{\bperp}{\bvec^\perp}\) \(\newcommand{\xhat}{\widehat{\xvec}}\) \(\newcommand{\vhat}{\widehat{\vvec}}\) \(\newcommand{\uhat}{\widehat{\uvec}}\) \(\newcommand{\what}{\widehat{\wvec}}\) \(\newcommand{\Sighat}{\widehat{\Sigma}}\) \(\newcommand{\lt}{<}\) \(\newcommand{\gt}{>}\) \(\newcommand{\amp}{&}\) \(\definecolor{fillinmathshade}{gray}{0.9}\)Demographic Transition
Recall from the Populations chapter that the population growth rate (r) equals the birth rate minus the death rate. Slowly declining birth rates following an earlier sharp decline in death rates are today characteristic of most of the less-developed regions of the world. The shift from high birth and death rates to low birth as well as death rates is called the demographic transition.
Prior to World War II, advances in public health were largely limited to affluent, industrialized countries. But since then, many more countries have enjoyed improvements in public health - always with dramatic effect on death rates. For example, in 1945, the death rate in Sri Lanka (then called Ceylon) was 0.022 (2.2%). In 1946, a large-scale program to control mosquitos, which transmit malaria, was started. By eliminating the mosquito, the incidence of malaria dropped sharply. After 9 years, the death rate dropped to 0.010 (1%), and by 2012 was 0.006 (0.6%). However, a compensating decline in birth rates has come more slowly; the birth rate was 0.018 (1.8% in 2012). With birth rates higher than death rates, the population was increasing at an annual rate of 0.012 (1.2%) per year, with a doubling time of 57.5 years (t = 0.69/0.012).
Predicting Future Population Size
Doubling time is based on a constant population growth rate, but this rate can change depending on a number of factors, including total fertility rate (TFR) and the age structure of the population.
Total Fertility Rate
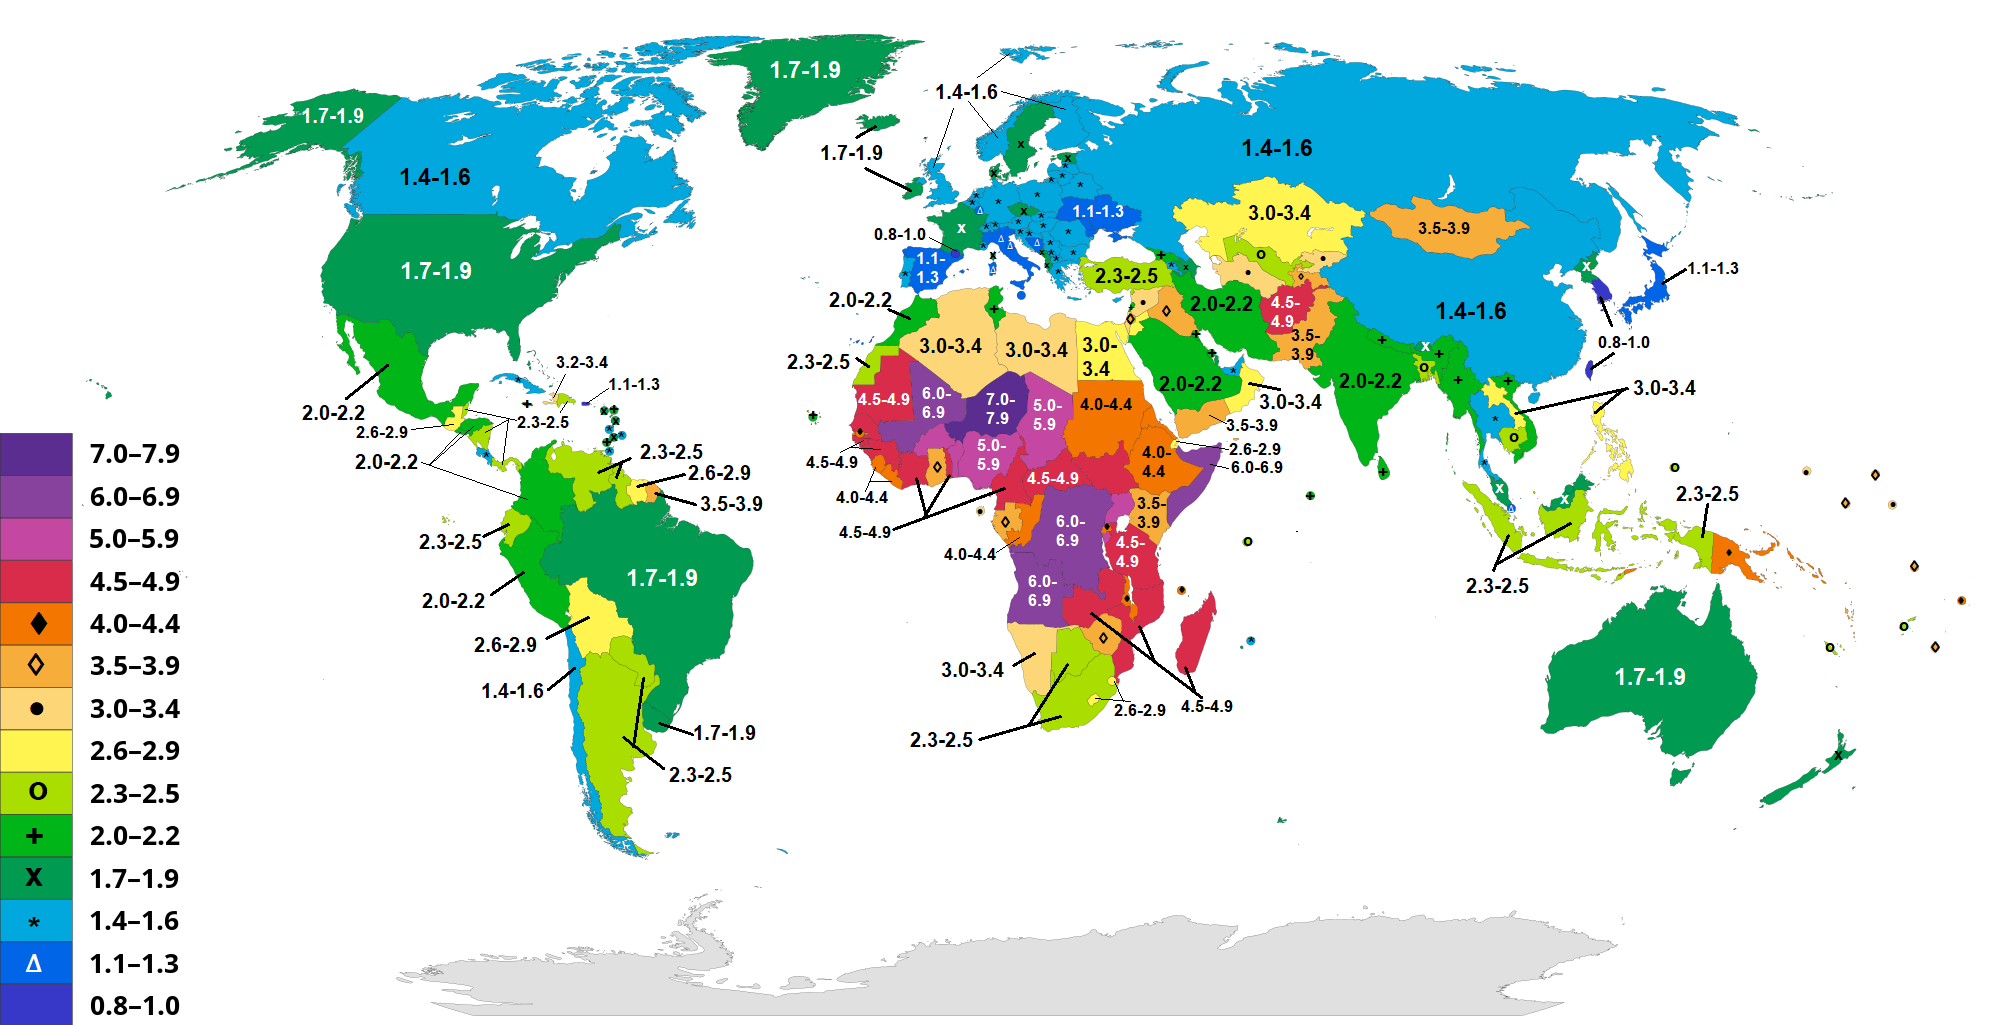
The total fertility rate (TFR) is the average number of children that each woman will have during her lifetime. The TFR is an average because, of course, some women will have more, some fewer, and some no children at all. Theoretically, when the TFR = 2, each pair of parents just replaces itself. Actually it takes a TFR of 2.1 or 2.2 to replace each generation - this number is called the replacement fertility rate - because some children will die before they grow up to have their own two children. In countries with low life expectancies, the replacement rate is even higher (2.2–3). Figure \(\PageIndex{a}\) compares the total fertility rate in different countries.
Age Structure
The age structure of a population, the proportion of a population in different age classes, is an important factor in population dynamics. The relationship between TFR and the population growth rate (r) depends on age structure. For example, if at one period a population has an unusually large number of children, they will — as they pass through their childbearing years — increase the r of the population even if their TFR goes no higher than 2. Most people have children between the ages of 15 and 49. So if a population has a large number of young people just entering their reproductive years, the rate of growth of that population is sure to rise.
Models that incorporate age structure allow better prediction of population growth, plus the ability to associate this growth with the level of economic development in a region. Countries with rapid growth associated with high birth rates have a pyramidal shape in their age structure diagrams, showing a preponderance of younger individuals, many of whom are of reproductive age (figure \(\PageIndex{b}\)).
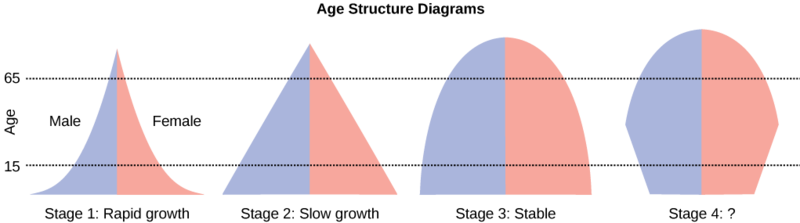
The age structure of a population also reflects the recent pattern of mortality. In countries where injuries, starvation, and disease, etc. take a heavy toll throughout life, the age structure diagram has a broad base. In countries where almost everyone survives until old age, the bases is narrower.
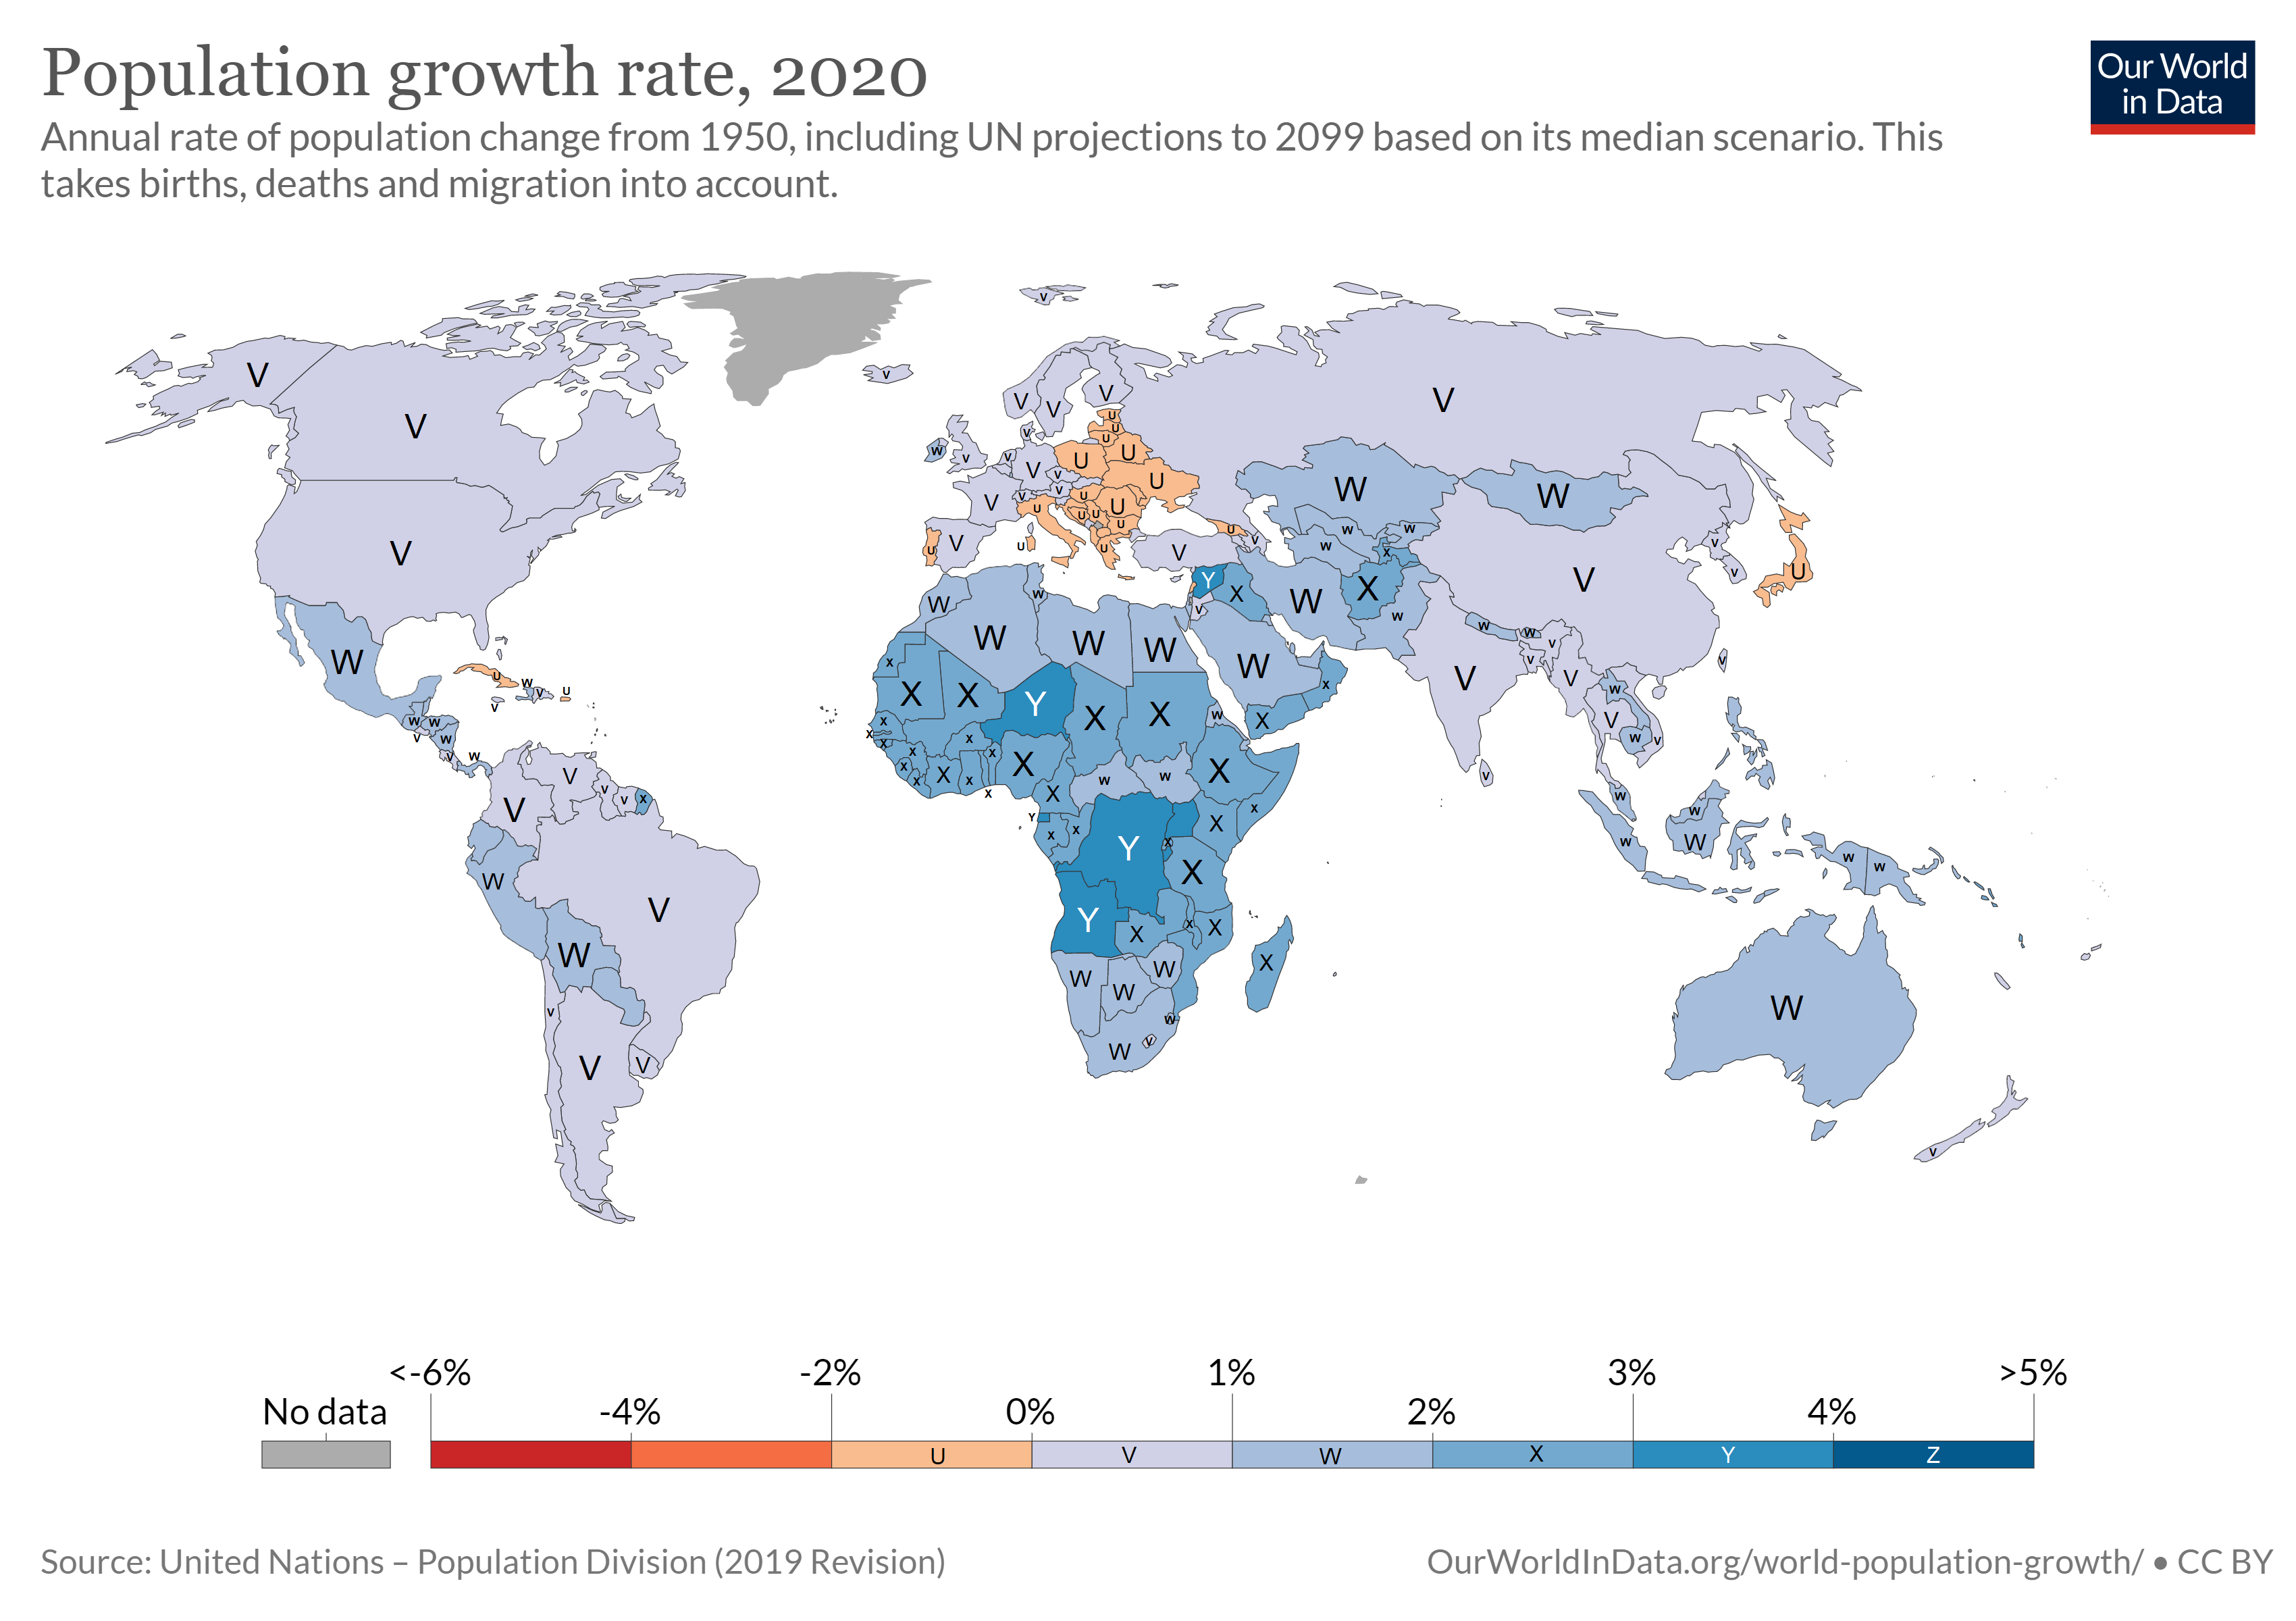
Rapid growth is most often observed in underdeveloped countries where individuals do not live to old age because of less-than-optimal living conditions, and there is a high birth rate. Age structures of areas with slow growth, including developed countries such as the United States, still have a pyramidal structure, but with many fewer young and reproductive-aged individuals and a greater proportion of older individuals compared to underdeveloped countries. Other developed countries, such as Italy, have zero population growth. The age structure of these populations is more conical, with an even greater percentage of middle-aged and older individuals.The actual growth rates in different countries are shown in figure \(\PageIndex{c}\), with the highest rates tending to be in the less economically developed countries of Africa and Asia.
The U.S. Baby Boom
The TFR in the United States declined from more than 4 late in the nineteenth century to less than replacement in the early 1930s. However, when the small numbers of children born in the depression years reached adulthood, they went on a childbearing spree that produced the baby-boom generation (figure \(\PageIndex{d}\)). In 1957, more children were born in the United States than ever before (or since).
Attribution
Modified by Melissa Ha from the following sources:
- The Human Population from Biology by John W. Kimball (licensed under CC-BY)
- The Human Population from Environmental Biology by Matthew R. Fisher (licensed under CC-BY)