
9.5: Data Dive- Biodiversity and Drugs
- Page ID
- 46706

\( \newcommand{\vecs}[1]{\overset { \scriptstyle \rightharpoonup} {\mathbf{#1}} } \) \( \newcommand{\vecd}[1]{\overset{-\!-\!\rightharpoonup}{\vphantom{a}\smash {#1}}} \)\(\newcommand{\id}{\mathrm{id}}\) \( \newcommand{\Span}{\mathrm{span}}\) \( \newcommand{\kernel}{\mathrm{null}\,}\) \( \newcommand{\range}{\mathrm{range}\,}\) \( \newcommand{\RealPart}{\mathrm{Re}}\) \( \newcommand{\ImaginaryPart}{\mathrm{Im}}\) \( \newcommand{\Argument}{\mathrm{Arg}}\) \( \newcommand{\norm}[1]{\| #1 \|}\) \( \newcommand{\inner}[2]{\langle #1, #2 \rangle}\) \( \newcommand{\Span}{\mathrm{span}}\) \(\newcommand{\id}{\mathrm{id}}\) \( \newcommand{\Span}{\mathrm{span}}\) \( \newcommand{\kernel}{\mathrm{null}\,}\) \( \newcommand{\range}{\mathrm{range}\,}\) \( \newcommand{\RealPart}{\mathrm{Re}}\) \( \newcommand{\ImaginaryPart}{\mathrm{Im}}\) \( \newcommand{\Argument}{\mathrm{Arg}}\) \( \newcommand{\norm}[1]{\| #1 \|}\) \( \newcommand{\inner}[2]{\langle #1, #2 \rangle}\) \( \newcommand{\Span}{\mathrm{span}}\)\(\newcommand{\AA}{\unicode[.8,0]{x212B}}\)
Overview
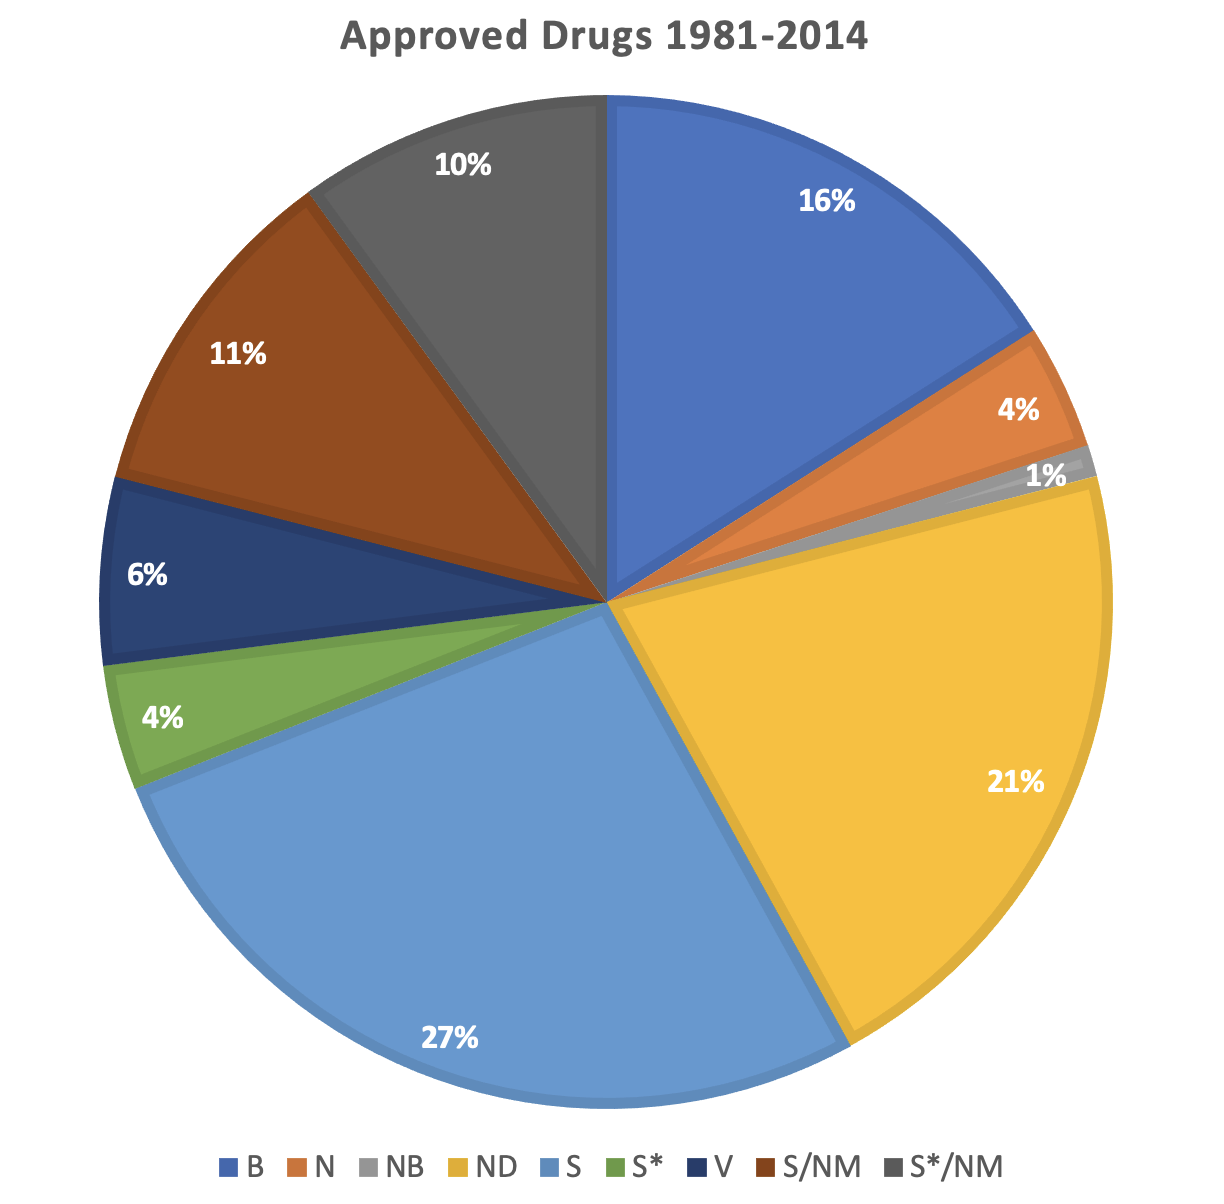
Global biodiversity continues to contribute significantly to the production of drugs. A 2016 paper reviewed drug sources for both synthetic and natural categories from 1981 to 2014. The figure below below displays the categories used in the analysis and a graph breaking down their results:
- “B”: Biological macromolecule
- “N”: Unaltered natural product, however, could have been semi- or totally synthetic
- “NB”: Natural product “botanical drug”
- “ND”: Natural product derivative
- “S”: Synthetic drug
- “S*”: Synthetic drug (NP pharmacophore)
- “V”: Vaccine
- “S-VM”: Natural product mimic of “S”
- “S*-VM”: Natural product mimic of “S*”
Questions
- What question(s) are the authors trying to answer with this graph?
- What are the top three largest approved drug categories?
- After reading over the categories outlined, provide your impression/reflection for all the categories that were identified.
- What reason could you provide as to why the N and NB categories are so small compared to ND?
- Do you think the results of this graph can be used as a defense of saving/conserving biodiversity now and into the future? Why?
Raw Data From Above Graph(s)
Table \(\PageIndex{a}\): Raw data for percent of drugs approved between 1981 and 2004 with either a synthetic or natural sub-classification. Graph by Rachel Schleiger (CC-BY-NC) modified from data in Newman DJ and Cragg GM 2016.