
15.2: Epidemiology
- Page ID
- 32826

\( \newcommand{\vecs}[1]{\overset { \scriptstyle \rightharpoonup} {\mathbf{#1}} } \)
\( \newcommand{\vecd}[1]{\overset{-\!-\!\rightharpoonup}{\vphantom{a}\smash {#1}}} \)
\( \newcommand{\dsum}{\displaystyle\sum\limits} \)
\( \newcommand{\dint}{\displaystyle\int\limits} \)
\( \newcommand{\dlim}{\displaystyle\lim\limits} \)
\( \newcommand{\id}{\mathrm{id}}\) \( \newcommand{\Span}{\mathrm{span}}\)
( \newcommand{\kernel}{\mathrm{null}\,}\) \( \newcommand{\range}{\mathrm{range}\,}\)
\( \newcommand{\RealPart}{\mathrm{Re}}\) \( \newcommand{\ImaginaryPart}{\mathrm{Im}}\)
\( \newcommand{\Argument}{\mathrm{Arg}}\) \( \newcommand{\norm}[1]{\| #1 \|}\)
\( \newcommand{\inner}[2]{\langle #1, #2 \rangle}\)
\( \newcommand{\Span}{\mathrm{span}}\)
\( \newcommand{\id}{\mathrm{id}}\)
\( \newcommand{\Span}{\mathrm{span}}\)
\( \newcommand{\kernel}{\mathrm{null}\,}\)
\( \newcommand{\range}{\mathrm{range}\,}\)
\( \newcommand{\RealPart}{\mathrm{Re}}\)
\( \newcommand{\ImaginaryPart}{\mathrm{Im}}\)
\( \newcommand{\Argument}{\mathrm{Arg}}\)
\( \newcommand{\norm}[1]{\| #1 \|}\)
\( \newcommand{\inner}[2]{\langle #1, #2 \rangle}\)
\( \newcommand{\Span}{\mathrm{span}}\) \( \newcommand{\AA}{\unicode[.8,0]{x212B}}\)
\( \newcommand{\vectorA}[1]{\vec{#1}} % arrow\)
\( \newcommand{\vectorAt}[1]{\vec{\text{#1}}} % arrow\)
\( \newcommand{\vectorB}[1]{\overset { \scriptstyle \rightharpoonup} {\mathbf{#1}} } \)
\( \newcommand{\vectorC}[1]{\textbf{#1}} \)
\( \newcommand{\vectorD}[1]{\overrightarrow{#1}} \)
\( \newcommand{\vectorDt}[1]{\overrightarrow{\text{#1}}} \)
\( \newcommand{\vectE}[1]{\overset{-\!-\!\rightharpoonup}{\vphantom{a}\smash{\mathbf {#1}}}} \)
\( \newcommand{\vecs}[1]{\overset { \scriptstyle \rightharpoonup} {\mathbf{#1}} } \)
\(\newcommand{\longvect}{\overrightarrow}\)
\( \newcommand{\vecd}[1]{\overset{-\!-\!\rightharpoonup}{\vphantom{a}\smash {#1}}} \)
\(\newcommand{\avec}{\mathbf a}\) \(\newcommand{\bvec}{\mathbf b}\) \(\newcommand{\cvec}{\mathbf c}\) \(\newcommand{\dvec}{\mathbf d}\) \(\newcommand{\dtil}{\widetilde{\mathbf d}}\) \(\newcommand{\evec}{\mathbf e}\) \(\newcommand{\fvec}{\mathbf f}\) \(\newcommand{\nvec}{\mathbf n}\) \(\newcommand{\pvec}{\mathbf p}\) \(\newcommand{\qvec}{\mathbf q}\) \(\newcommand{\svec}{\mathbf s}\) \(\newcommand{\tvec}{\mathbf t}\) \(\newcommand{\uvec}{\mathbf u}\) \(\newcommand{\vvec}{\mathbf v}\) \(\newcommand{\wvec}{\mathbf w}\) \(\newcommand{\xvec}{\mathbf x}\) \(\newcommand{\yvec}{\mathbf y}\) \(\newcommand{\zvec}{\mathbf z}\) \(\newcommand{\rvec}{\mathbf r}\) \(\newcommand{\mvec}{\mathbf m}\) \(\newcommand{\zerovec}{\mathbf 0}\) \(\newcommand{\onevec}{\mathbf 1}\) \(\newcommand{\real}{\mathbb R}\) \(\newcommand{\twovec}[2]{\left[\begin{array}{r}#1 \\ #2 \end{array}\right]}\) \(\newcommand{\ctwovec}[2]{\left[\begin{array}{c}#1 \\ #2 \end{array}\right]}\) \(\newcommand{\threevec}[3]{\left[\begin{array}{r}#1 \\ #2 \\ #3 \end{array}\right]}\) \(\newcommand{\cthreevec}[3]{\left[\begin{array}{c}#1 \\ #2 \\ #3 \end{array}\right]}\) \(\newcommand{\fourvec}[4]{\left[\begin{array}{r}#1 \\ #2 \\ #3 \\ #4 \end{array}\right]}\) \(\newcommand{\cfourvec}[4]{\left[\begin{array}{c}#1 \\ #2 \\ #3 \\ #4 \end{array}\right]}\) \(\newcommand{\fivevec}[5]{\left[\begin{array}{r}#1 \\ #2 \\ #3 \\ #4 \\ #5 \\ \end{array}\right]}\) \(\newcommand{\cfivevec}[5]{\left[\begin{array}{c}#1 \\ #2 \\ #3 \\ #4 \\ #5 \\ \end{array}\right]}\) \(\newcommand{\mattwo}[4]{\left[\begin{array}{rr}#1 \amp #2 \\ #3 \amp #4 \\ \end{array}\right]}\) \(\newcommand{\laspan}[1]{\text{Span}\{#1\}}\) \(\newcommand{\bcal}{\cal B}\) \(\newcommand{\ccal}{\cal C}\) \(\newcommand{\scal}{\cal S}\) \(\newcommand{\wcal}{\cal W}\) \(\newcommand{\ecal}{\cal E}\) \(\newcommand{\coords}[2]{\left\{#1\right\}_{#2}}\) \(\newcommand{\gray}[1]{\color{gray}{#1}}\) \(\newcommand{\lgray}[1]{\color{lightgray}{#1}}\) \(\newcommand{\rank}{\operatorname{rank}}\) \(\newcommand{\row}{\text{Row}}\) \(\newcommand{\col}{\text{Col}}\) \(\renewcommand{\row}{\text{Row}}\) \(\newcommand{\nul}{\text{Nul}}\) \(\newcommand{\var}{\text{Var}}\) \(\newcommand{\corr}{\text{corr}}\) \(\newcommand{\len}[1]{\left|#1\right|}\) \(\newcommand{\bbar}{\overline{\bvec}}\) \(\newcommand{\bhat}{\widehat{\bvec}}\) \(\newcommand{\bperp}{\bvec^\perp}\) \(\newcommand{\xhat}{\widehat{\xvec}}\) \(\newcommand{\vhat}{\widehat{\vvec}}\) \(\newcommand{\uhat}{\widehat{\uvec}}\) \(\newcommand{\what}{\widehat{\wvec}}\) \(\newcommand{\Sighat}{\widehat{\Sigma}}\) \(\newcommand{\lt}{<}\) \(\newcommand{\gt}{>}\) \(\newcommand{\amp}{&}\) \(\definecolor{fillinmathshade}{gray}{0.9}\)The field of epidemiology studies the geographical distribution and timing of infectious disease occurrences and how they are transmitted and maintained in nature, with the goal of recognizing and controlling outbreaks. The science of epidemiology includes etiology (the study of the causes of disease) and investigation of disease transmission (mechanisms by which a disease is spread). Epidemiologists are thus scientists who study the causes and patterns of human disease, which involves examining statistics to identify health threats and recommending strategies to reduce these threats.
The work of epidemiologist Alice Wang is highlighted in the video below. While many of the examples on this page focus on infectious disease (which result from biological hazards), epidemiologists can study noncommunicable diseases too (such as poisoning or obesity). The text at the end of the video says, "Are You CDC? For more information bout employment opportunities with CDC, please visit: jobs.cdc.gov".
History of Epidemiology
The studies of 19th century physicians and researchers such as John Snow, Florence Nightingale, Ignaz Semmelweis, Joseph Lister, Robert Koch, Louis Pasteur, and others sowed the seeds of modern epidemiology.
John Snow (figure \(\PageIndex{a}\)) was a British physician known as the father of epidemiology for determining the source of the 1854 Broad Street cholera epidemic in London. Based on observations he had made during an earlier cholera outbreak (1848–1849), Snow proposed that cholera was spread through a fecal-oral route of transmission and that a microbe was the infectious agent. He investigated the 1854 cholera epidemic in two ways. First, suspecting that contaminated water was the source of the epidemic, Snow identified the source of water for those infected. He found a high frequency of cholera cases among individuals who obtained their water from the River Thames downstream from London. This water contained the refuse and sewage from London and settlements upstream. He also noted that brewery workers did not contract cholera and on investigation found the owners provided the workers with beer to drink and stated that they likely did not drink water. Second, he also painstakingly mapped the incidence of cholera and found a high frequency among those individuals using a particular water pump located on Broad Street. In response to Snow’s advice, local officials removed the pump’s handle, resulting in the containment of the Broad Street cholera epidemic. John Snow’s own account of his work has additional links and information.
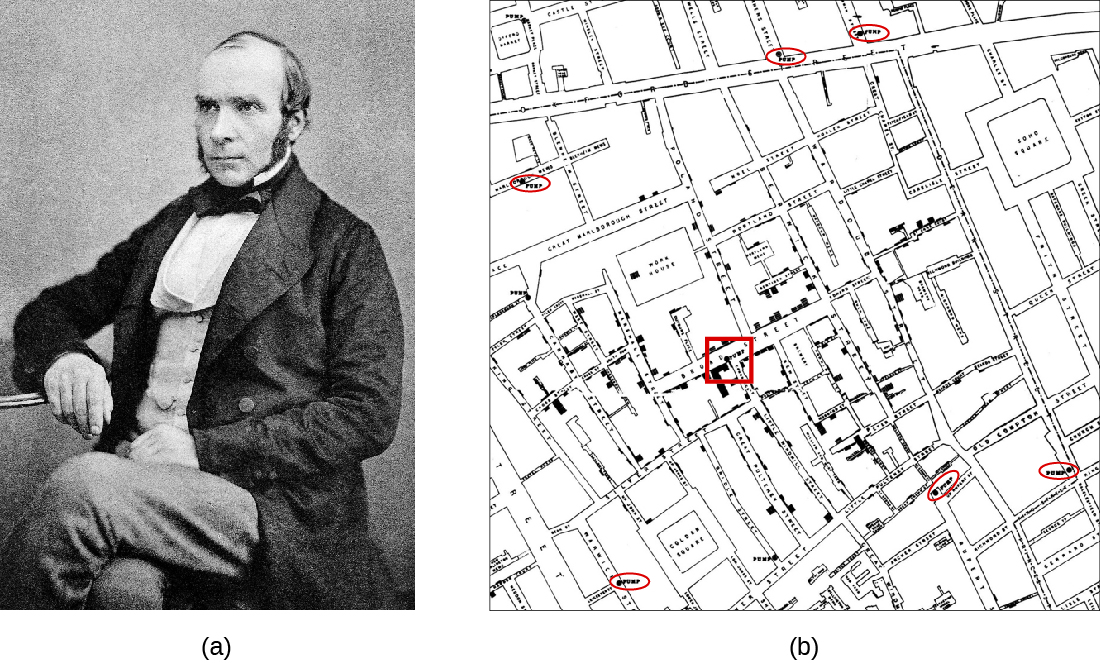
Snow’s work represents an early epidemiological study and it resulted in the first known public health response to an epidemic. Snow’s meticulous case-tracking methods are now common practice in studying disease outbreaks and in associating new diseases with their causes. His work further shed light on unsanitary sewage practices and the effects of waste dumping in the Thames. Additionally, his work supported the germ theory of disease, which argued disease could be transmitted through contaminated items, including water contaminated with fecal matter.
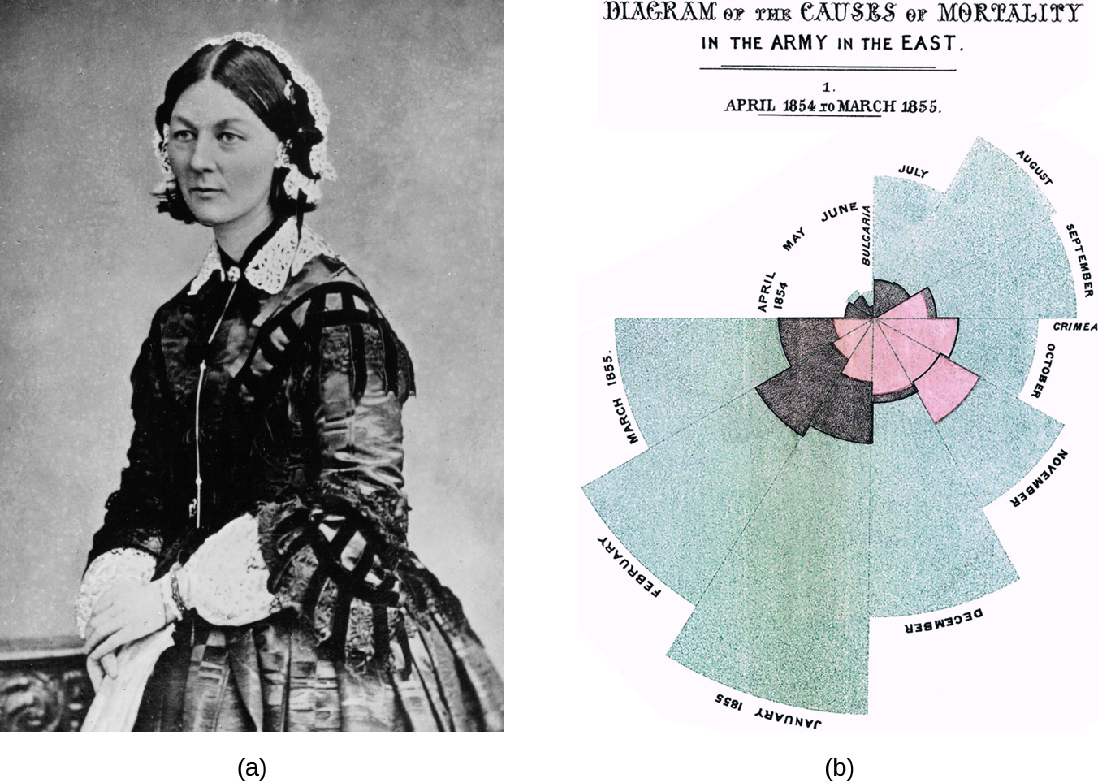
Florence Nightingale’s work is another example of an early epidemiological study. In 1854, Nightingale was part of a contingent of nurses dispatched by the British military to care for wounded soldiers during the Crimean War. Nightingale kept meticulous records regarding the causes of illness and death during the war. Her recordkeeping was a fundamental task of what would later become the science of epidemiology. Her analysis of the data she collected was published in 1858. In this book, she presented monthly frequency data on causes of death in a wedge chart histogram (figure \(\PageIndex{b}\)). This graphical presentation of data, unusual at the time, powerfully illustrated that the vast majority of casualties during the war occurred not due to wounds sustained in action but to what Nightingale deemed preventable infectious diseases. Often these diseases occurred because of poor sanitation and lack of access to hospital facilities. Nightingale’s findings led to many reforms in the British military’s system of medical care. Learn more about Nightingale’s wedge chart here.
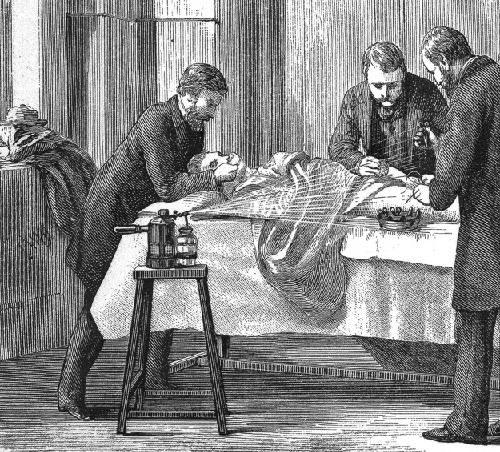
Joseph Lister provided early epidemiological evidence leading to good public health practices in clinics and hospitals. Most physicians did not wash their hands between patient visits or clean and sterilize their surgical tools. Lister, however, discovered the disinfecting properties of carbolic acid, also known as phenol. He introduced several disinfection protocols that dramatically lowered post-surgical infection rates. He demanded that surgeons who worked for him use a 5% carbolic acid solution to clean their surgical tools between patients, and even went so far as to spray the solution onto bandages and over the surgical site during operations (figure \(\PageIndex{c}\)). He also took precautions not to introduce sources of infection from his skin or clothing by removing his coat, rolling up his sleeves, and washing his hands in a dilute solution of carbolic acid before and during the surgery.
Analyzing Disease in a Population
Epidemiological analyses are always carried out with reference to a population, which is the group of individuals that are at risk for the disease or condition. The population can be defined geographically, but if only a portion of the individuals in that area are susceptible, additional criteria may be required. Susceptible individuals may be defined by particular behaviors, such as intravenous drug use, owning particular pets, or membership in an institution, such as a college. Being able to define the population is important because most measures of interest in epidemiology are made with reference to the size of the population.
The state of being diseased is called morbidity. Morbidity in a population can be expressed in a few different ways. Morbidity, or total morbidity, is expressed in numbers of individuals without reference to the size of the population. The morbidity rate can be expressed as the number of diseased individuals out of a standard number of individuals in the population, such as 100,000, or as a percent of the population.
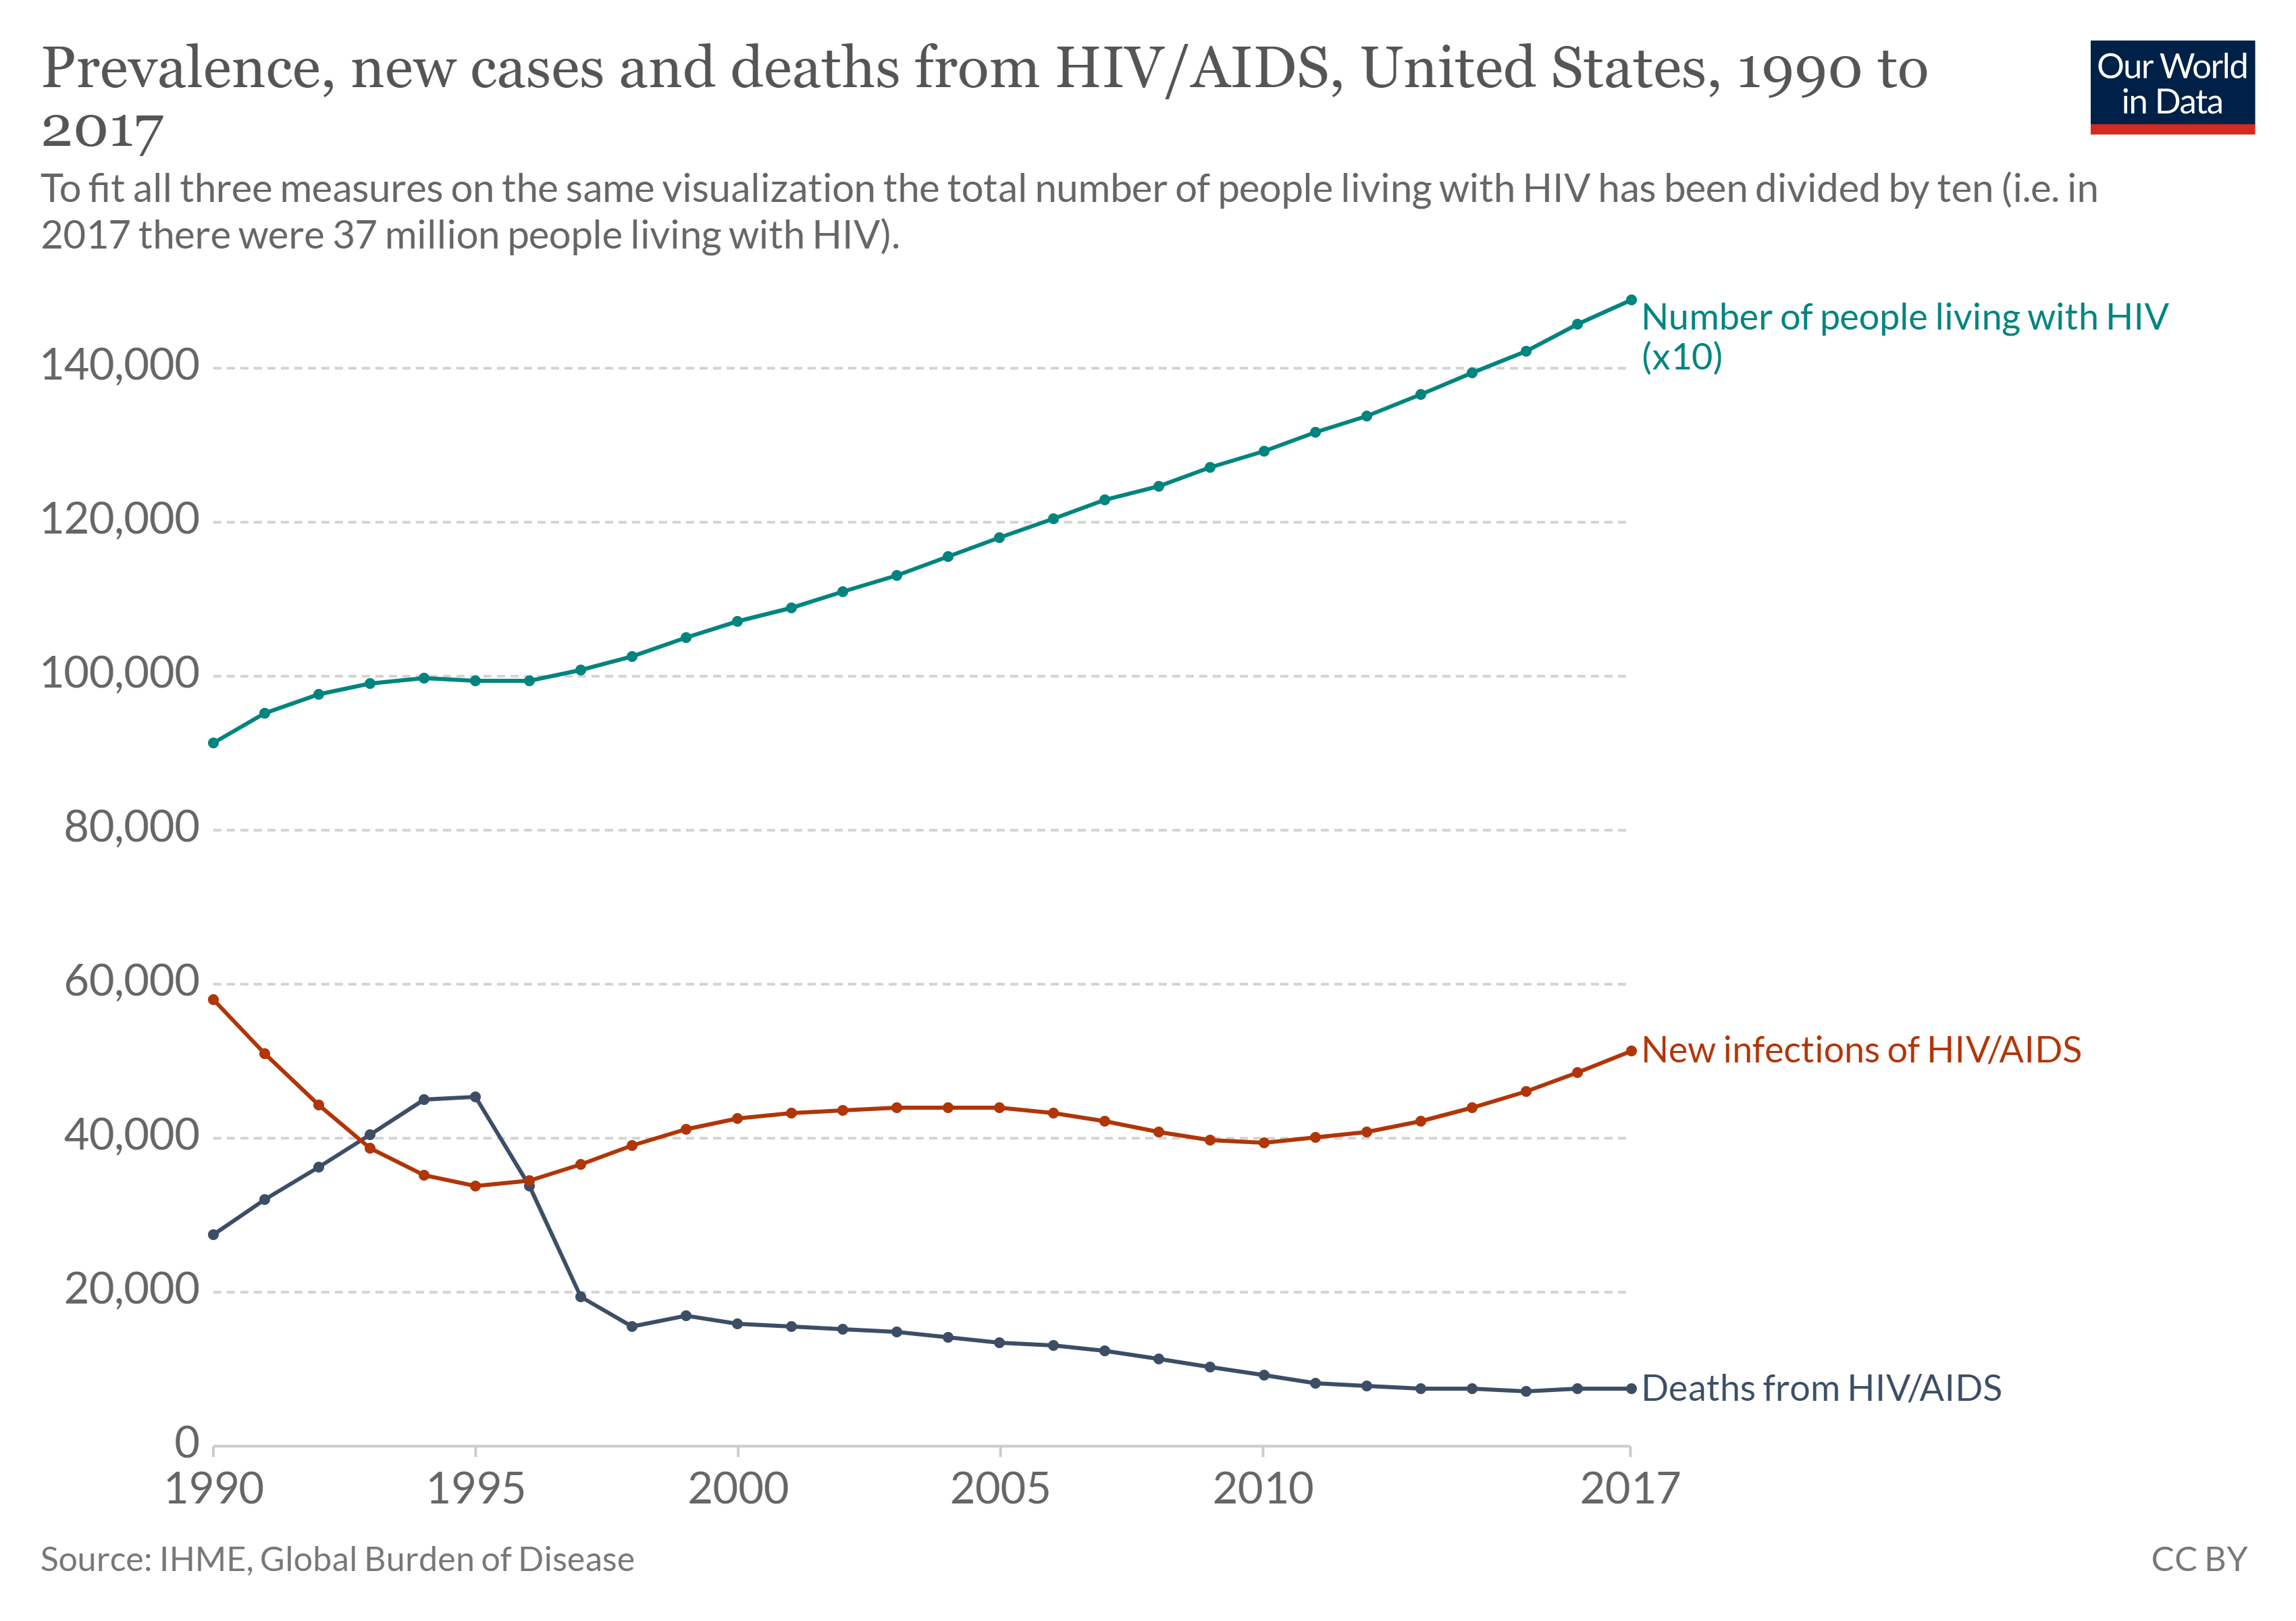
There are two aspects of morbidity that are relevant to an epidemiologist: a disease’s prevalence and its incidence. Prevalence is the number, or proportion, of individuals with a particular illness in a given population at a point in time. For example, the Centers for Disease Control and Prevention (CDC) estimated that about 1.2 million people in the United States lived with an active human immunodeficiency virus (HIV) infection in 2018. Expressed as a proportion, or rate, this is a prevalence of 367 infected persons per 100,000 in the population. On the other hand, incidence is the number or proportion of new cases in a period of time. For the same year, the CDC estimates that there were 36,400 newly diagnosed cases of HIV infection, which is an incidence of 11.1 new cases per 100,000 in the population. The relationship between incidence and prevalence can be seen in figure \(\PageIndex{d}\). For a chronic disease like HIV infection, prevalence will generally be higher than incidence because it represents the cumulative number of new cases over many years minus the number of cases that are no longer active (because the patient died or was cured).
In addition to morbidity rates, the incidence and prevalence of mortality (death) may also be reported. A mortality rate can be expressed as the percentage of the population that has died from a disease or as the number of deaths per 100,000 persons (or other suitable standard number).
Patterns of Incidence
Diseases that are seen only occasionally, and usually without geographic concentration, are called sporadic diseases. Examples of sporadic diseases include tetanus, rabies, and plague. In the United States, Clostridium tetani, the bacterium that causes tetanus, is ubiquitous in the soil environment, but incidences of infection occur only rarely and in scattered locations because most individuals are vaccinated, clean wounds appropriately, or are only rarely in a situation that would cause infection. Likewise in the United States there are a few scattered cases of plague each year, usually contracted from rodents in rural areas in the western states.
Diseases that are constantly present (often at a low level) in a population within a particular geographic region are called endemic diseases. For example, malaria is endemic to some regions of Brazil, but is not endemic to the United States.
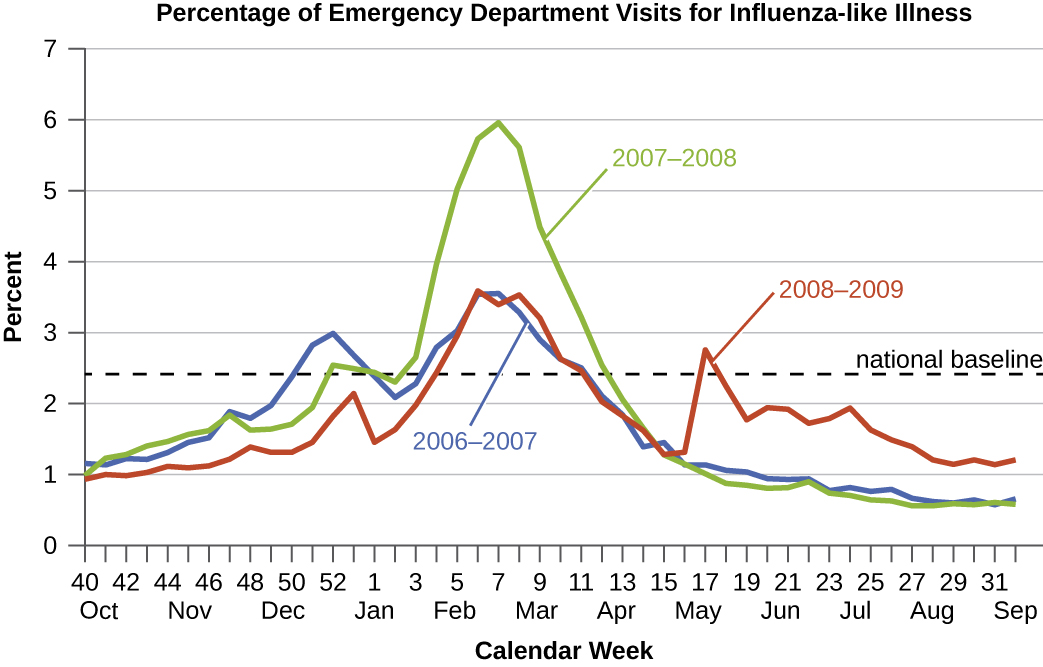
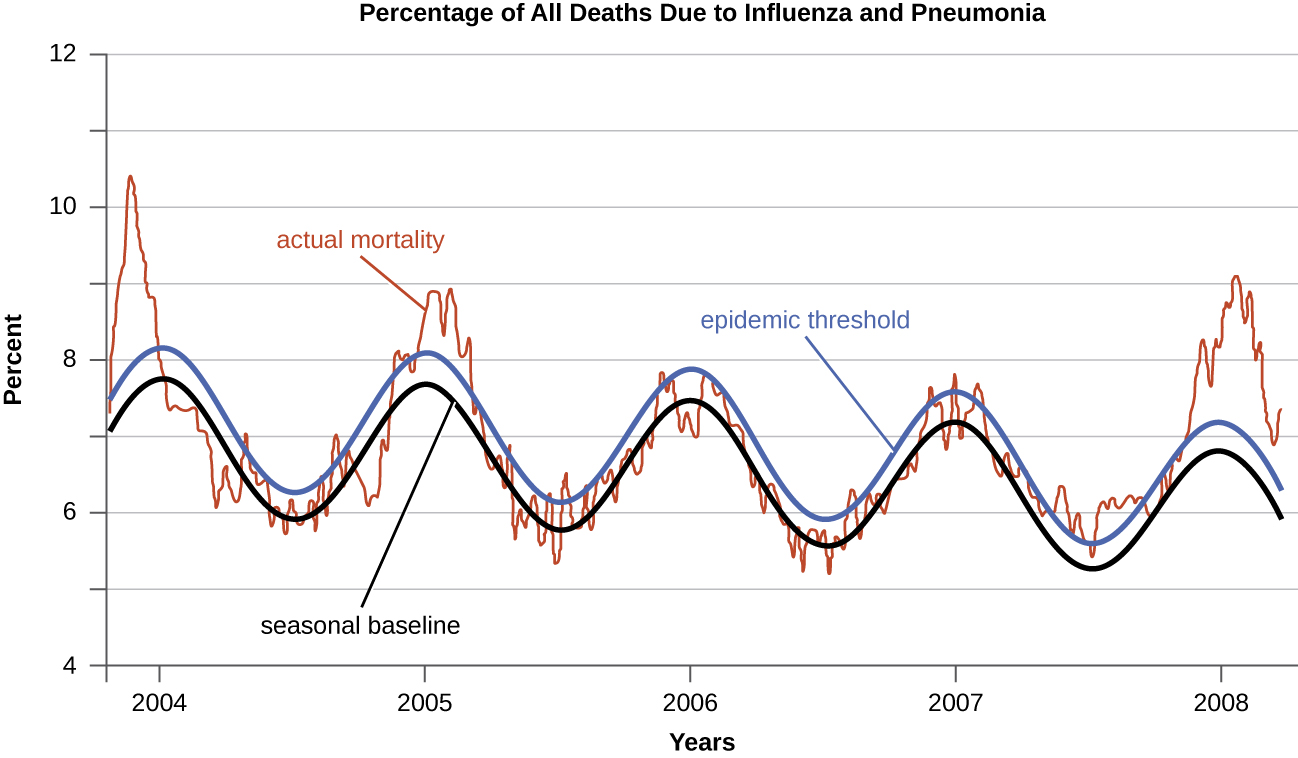
Diseases for which a larger than expected number of cases occurs in a short time within a geographic region are called epidemic diseases. Influenza is a good example of a commonly epidemic disease. Incidence patterns of influenza tend to rise each winter in the northern hemisphere. These seasonal increases are expected, so it would not be accurate to say that influenza is epidemic every winter; however, some winters have an usually large number of seasonal influenza cases in particular regions, and such situations would qualify as epidemics (figures \(\PageIndex{e-f}\)).
An epidemic that occurs on a worldwide scale is called a pandemic disease. For example, HIV/AIDS (acquired immunodeficiency syndrome) and coronavirus disease 19 (COVID-19) are pandemic diseases, and novel influenza virus strains often become pandemic.
Etiology
When studying an epidemic, an epidemiologist’s first task is to determinate the cause of the disease, called the etiologic agent or causative agent. Connecting a disease to a specific pathogen can be challenging because of the extra effort typically required to demonstrate direct causation as opposed to a simple association. It is not enough to observe an association between a disease and a suspected pathogen; controlled experiments are needed to eliminate other possible causes. In addition, pathogens are typically difficult to detect when there is no immediate clue as to what is causing the outbreak. Signs and symptoms of disease are also commonly nonspecific, meaning that many different agents can give rise to the same set of signs and symptoms. This complicates diagnosis even when a causative agent is familiar to scientists.
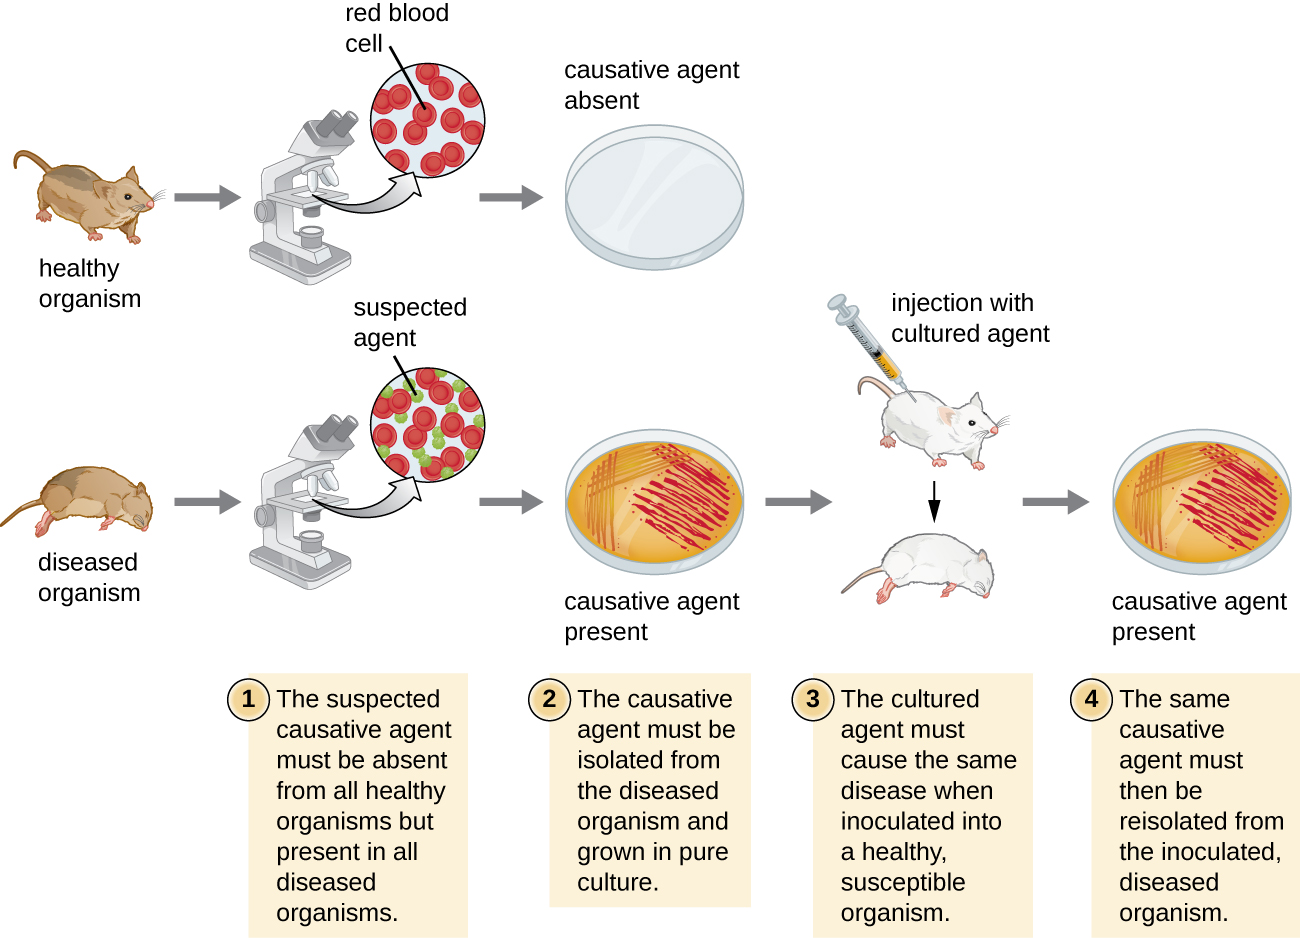
Robert Koch was the first scientist to specifically demonstrate the causative agent of a disease (anthrax) in the late 1800s. Koch developed four criteria, now known as Koch’s postulates, which had to be met in order to positively link a disease with a pathogenic microbe (figure \(\PageIndex{g}\)). Between 1876 and 1905, many common diseases were linked with their etiologic agents, including cholera, diphtheria, gonorrhea, meningitis, plague, syphilis, tetanus, and tuberculosis. Today, we use the molecular Koch’s postulates, a variation of Koch’s original postulates. (You can read more about both here.)
How Diseases Spread
Understanding how infectious pathogens spread is critical to preventing infectious disease. For pathogens to persist over long periods of time they require reservoirs where they normally reside. Reservoirs can be living organisms (rats, bats, racoons, livestock, etc.) or nonliving sites. Nonliving reservoirs can include soil and water in the environment. These may naturally harbor the organism because it may grow in that environment. These environments may also become contaminated with pathogens in human feces, pathogens shed by intermediate hosts, or pathogens contained in the remains of intermediate hosts.
An individual capable of transmitting a pathogen without displaying symptoms is referred to as a carrier. A passive carrier is contaminated with the pathogen and can mechanically transmit it to another host; however, a passive carrier is not infected. By contrast, an active carrier is an infected individual who can transmit the disease to others. An active carrier may or may not exhibit signs or symptoms of infection.
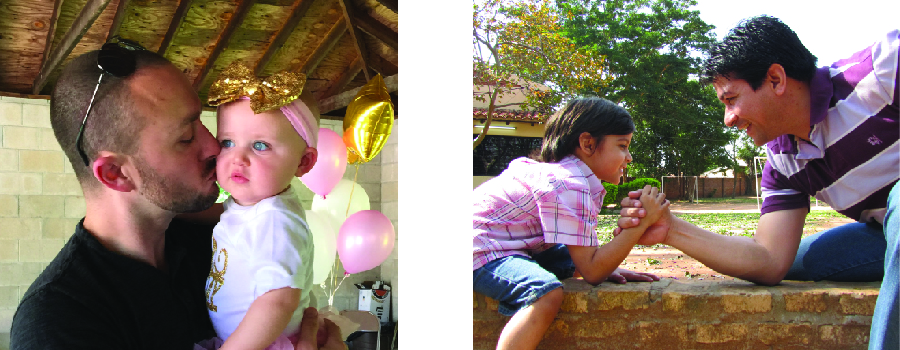
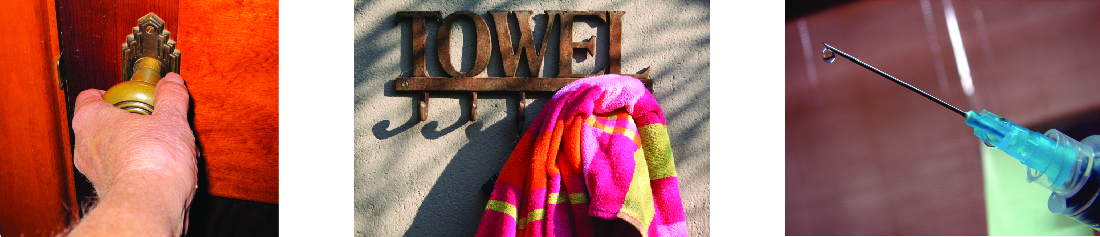
Regardless of the reservoir, transmission must occur for an infection to spread. Contact transmission includes direct contact or indirect contact. Person-to-person transmission is a form of direct contact transmission. Here the agent is transmitted by physical contact between two individuals (figure \(\PageIndex{h}\)) through actions such as touching, kissing, sexual intercourse, or droplet sprays. Indirect contact transmission involves inanimate objects called fomites that become contaminated by pathogens from an infected individual or reservoir (figure \(\PageIndex{i}\)). For example, an individual with the common cold may sneeze, causing droplets to land on a fomite such as a tablecloth or carpet, or the individual may wipe her nose and then transfer mucus to a fomite such as a doorknob or towel.
Vehicle transmission refers to the transmission of pathogens through vehicles such as water, food, and air. Water contamination through poor sanitation methods leads to waterborne transmission of disease. Waterborne disease remains a serious problem in many regions throughout the world. The World Health Organization (WHO) estimates that contaminated drinking water is responsible for more than 500,000 deaths each year. Similarly, food contaminated through poor handling or storage can lead to foodborne transmission of disease. Dust and fine particles known as aerosols, which can float in the air, can carry pathogens and facilitate the airborne transmission of disease.
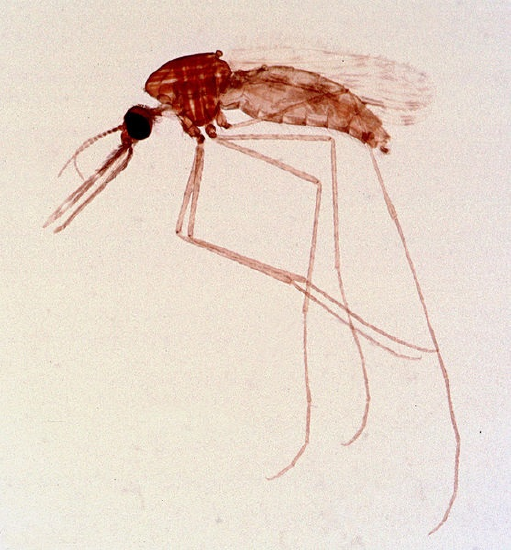
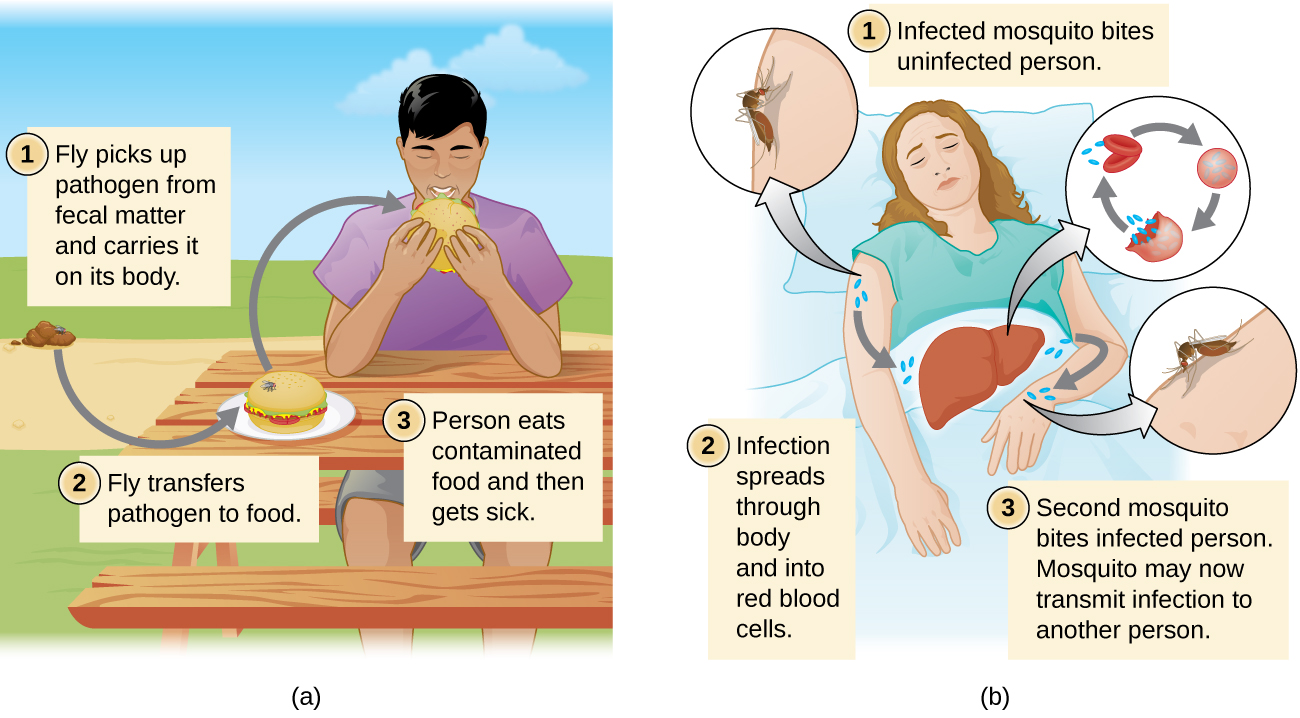
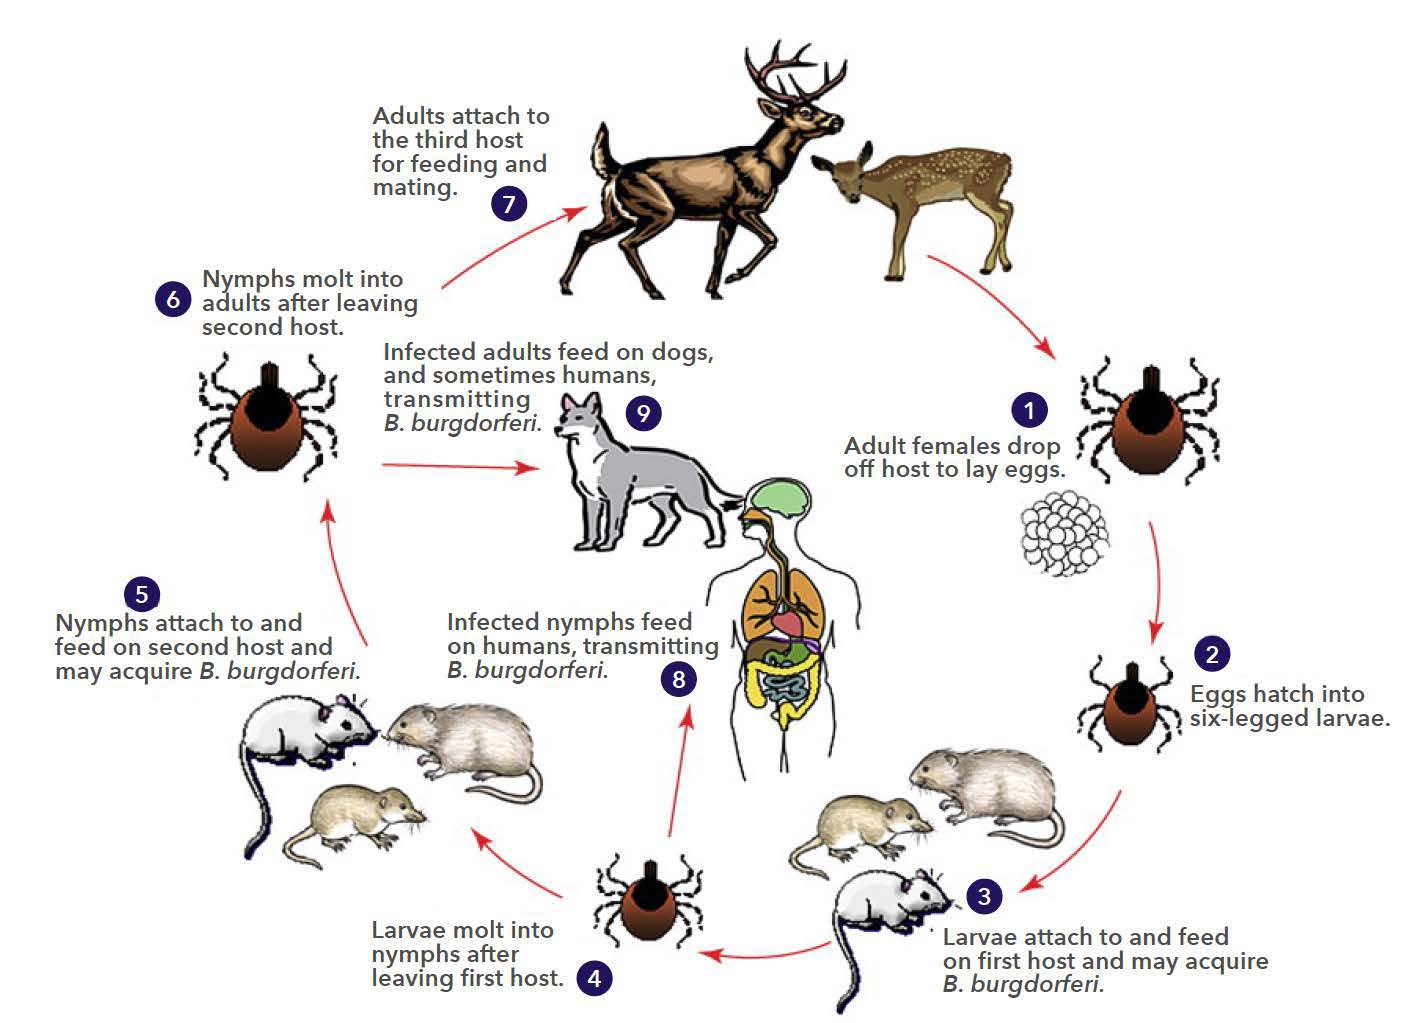
Diseases can also be transmitted by a mechanical or biological vector, an animal (typically an arthropod) that carries the disease from one host to another. Ticks, fleas, and mosquitos are examples of vectors (figure \(\PageIndex{j}\)). Mechanical transmission is facilitated by a mechanical vector, an animal that carries a pathogen from one host to another without being infected itself. Biological transmission occurs when the pathogen reproduces within a biological vector that transmits the pathogen from one host to another (figure \(\PageIndex{k}\)).
Ecosystem degradation can increase disease spread through several mechanisms. First, it can promote vector populations. For example, deforestation, dams, and urbanization increase the amount of standing water, increasing habitat for vectors, such as mosquitoes. Additionally, climate change may expand the range of disease vectors that are limited to tropical or subtropical regions. Second, disruptions in the water cycle can create conditions that favor pathogens. For example, fertilizer runoff from agriculture increases nutrient levels, making bodies of water more suitable for the bacterium that causes cholera. Increased flooding as a result of changes in land use and climate change also facilitates the spread of waterborne disease.
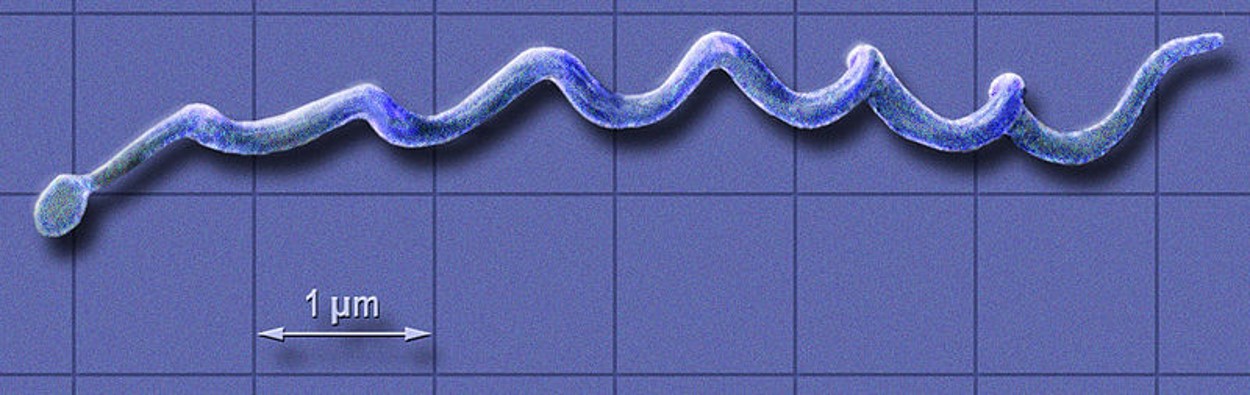
A third way that ecosystem degradation can increase disease spread is through decreasing biodiversity. For example, Lyme disease is caused by the bacterium Borrelia and is transmitted to humans from small mammals (the reservoirs) by ticks (figures \(\PageIndex{l-m}\)). Some reservoirs (squirrels and opossums) remove ticks, reducing infection, but field mice do not. Habitat fragmentation has increased field mice relative to squirrels and opossums and thus increased the reservoir for Lyme disease.
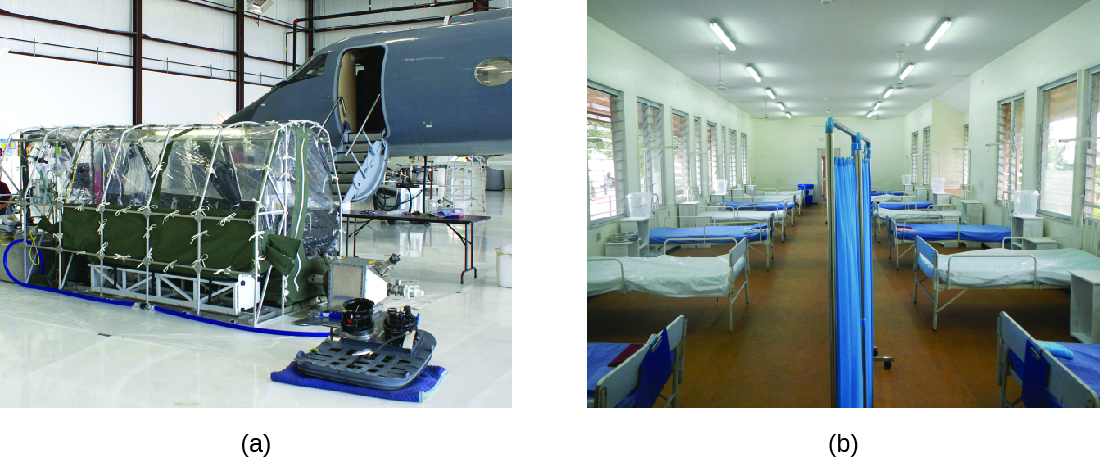
Individuals suspected or known to have been exposed to certain contagious pathogens may be quarantined, or isolated to prevent transmission of the disease to others. Hospitals and other health-care facilities generally set up special wards to isolate patients with particularly hazardous diseases such as tuberculosis or COVID-19 (figure \(\PageIndex{n}\)). Depending on the setting, these wards may be equipped with special air-handling methods, and personnel may implement special protocols to limit the risk of transmission, such as personal protective equipment or the use of chemical disinfectant sprays upon entry and exit of medical personnel.
Attribution
Modified by Melissa Ha from Disease and Epidemiology from Microbiology by OpenStax (licensed under CC-BY). Access for free at openstax.org.