
22.4: Mapping Genome-Nuclear Lamina Interactions (LADs)
- Page ID
- 41053

In this section, we will present how the DamID and Hi-C methods were used to map lamina-associated domains in the genome.
Interpreting DamID Data
The DamID method (described in section 3) was used to identify regions of DNA that interacted with the lamin protein at the nuclear lamina.
Did You Know?
DamID experiments typically run for 24 hours and the methylation is irreversible. The results are also the average over millions of cells. Therefore, DamID is not suitable for exact time related positioning of the genome, though single cell studies may soon make address this issue!
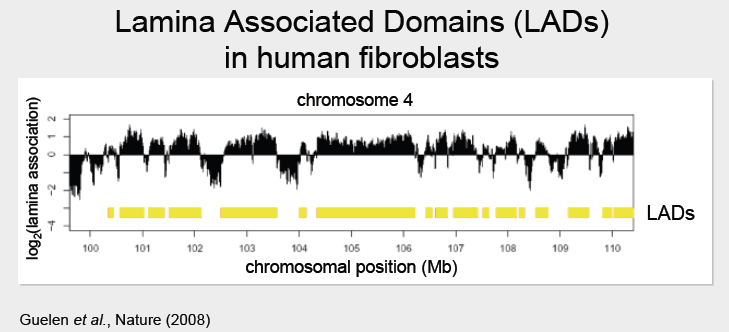
The results of the DamID experiment were plotted as \(\log _{2} \frac{\text {Dam fusionprotein}}{\text {Dam only}}\) protein, as done in the figure below (black peaks). For the LaminB1 fusion experiment, positive regions (underlined in yellow in the figure below) indicate regions which preferentially associate with the nuclear lamina. These positive regions are de- fined as Lamina Associated Domains, or LADs. Approximately 1300 LADs were discovered in human
source unknown. All right reserved. This content is excluded from our Creative
Commons license. For more information, see http://ocw.mit.edu/help/faq-fair-use/.
fibroblasts. They were surprisingly large, ranging from about 0.1Mb - 10Mb, with a median size of 5Mb.
Did You Know?
DamID experiments typically run for 24 hours and the methylation is irreversible. The results are also the average over millions of cells. Therefore, DamID is not suitable for exact time related positioning of the genome, though single cell studies may soon make address this issue!
FAQ
Q: In this representation is a value of 0 significant?
A: No, there is definitely a point where we do not know where the real 0 is. Instead, we can try to make a good estimate of where the 0 value should be, in order to see relative preference (the interior vs exterior of the nucleus)
After LADs have been identified, we can align their boundaries to discover various interesting features such as known gene densities or gene expression levels to the data to build our LAD model. Experiments have shown that LADs are characterized by low gene density and gene expression levels. It was noticed that the LAD boundaries are very sharply defined. By aligning the start positions of many LADs, it was discovered that the borders are particularly marked by CpG islands, outward pointing promoters, and CTCF binding sites.
FAQ
Q: Why CTCF binding sites? What’s so important about them?
A: That’s the question! Perhaps they help maintain LADs. They could perhaps prevent the LADs from ’spreading’.
FAQ
Q: How does organization relate to polyclonal expression?
A: Certainly something going on; however, polyclonal repression works on a smaller scale than LAD. It occurs outside of LADs, as an additional repression mechanism
Interpreting Hi-C Data
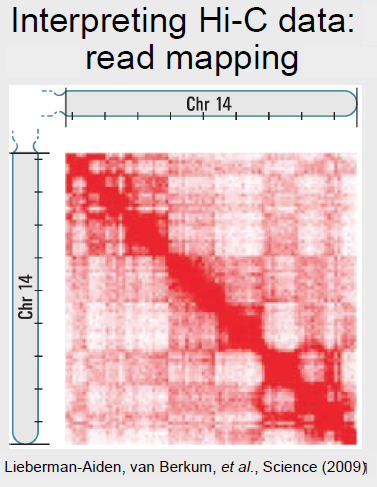
Hi-C data was collected, and the read were mapped back to the genome. The read counts were compiled into a matrix O (shown below for chromosome 14) where the element Oi,j indicates the number of reads corresponding to an interaction between positions i and j. A strong diagonal is clearly present, and indicates that regions that are close together in 1D are also likely to interact in 3D. Errors in Hi-C data interpretation may occur when the assumptions of the technique are violated: for example, the assumption that the reference genome is correct, which may not be true in the case of a cancerous cell. The matrix was then
American Association for the Advancement of Science. All rights reserved. This content is excluded from our Creative
Commons license. For more information, see http://ocw.mit.edu/help/faq-fair-use/.
Source: Lieberman-Aiden, Erez, et al. "Comprehensive Mapping of Long-range Interactions Reveals Folding Principles of
the Human Genome." Science 326, no. 5950 (2009): 289-93.
normalized to account genetic distance between two regions, and a matrix indicating which interactions are enriched or depleted in the data. In order to compare the data in the matrix, which is two dimensional, to genomic data sets, which are one dimensional, Principal Component Analysis (PCA) must be used. After PCA, functional characterization of the data is possible. Hi-C identified two global types of regions:
• Type A, which is characterized by open chromatin, gene richness, and active chromatin marks.
• Type B, which is characterized by closed chromatin, and is gene poor.
Both types of regions are primarily self-interacting and interactions between the two types are infrequent. Hi-C also confirmed the presence of chromosome territories, as there were far more intra-chromosomal rather than inter-chromosomal interactions.