
4.2: Conservation of genomic sequences
- Page ID
- 40928
\( \newcommand{\vecs}[1]{\overset { \scriptstyle \rightharpoonup} {\mathbf{#1}} } \)
\( \newcommand{\vecd}[1]{\overset{-\!-\!\rightharpoonup}{\vphantom{a}\smash {#1}}} \)
\( \newcommand{\dsum}{\displaystyle\sum\limits} \)
\( \newcommand{\dint}{\displaystyle\int\limits} \)
\( \newcommand{\dlim}{\displaystyle\lim\limits} \)
\( \newcommand{\id}{\mathrm{id}}\) \( \newcommand{\Span}{\mathrm{span}}\)
( \newcommand{\kernel}{\mathrm{null}\,}\) \( \newcommand{\range}{\mathrm{range}\,}\)
\( \newcommand{\RealPart}{\mathrm{Re}}\) \( \newcommand{\ImaginaryPart}{\mathrm{Im}}\)
\( \newcommand{\Argument}{\mathrm{Arg}}\) \( \newcommand{\norm}[1]{\| #1 \|}\)
\( \newcommand{\inner}[2]{\langle #1, #2 \rangle}\)
\( \newcommand{\Span}{\mathrm{span}}\)
\( \newcommand{\id}{\mathrm{id}}\)
\( \newcommand{\Span}{\mathrm{span}}\)
\( \newcommand{\kernel}{\mathrm{null}\,}\)
\( \newcommand{\range}{\mathrm{range}\,}\)
\( \newcommand{\RealPart}{\mathrm{Re}}\)
\( \newcommand{\ImaginaryPart}{\mathrm{Im}}\)
\( \newcommand{\Argument}{\mathrm{Arg}}\)
\( \newcommand{\norm}[1]{\| #1 \|}\)
\( \newcommand{\inner}[2]{\langle #1, #2 \rangle}\)
\( \newcommand{\Span}{\mathrm{span}}\) \( \newcommand{\AA}{\unicode[.8,0]{x212B}}\)
\( \newcommand{\vectorA}[1]{\vec{#1}} % arrow\)
\( \newcommand{\vectorAt}[1]{\vec{\text{#1}}} % arrow\)
\( \newcommand{\vectorB}[1]{\overset { \scriptstyle \rightharpoonup} {\mathbf{#1}} } \)
\( \newcommand{\vectorC}[1]{\textbf{#1}} \)
\( \newcommand{\vectorD}[1]{\overrightarrow{#1}} \)
\( \newcommand{\vectorDt}[1]{\overrightarrow{\text{#1}}} \)
\( \newcommand{\vectE}[1]{\overset{-\!-\!\rightharpoonup}{\vphantom{a}\smash{\mathbf {#1}}}} \)
\( \newcommand{\vecs}[1]{\overset { \scriptstyle \rightharpoonup} {\mathbf{#1}} } \)
\(\newcommand{\longvect}{\overrightarrow}\)
\( \newcommand{\vecd}[1]{\overset{-\!-\!\rightharpoonup}{\vphantom{a}\smash {#1}}} \)
\(\newcommand{\avec}{\mathbf a}\) \(\newcommand{\bvec}{\mathbf b}\) \(\newcommand{\cvec}{\mathbf c}\) \(\newcommand{\dvec}{\mathbf d}\) \(\newcommand{\dtil}{\widetilde{\mathbf d}}\) \(\newcommand{\evec}{\mathbf e}\) \(\newcommand{\fvec}{\mathbf f}\) \(\newcommand{\nvec}{\mathbf n}\) \(\newcommand{\pvec}{\mathbf p}\) \(\newcommand{\qvec}{\mathbf q}\) \(\newcommand{\svec}{\mathbf s}\) \(\newcommand{\tvec}{\mathbf t}\) \(\newcommand{\uvec}{\mathbf u}\) \(\newcommand{\vvec}{\mathbf v}\) \(\newcommand{\wvec}{\mathbf w}\) \(\newcommand{\xvec}{\mathbf x}\) \(\newcommand{\yvec}{\mathbf y}\) \(\newcommand{\zvec}{\mathbf z}\) \(\newcommand{\rvec}{\mathbf r}\) \(\newcommand{\mvec}{\mathbf m}\) \(\newcommand{\zerovec}{\mathbf 0}\) \(\newcommand{\onevec}{\mathbf 1}\) \(\newcommand{\real}{\mathbb R}\) \(\newcommand{\twovec}[2]{\left[\begin{array}{r}#1 \\ #2 \end{array}\right]}\) \(\newcommand{\ctwovec}[2]{\left[\begin{array}{c}#1 \\ #2 \end{array}\right]}\) \(\newcommand{\threevec}[3]{\left[\begin{array}{r}#1 \\ #2 \\ #3 \end{array}\right]}\) \(\newcommand{\cthreevec}[3]{\left[\begin{array}{c}#1 \\ #2 \\ #3 \end{array}\right]}\) \(\newcommand{\fourvec}[4]{\left[\begin{array}{r}#1 \\ #2 \\ #3 \\ #4 \end{array}\right]}\) \(\newcommand{\cfourvec}[4]{\left[\begin{array}{c}#1 \\ #2 \\ #3 \\ #4 \end{array}\right]}\) \(\newcommand{\fivevec}[5]{\left[\begin{array}{r}#1 \\ #2 \\ #3 \\ #4 \\ #5 \\ \end{array}\right]}\) \(\newcommand{\cfivevec}[5]{\left[\begin{array}{c}#1 \\ #2 \\ #3 \\ #4 \\ #5 \\ \end{array}\right]}\) \(\newcommand{\mattwo}[4]{\left[\begin{array}{rr}#1 \amp #2 \\ #3 \amp #4 \\ \end{array}\right]}\) \(\newcommand{\laspan}[1]{\text{Span}\{#1\}}\) \(\newcommand{\bcal}{\cal B}\) \(\newcommand{\ccal}{\cal C}\) \(\newcommand{\scal}{\cal S}\) \(\newcommand{\wcal}{\cal W}\) \(\newcommand{\ecal}{\cal E}\) \(\newcommand{\coords}[2]{\left\{#1\right\}_{#2}}\) \(\newcommand{\gray}[1]{\color{gray}{#1}}\) \(\newcommand{\lgray}[1]{\color{lightgray}{#1}}\) \(\newcommand{\rank}{\operatorname{rank}}\) \(\newcommand{\row}{\text{Row}}\) \(\newcommand{\col}{\text{Col}}\) \(\renewcommand{\row}{\text{Row}}\) \(\newcommand{\nul}{\text{Nul}}\) \(\newcommand{\var}{\text{Var}}\) \(\newcommand{\corr}{\text{corr}}\) \(\newcommand{\len}[1]{\left|#1\right|}\) \(\newcommand{\bbar}{\overline{\bvec}}\) \(\newcommand{\bhat}{\widehat{\bvec}}\) \(\newcommand{\bperp}{\bvec^\perp}\) \(\newcommand{\xhat}{\widehat{\xvec}}\) \(\newcommand{\vhat}{\widehat{\vvec}}\) \(\newcommand{\uhat}{\widehat{\uvec}}\) \(\newcommand{\what}{\widehat{\wvec}}\) \(\newcommand{\Sighat}{\widehat{\Sigma}}\) \(\newcommand{\lt}{<}\) \(\newcommand{\gt}{>}\) \(\newcommand{\amp}{&}\) \(\definecolor{fillinmathshade}{gray}{0.9}\)Functional elements in Drosophila
In a 2007 paper1, Stark et al. identified evolutionary signatures of different functional elements and predicted function using conserved signatures. One important finding is that across evolutionary time, genes tend to remain in a similar location. This is illustrated by Figure 4.2, which shows the result of a multiple alignment on orthologous segments of genomes from twelve Drosophila species. Each genome is represented by a horizontal blue line, where the top line represents the reference sequence. Grey lines connect orthologous functional elements, and it is clear that their positions are generally conserved across the different species.
FAQ
Q: Why is it significant that the position of orthologous elements is conserved?
A: The fact that positions are conserved is what allows us to make comparisons across species. Otherwise, we would not be able to align non-coding regions reliably.
Drosophila is a great species to study because, in fact, the separation of fruit flies is greater than that of mammals. This brings us to an interesting side-note, that of which species to select when looking at conservation signatures. You don’t want to have very similar species (such as humans and chimpanzees, which share 98% of the genome), because it would be difficult to distinguish regions that are different from ones that are the same. When comparing species to humans, the right level of conservation to look at is the mammals. Specifically, most research done in this field is done using 29 eutherian mammals (placental mammals, no marsupials or monotremes) to study. Another things to take into account is branch-length differences between two species. Your ideal subjects of study would be a few closely related (short branch- length) species, to avoid problems of interpretation that arise with a long branch-length mutations, such as back-mutations.
Rates and patterns of selection
Now that we have established that there is structure to the evolution of genomic sequences, we can begin analyzing specific features of the conservation. For this section, let us consider genomic data at the level of individual nucleotides. Later on in this chapter we will see that we can also analyze amino acid sequences.
We may estimate the intensity of a constraint of selection ω by making a probabilities model of the substitution rate inferred from genome alignment data. Using a Maximum Likelihood (ML) estimation of ω can provide us with the rate of selection ω as well as the log odds score that the rate is non-natural.

Figure 4.2: Comparative identification of functional elements in 12 Drosophila species. Grey lines indicate the alignment of orthologous regions. Color indicates direction of transcription.
One property that this measures that we may consider is the rate of nucleotide substitution in a genome. Figure 4.3 shows two nucleotide sequences from a collection of mammals. One of the sequences is subject to normal rates of change, while the other demonstrates a reduced rate. Hence we may hypothesize that the latter sequence is subject to a greater level of evolutionary constraint, and may represent a more biologically important section of the genome.
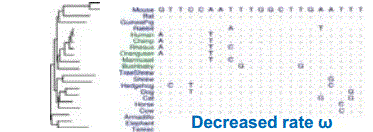
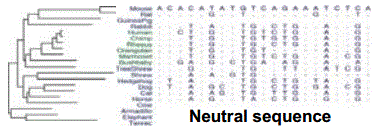
Figure 4.3: A comparison between two genomic regions with different selection rates ω. The sequence on the left demonstrates normal rates of mutation, while the sequence on the right shows a high conservation level, as evidenced by the reduced number of mutations.
We can further detect unusual patterns of selection π by looking at a probabilistic model of a stationary distribution that is different from the background distribution. The ML estimation of π provides us with the Probability Weight Matrix (PWM) for each k-mer in the genome as well as the log odds score for substitutions that are unusual (e.g. one base changing to one and only one other base). As one may see from Figure 4.4, specific letters matter because some bases selectively change to one (or two other bases), and the specific base it changes to may suggest what the function of the sequence may be.
We can increase our detection power of constraint elements by looking at more species, as shown in Figure 4.5 where we see a dramatic increase in the power to detect small constrained elements.
1 www.nature.com/nature/journal...ture06340.html