
5.2.8: Food Chains and Food Webs
- Page ID
- 37262

Learning Objectives
- Compare and contrast betrween a food chain and a food webs
- Describe energy transfer efficiency as it relates to trophic levels
Food Chains
A food chain is a linear sequence of organisms through which nutrients and energy pass as one organism eats another. Each organism in a food chain occupies a specific trophic level (energy level), its position in the food chain. The first trophic level in the food chain is the producers. The primary consumers (the herbivores the eat producers) are the second trophic level. Next are higher-level consumers. Higher-level consumers include secondary consumers (third trophic level), which are usually carnivores that eat the primary consumers, and tertiary consumers (fourth trophic level), which are carnivores that eat other carnivores. Higher-level consumers feed on the next lower tropic levels, and so on, up to the organisms at the top of the food chain: the apex consumers. In the Lake Ontario food chain shown in Figure \(\PageIndex{1}\), the Chinook salmon is the apex consumer at the top of this food chain.
One major factor that limits the number of steps in a food chain is energy. Much of the energy from one tropic level to the next is lost as heat, due to the second law of thermodynamics. Only about 10% of the energy transfers from one trophic level to the next trophic level. Thus, after several transfers, the amount of energy remaining in the food chain may not be great enough to support viable populations at yet a higher trophic level.
Food Webs
While food chains are simple and easy to analyze, there is a one problem when using food chains to describe most communities. Even when all organisms are grouped into appropriate trophic levels, some of these organisms can feed at more than one trophic level. In addition, species feed on and are eaten by more than one species. In other words, the linear model of trophic interactions, the food chain, is a hypothetical and overly simplistic representation of community structure. A holistic model—which includes all the interactions between different species and their complex interconnected relationships with each other and with the environment—is a more accurate and descriptive model. A food web is a concept that accounts for the multiple trophic interactions between each species (Figure \(\PageIndex{2}\)).
Community Productivity and Transfer Efficiency
The rate at which photosynthetic producers incorporate energy from the sun is called gross primary productivity. In a cattail marsh, plants only trap 2.2% of the energy from the sun that reaches them. Three percent of the energy is reflected, and another 94.8% is used to heat and evaporate water within and surrounding the plant. However, not all of the energy incorporated by producers is available to the other organisms in the food web because producers must also grow and reproduce, which consumes energy. At least half of the 2.2% trapped by cattail marsh plants is used to meet the plants own energy needs.
Net primary productivity is the energy that remains in the producers after accounting for the metabolic needs of the producers and heat loss. The net productivity is then available to the primary consumers at the next trophic level. One way to measure net primary productivity is to collect and weigh the plant material produced on a m2 (about 10.7 ft2) of land over a given interval. One gram of plant material (e.g., stems and leaves), which is largely carbohydrate, yields about 4.25 kcal of energy when burned. Net primary productivity can range from 500 kcal/m2/yr in the desert to 15,000 kcal/m2/yr in a tropical rain forest.
In an aquatic community in Silver Springs, Florida, the gross primary productivity (total energy accumulated by the primary producers) was 20,810 kcal/m2/yr (Figure \(\PageIndex{3}\)). The net primary productivity (energy available to consumers) was only 7,632 kcal/m2/yr after accounting for energy lost as heat and energy require to meet the producer's metabolic needs.
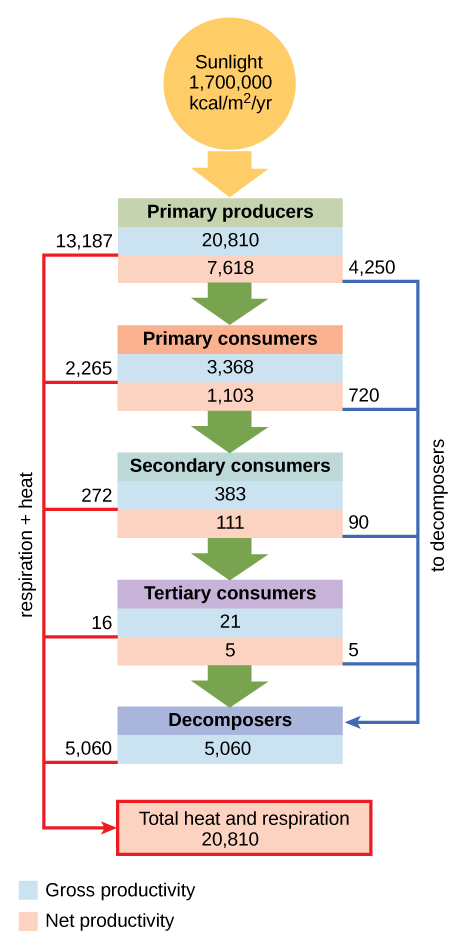
Only a fraction of the energy captured by one trophic level is assimilated into biomass, which makes it available to the next trophic level. Assimilation is the biomass of the present trophic level after accounting for the energy lost due to incomplete ingestion of food, energy used to conduct work by that trophic level, and energy lost as waste. Incomplete ingestion refers to the fact that some consumers eat only a part of their food. For example, when a lion kills an antelope, it will eat everything except the hide and bones. The lion is missing the energy-rich bone marrow inside the bone, so the lion does not make use of all the calories its prey could provide. In Silver Springs, only 1103 kcal/m2/yr from the 7618 kcal/m2/yr of energy available to primary consumers was assimilated into their biomass. (The trophic level transfer efficiency between the first two trophic levels was approximately 14.8 percent.)