

32.14: Climate Change, Infectious Disease and Pandemics
- Page ID
- 106590

Written by Henry Jakubowski
Introduction
Microorganisms can cause both chronic and acute diseases, both of which if left untreated can lead to death. Infections with the Human Papillomavirus (HPV) can cause cancer of the cervix, vagina, vulva, penis, anus, and throat. Modern vaccines against HPV can prevent over 90% of these cancers. The bacteria H. pylori can, in some people, cause stomach illness (such as severe chronic gastritis and ulcer) which can lead to stomach cancer. The Coxsackie virus, through binding to receptors on cardiac myocytes, can cause heart disease (acute myocarditis and cardiomyopathy), and ultimately death.
Acute microbial diseases that occur immediately after infection can cause epidemics and pandemics (worldwide epidemics). Everyone has experienced the COVID-19 pandemic caused by the SARS-CoV-2 coronavirus. Johns Hopkins estimates as of 3/10/23 (end of their data collection), that there were about 677 million reported cases of Covid-19 and about 6.9 million deaths. The WHO estimates that just for the first two years of the pandemic (2020 and 2021), there were 14.83 million excess deaths globally, 2.74 times more than the number or reported death (5.42 million) from the virus. Machine learning models suggest that there have been closer to 20 million excess death through the end of March 2023, as shown in Figure \(\PageIndex{1}\) below.
Figure \(\PageIndex{1}\): https://ourworldindata.org/excess-mortality-covid
The data from Johns Hopkins suggest that the average mortality rate was about 1% (deaths/infections). If there have been 20 million cases (based on excess deaths) out of a world population of 8 billion, the mortality rate was close to about 0.25% for the entire world.
Another indicator of the severity of pandemics is a decrease in life expectancy. Figure \(\PageIndex{2}\) below offers an interactive graph that shows the general rise in life expectancies since 1750 punctuated by steep drops.
Figure \(\PageIndex{2}\): Life expectancies since 1750
Note the small drop in 2020 in the United State was caused by the Covid-19 pandemic with some contribution from opioid-associated deaths. The graph is dominated by a stunning decline in 1918 due to the 1918 Flu Pandemic (also historically and inaccurately named the Spanish flu). The large drop in life expectancy in Sweden in 1772-1773 was probably attributed to the Russian plague epidemic of 1770–1772, also known as the Plague of 1771. Figure \(\PageIndex{3}\) below shows a history of pandemics back to the Antonine Plague of 165-180 CE. In viewing the figure, remember that the numbers of deaths are estimates at best, especially for the historically early pandemics.
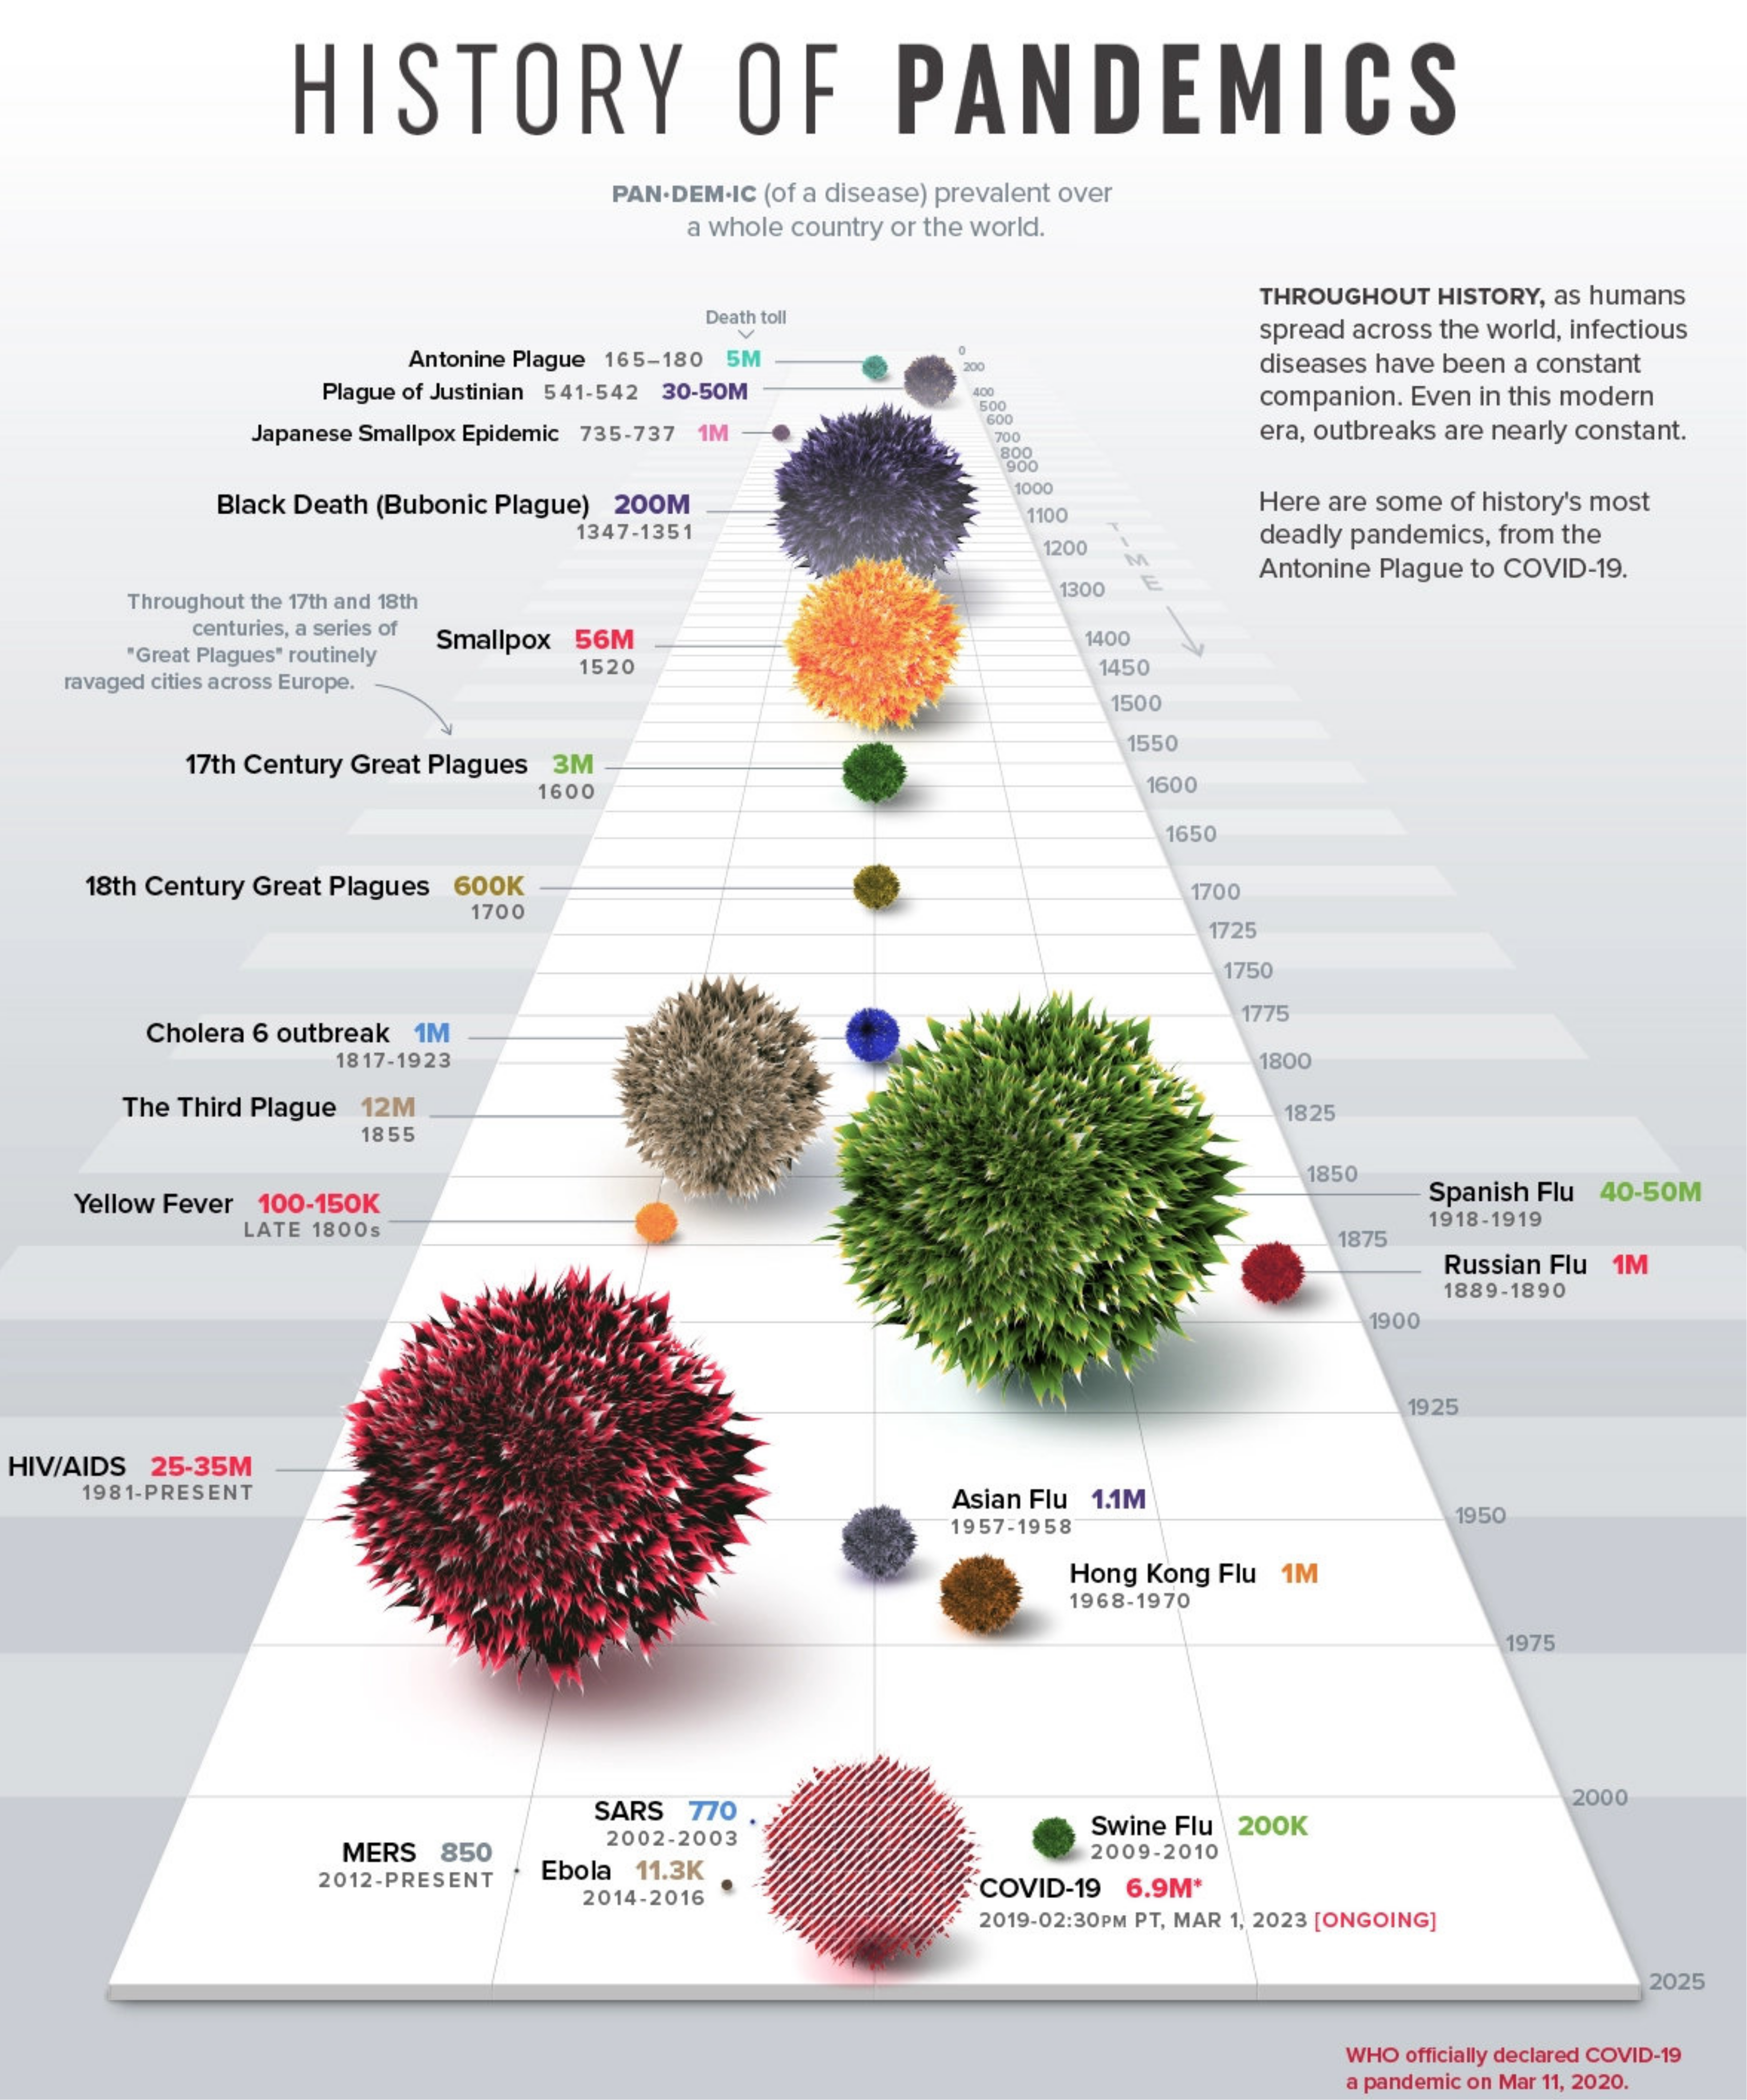
Figure \(\PageIndex{3}\): Visualizing the History of Pandemics. Attribution Visual Capitalist. https://www.visualcapitalist.com/his...ics-deadliest/
The graphic misses another key plaque in world history, the Plaque of Athens, which hit the city from around 430 BCE - 427 BCE, during which up to 25% of the city's population died. Smallpox has emerged as a possible candidate for that outbreak.
Figure \(\PageIndex{4}\) below shows the estimated death tolls of pandemics from the Black Death of 1347-1353 through Covid-19 Pandemic.
.png?revision=1)
Figure \(\PageIndex{4}\): What were the death tolls from pandemics in history? Saloni Dattani (2023) - “” Published online at OurWorldInData.org. Retrieved from: 'https://ourworldindata.org/historical-pandemics'
The Black Death (also called the Bubonic Plague) was caused by the bacterium, Yersinia pestis. Humans usually get the bubonic plague after being bitten by a rodent flea that is carrying the plague bacterium or by handling an animal infected with the plague (notice the bold letter B to help you remember Black, Bubonic, Bacterium, Bite). The Black Death/Bubonic Plagues derives its name from the fact that many had black tissue from gangrene. Large buboes, and inflammatory swellings of lymphatic glands, especially in the groin or armpit, were common. Another variant caused by Y. pestis is the Pneumonic Plague, caused by breathing particles containing Y. pestis into the lungs, which leads to death from pneumonia and its complications. That was more infectious since it could be spread from person to person. Modern antibiotics are used to treat the plague, which still occurs.
Measles: A disease not shown in the figure is measles, which probably has killed upwards of 200 million people throughout time. It emerged from a viral infection, rinderpest, which infects cattle, deer, and buffalo. In 2021 there were 128,000 deaths out of 9 million cases worldwide, even though there is a highly effective vaccine. Vaccinations have decreased since the Covid-19 pandemic. Since it is one of the most infectious viruses known, and one contract leads to life-long immunity, a large population (250,00-500,000) is needed for it to self-sustain. The most recent analysis of historical sequences suggests that it emerge (jumped to humans) around the 6th century BCE, around the time when cities of high enough population formed to allow its emergence. Measles is caused by an RNA virus, and since RNA is much more labile than DNA, few historical traces of the measles virus are available. The oldest one is from 1911 and it was from this and newer viruses that a phylogenetic RNA tree using a molecular clock model was constructed that led to the 6th century BCE time of emergence. Cities with a critical number of people for sustaining an emergence existed about 300 BCE in North Africa, India, China, Europe, and the Near East. A disease similar to measles was mentioned by Rhazes (Persia, 10th century CE). Past pandemics of unclear etiology could be attributed to measles, but it's difficult to know for sure given the difficulty in differentiating measles from other diseases.
Influenza: The genome of the influenza virus consists of 8 separate segments of ssRNA, much like the human genome resides on 23 different "segmented" chromosomes. Because its genome consists of RNA, past traces of it that point to its origin is lacking. The human influenza virus arose from swine (causing swine flu) and birds (avian flu). Hippocrates wrote of a disease with similar symptoms in 412 BCE. In 1357 an epidemic called “influenza di freddo,” or cold influence, swept Florence, Italy. The influenza RNA genome and transcribed proteins are shown in Figure \(\PageIndex{5}\) below.
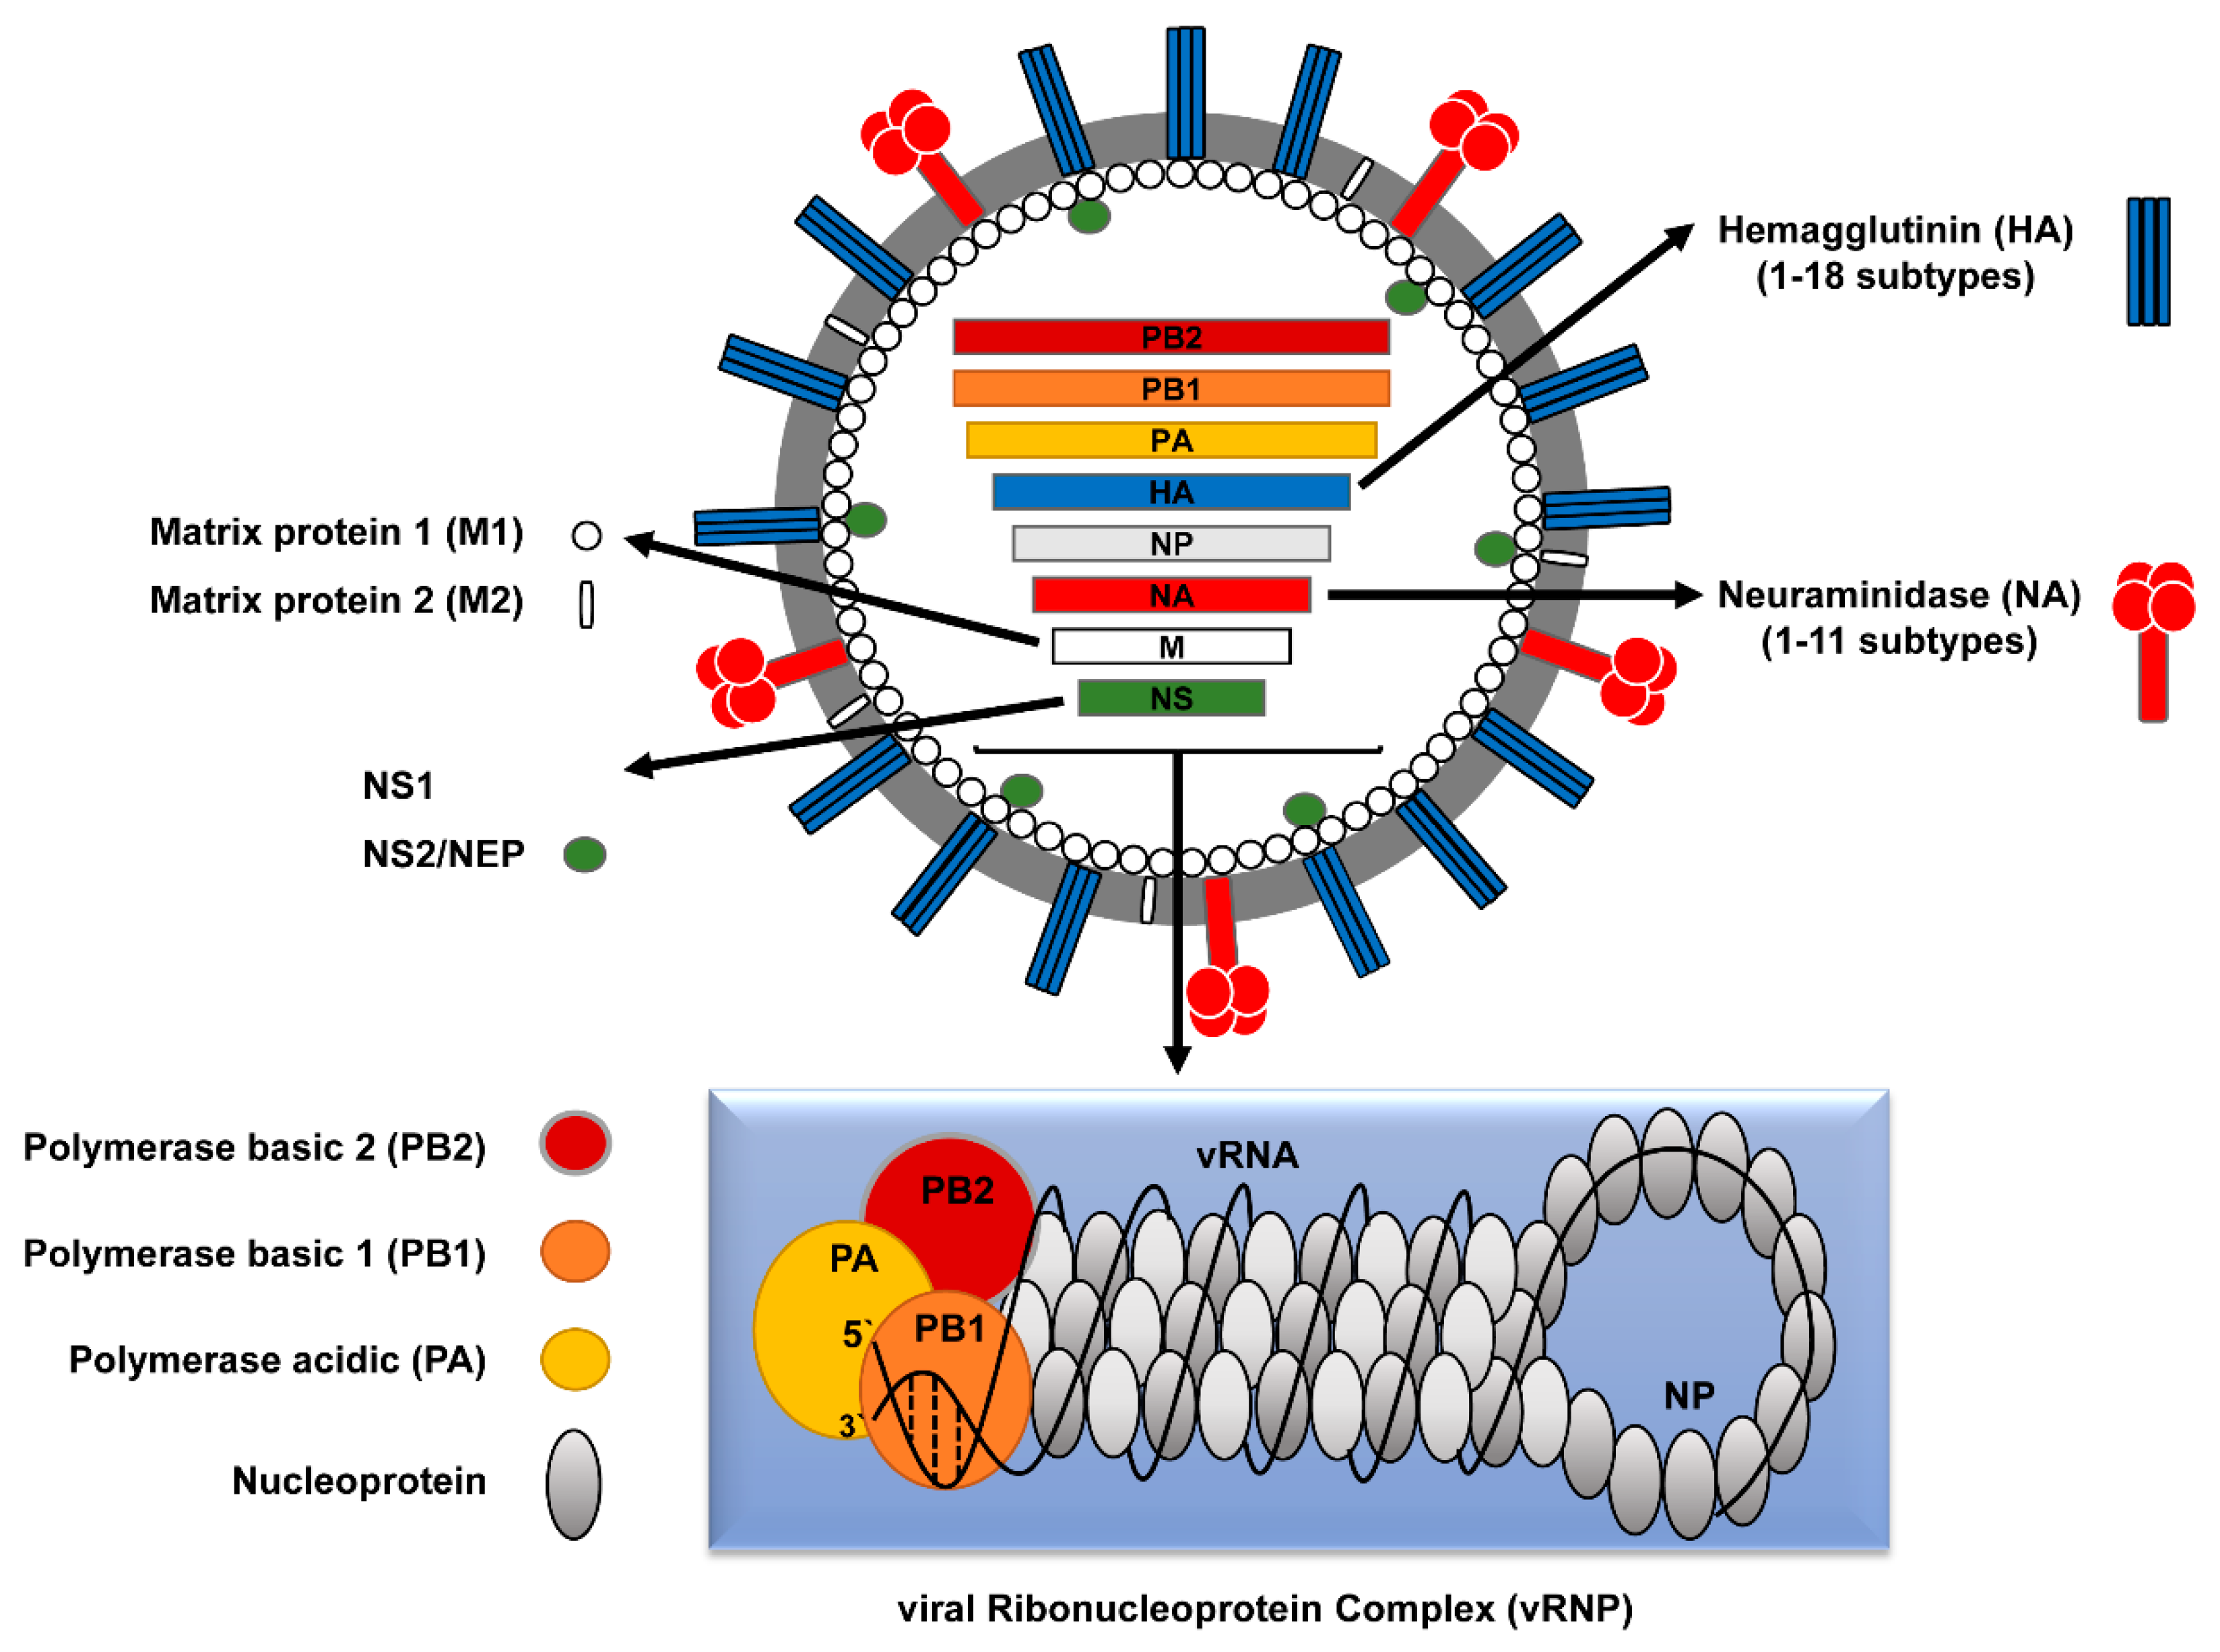
Figure \(\PageIndex{5}\): Influenza RNA genes and their protein products. Ahmed Mostafa, Elsayed M. Abdelwhab, Thomas C. Mettenleiter, and Stephan Pleschka - mdpi.com/1999-4915/10/9/497/htm, CC BY 4.0, https://commons.wikimedia.org/w/inde...curid=92987475
The hemagglutinin (H) membrane protein, responsible for viral binding to host cells, and neuraminidase (N), required for the exit of newly replicated viruses and hence viral propagation, are especially key in understanding past and future pandemics. There are 18 different subtypes of H and 11 subtypes of N comprising 4 different types of viruses (A-D) with A and B being the most common. The main types in circulation in 2022 were types A (H3N2) and B (H1N1).
Since the genome consists of RNA replicated by a RNA polymerase, which does not have proofreading functions, mutations occur on viral replication. This leads to slow changes in viral protein sequence and structure, called antigen drift, and hence to viruses less recognized by the host immune system. This is why new influenza vaccines are formulated each year (through a process that requires growing the virus in eggs).
Large-scale pandemics occur through antigen shifts. This occurs when an animal such as a pig gets infected with an avian virus, a not unlikely occurrence given the co-farming of these animals in many places in the world. Newly replicated pig viruses could then contain some avian viral segments, which when transmitted to humans could produce lethal disease since they have no immunological memory in the host to produce an immediate immune response. Analyzes show that the horrific 1918 flu pandemic was caused by an avian influenza virus. An ancestral virus from the late 1880s is related to the horse (equine) H7N7 and equine H3N8 as well as to birds, humans, and swine viruses, and was the likely precursor of the 1918 flu virus. This ancestral virus led to a global change in the avian influenza virus which contributed most of the RNA segments to the 1918 pandemic. Smaller pandemics in the last half of the 20th century were likely caused by quick replacements of H3N2 and H1N1 genes leading to evolutionary fitness and ease of transmission. We should be on guard as there is an ongoing, worldwide highly virulent avian flu (H5N1) pandemic in wild birds and domestic poultry that has jumped to some animals, including humans who handle infected birds.
The hemagglutinin protein, homotrimer (3 identical protein subunits), MW 220,000, is the most abundant protein on the viral surface. Only three have adapted to humans in the 20th century, giving pandemic strains H1 (1918), H2 (1957), and H3 (1968). Three recent avian variants (H5, H7, and H9) can jump directly to humans but have low human-to-human transmissibility.
The viral hemagglutinin binds to glycoprotein receptors on human and other animal cells. The receptor binding site on host cells contains a terminal sialic acid (Sia) covalently attached to a galactose. The sialic acid is usually connected through an α(2,3) or α(2,6) link to galactose on N-linked glycoproteins. The viral subtypes found in avian (and equine) influenza bind preferentially to host Sia α(2,3) Gal which predominates in the avian GI tract where viruses replicate. Human influenza binds preferentially to Sia α(2,6) Gal links on human cells. The swine influenza HA binds to both Sia α(2,6) Gal and Sia α(2,3) Gal. The structures of the Sia-Gal disaccharide are shown in Figure \(\PageIndex{6}\) below.
| Sia α(2,6) Gal (Human and swine) | Sia α(2,3) Gal (Avian and Swine) |
|
|
|
|
(made with Sweet, with an OH, not AcNH on sialic acid on C5) |
(made with Sweet, with an OH, not AcNH on sialic acid on C5) |
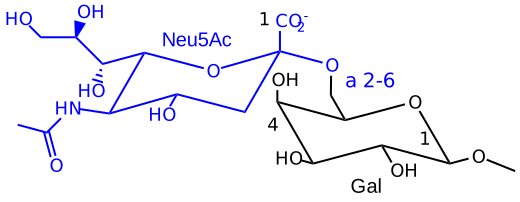
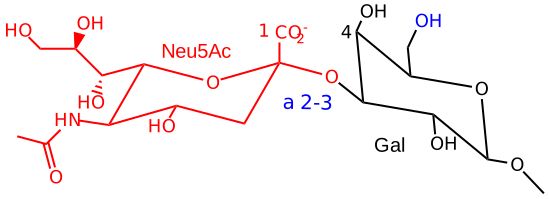
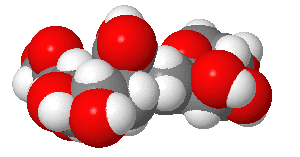
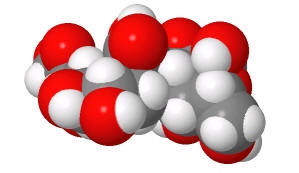
Figure \(\PageIndex{6}\): Structures of Sia α(2,6) Gal (human) and Sia α(2,3) Gal Gal (avian/swine)
The H5N1 avian virus is deadly but lacks human-to-human transmissibility. Why? One reason is that it appears to bind deep in the lungs and is not released easily on coughing or sneezing. It appears that cell surface glycoproteins deeper in the respiratory tract have Sia (α2,3) Gal linkages which account for this pathology.
Small changes in the amino acids of the viral hemagglutinin (HA) could change the preference for binding between Sia α(2,6) Gal (predominant human form) and Sia α(2,3) Gal (predominate form in birds) on host cells, and could dramatically affect both human lethality and transmission. Even though it was mostly of avian origin, the predominant 1918 hemagglutinin bound to the human Sia α(2,6) Gal.
Figure \(\PageIndex{7}\) shows an interactive iCn3D model of a H1 1918 hemagglutinin with a human receptor (2WRG), in this case, just the Sia α(2,6) Gal disaccharide from a target N-linked glycoprotein.
.png?revision=1&size=bestfit&width=185&height=323)
Figure \(\PageIndex{7}\): H1 1918 hemagglutinin with the human receptor - the Sia α(2,6) Gal dissachharide (2WRG). (Copyright; author via source). Click the image for a popup or use this external link: https://structure.ncbi.nlm.nih.gov/i...svY14r7wmnM1r5
The HAs in each of the 20th-century influenza pandemics, 1918 (H1N1), 1957 (H2N2), and 1968 (H3N2), preferentially bound to the Sia α(2,6) Gal even though the 1918 viruses and presumably the other, arose from avian viruses with a Sia α(2,3) Gal preference.
Figure \(\PageIndex{8}\) shows an interactive iCn3D model of α-2,6-linked sialyl-galactosyl ligand binding to the H1 1918 hemagglutinin (2WRG).
.png?revision=1&size=bestfit&width=449&height=316)
Figure \(\PageIndex{8}\): α-2,6-linked sialyl-galactosyl ligand binding to H1 1918 hemagglutinin (2WRG). (Copyright; author via source). Click the image for a popup or use this external link: https://structure.ncbi.nlm.nih.gov/i...yNJHQaQQebSuT9
A variant of the 1918 virus, A/South Carolina/1/18 (18H1), also circulated at the time. It contained a single amino acid mutation, D225G. in the HA protein. That variant switched the HA binding specificity on its target from Sia α(2,6) Gal to both Sia α(2,6) Gal and Sia α(2,3) Gal. This change eliminated a salt bridge (ion-ion interaction) between K222 and D225 in the main variant (see the blue-dotted line in the above model). This in turn allowed another key residue, Q226, to bind to the host receptor.
The viral HA in the 2009 human influenza pandemic had K222 and D225, giving it specificity for Sia α(2,6) Gal. Late in that pandemic (as occurred in the 1918 pandemic), a mutated version, D225G, that produced more severe symptoms was isolated. It had also gained dual specificity. Another mutant D225E did not as the salt bridge was maintained and the binding to Sia α(2,6) Gal was actually strengthened. Binding studies showed that the D225G mutants in the HA of both 18H1 and 09H1 viruses bound with higher affinity than the wild-type HAs which likely allowed binding to host glycoproteins deeper in the lung.,
The dissociation constant KD and the on rate, kon, and off rate, koff, for the 09H1 and 18H1 hemagglutinins and relevant mutants, were determined by surface plasmon resonance spectroscopy (see Chapter 5.2 for a review of SPR). Table \(\PageIndex{1}\) below shows their values.
| Hemagluttinin | Sia-Gal link | KD (μM) | kon (s-1) | koff (M-1s-1) |
| 09H1 | α(2,6) | 3.74 | 319 |
0.00119 |
| 09H1 | α(2,3) | nd | nd | nd |
| 09H1 D225G | α(2,6) | 0.475 | 3650 |
0.00173 |
| 09H1 D225G | α(2,3) | 2.24 | 1460 |
0.00327 |
| 18H1 | α(2,6) | 13.7 | 125 | 0.0017 |
| 18H1 | α(2,3) | nd | nd | nd |
| 18H1 D225G | α(2,6) | 8.35 | 531 | 0.00444 |
| 18H1 D225G | α(2,3) | 4.73 | 984 | 0.00466 |
Table \(\PageIndex{1}\): Dissociation and are constants for the interaction of hemagglutinins (H) from the 2009 and 1918 pandemics with Sia-Gal ligands. Adapted from Zhang et al., J Virol. 2013 May;87(10):5949-58. doi: 10.1128/JVI.00545-13. Epub 2013 Mar 20. PMID: 23514882; PMCID: PMC3648181.
It's remarkable how one amino change that can lead from no to strong binding can alter the specificity of a protein for its ligand and human history as well.
Slower-acting but very lethal microbial diseases have taken a vast number of lives
Malaria: Each year there are an estimated 300-500 million cases that result in about 2.7 million death. Most deaths are children under 5 in sub-Saharan Africa. The disease is caused mainly by the female Anopheles mosquito which transmits Plasmodium falciparum and the less lethal Plasmodium vivax. In the 100 years of the 20th century between 150-300 million deaths have been attributed to malaria (2-5% of all deaths). It was brought to the new world from Africa by the slave trade of over 7 million Africans, and from Portugal and Spain (the main colonial powers where malaria was endemic. The bacteria probably moved from gorillas to humans long ago in Africa. No effective vaccine has yet been developed to prevent this disease.
Proteins associated with the virus have been found in Egyptian samples from 3200 BCE and there were descriptions of the cyclic fevers associated with malaria in China in 270 BCE. It was also described by Homer (750 BCE), Plato, and Hippocrates in ancient Greece. It probably was first found in Rome around 0-100 ACE. The virus persisted in Europe for 2000 years.
Tuberculosis: This disease is caused by the Mycobacterium tuberculosis bacteria and is spread through the breath. Estimates are that up to 1 billion people have died of TB over history. The BCG vaccine is somewhat effective against TB but not often administered given its low prevalence and the availability of antibiotics. Tuberculosis (TB) was called “phthisis” in ancient Greece, and “tabes” in ancient Rome. The modern common ancestor of this bacteria arouse around 6000 years ago and is associated with disease in both the Old and New World.. Older strains were likely found in seals and sea lions. Genetic analysis showed that the modern strain was found in Peru before the arrival of Europeans to the New World. The disease in the Western Hemisphere probably derived from sea mammals which crossed the ocean.
Vaccines against some of our worst infectious disease agents have saved millions of lives. Here are some examples.
Figure \(\PageIndex{9}\):
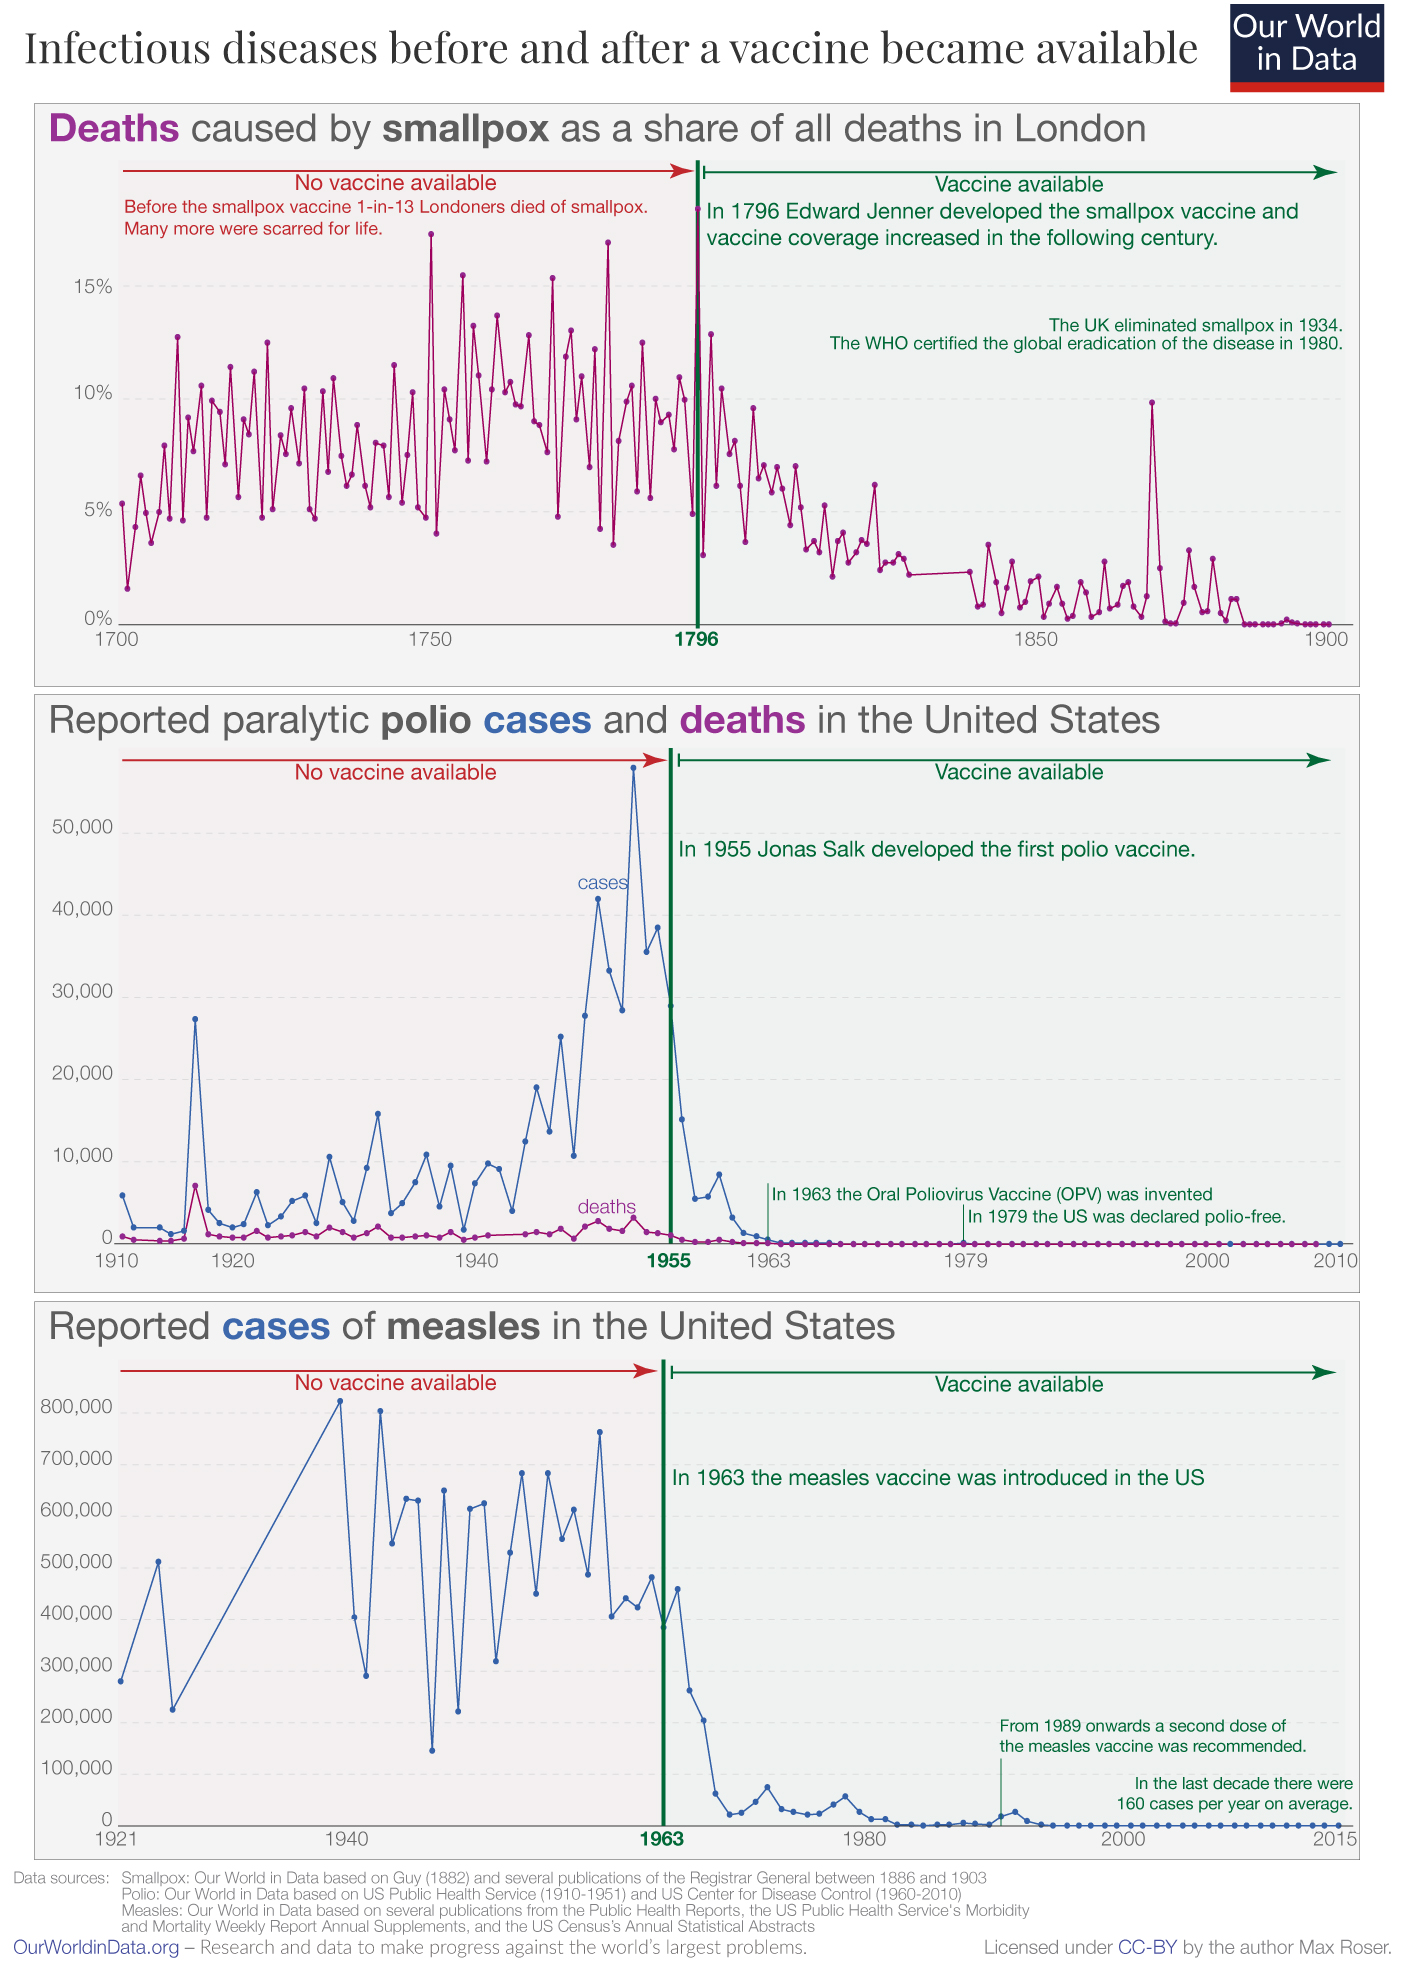
Figure \(\PageIndex{9}\): : https://ourworldindata.org/microbes-...ience-vaccines
Mathematical models show that from 12/20 through 12/22, Covid vaccines prevented over 120 million infections, 18.5 million hospitalizations, and 3.2 million deaths just in the United States. In the first year of the pandemic (12/20-12/21), models show that 14.4 million deaths (and 19.4 million excess deaths) were prevented in the whole world.
Before Columbus came to the New World, there was no typhoid, flu, smallpox, or measles there. These diseases were present in Eurasia where people lived in increasingly populated areas in close quarters with domesticated animals. They would have developed some immunity over time. Their microbes likely derived from domestic animals before jumping species to humans, much as modern flu can be passed from swine to humans and less regularly but more lethally from birds to humans. Even with the buildup of some immunity, new pandemics were utterly devastating.
Indigenous peoples in the new world were never exposed to these pathogens before the arrival of people from the Ols World. They only utilized llamas for work and not generally for food and milk. Deaths were staggering. It's estimated that 90% of indigenous people died, a far higher proportion than seen even with the Black Plague in Europe. Imagine the loss of culture and civilization that would accompany a decline in the population of central Mexico from 15 million to 1.5 million in the 100 years after 1519.
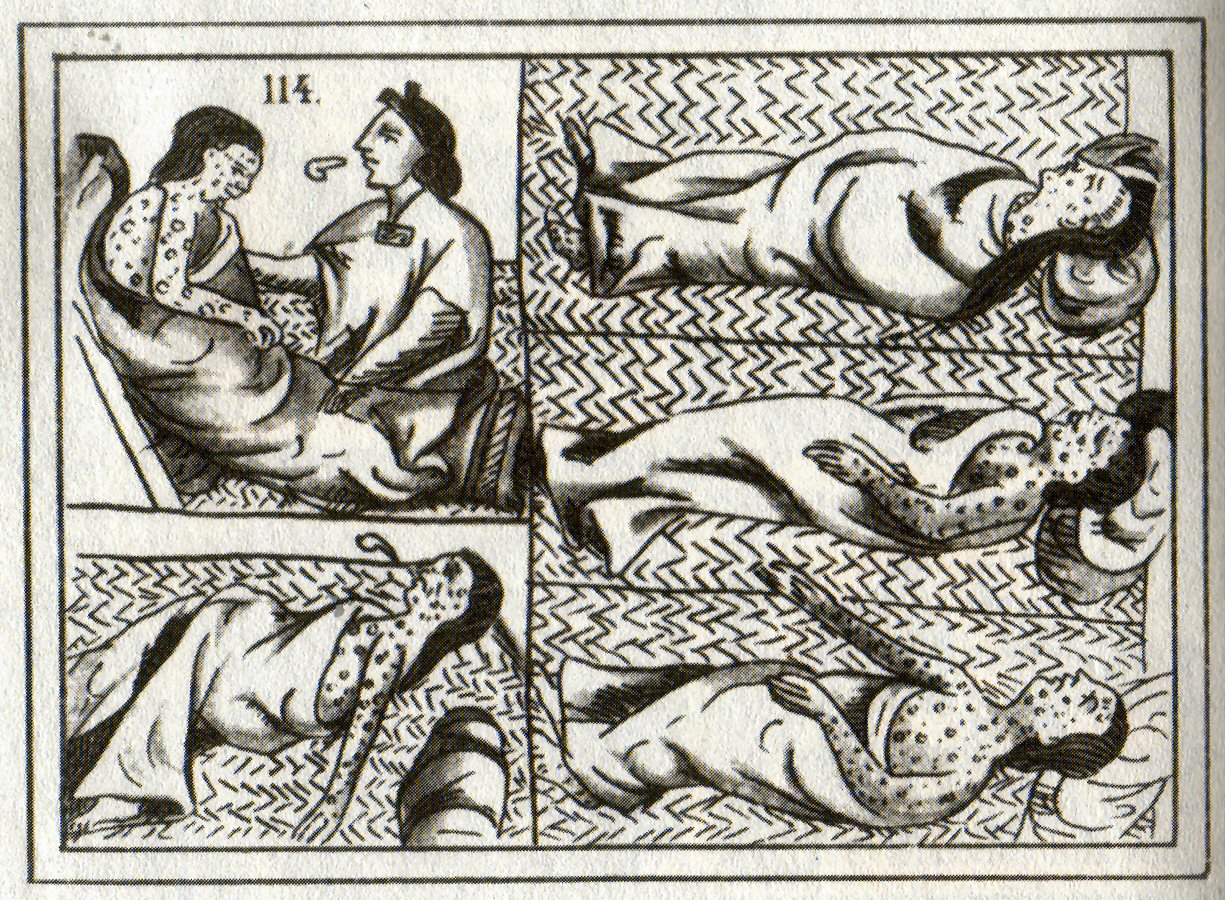
Figure \(\PageIndex{10}\): Sixteenth-century Aztec drawings of victims of smallpox. https://en.wikipedia.org/wiki/Native..._and_epidemics
Social conditions after the initial collapse of the indigenous people in the Americas led to their continued decline, even though they would have gained some immunity. An example is offered by Ostler who describes the health consequences of the Indian Removal Act of 1830, which led to the forced relocation of Native people east of the Mississippi River into "Indian Territory" (Oklahoma and Kansas). As an example, 16,000 Cherokee were expelled and forced to live in camps with few resources, where up to 2000 died of measles, malaria, dysentery, and whooping cough. 1500 more died as they moved west. More died in Oklahoma, leading to a death toll of 25% of the original group.
Cumulative death rates in the COVID-19 pandemic show that Indigenous peoples in the United State still have barriers to optimal health care.
Figure \(\PageIndex{11}\): Cumulative Deaths and Age-Adjusted Rates per 100,000 in the United States.
Infectious, Emerging and Pandemic Diseases - Links to Climate Change
Our understanding of infectious diseases clearly shows that the great epidemics and pandemics of the world have arisen when microbial pathogens make the jump from animals to humans who have not experienced them before. For example, HIV/AIDS arose when simian immunodeficiency viruses, to which non-human primates were adapted, jumped to humans in central Africa. The best available data suggest that the SARS-CoV-2 virus jumped from bats to animals (raccoon dogs or other animals from Wuhan China live animal markets) and then to humans, although some data suggest the possibility of a lab leak.
A Zoonotic disease (zoonosis, plural zoonoses) is a microbial infectious disease transmitted reversibly between animals and humans. The major types of zoonoses are viral, bacterial, parasitic, mycotic/fungal, rickettsial (obligate intracellular Gram-negative bacteria found in ticks, lice, fleas, mites, chiggers, and mammals), Chlamydial (bacteria that cause STDs), Protozoal or unconventional (such as prions). The ones most prevalent in the US are influenza, Salmonellosis, West Nile virus, Plague, coronaviruses, rabies, Brucellosi, and Lyme disease. Vector-borne diseases are caused by bacteria, viruses, and parasites transmitted through bites of vectors such as infected arthropods like mosquitoes, ticks, sandflies, and blackflies. The range of arthropod vectors expands with global warming as they are cold-blooded.
Several anthropogenic (human-caused) factors, including climate change, increase the chances of such jumps. These factors, many of which are interrelated include:
- movement of humans into environments where contact with disease-carrying organisms would increase transmission
- biodiversity loss which allows species and their microbes to move into new areas
- land use change (deforestation, farming, etc) that allows the expansion of species and microbes into new areas
- global warming, which encourages the movement of species and their microbes to new areas where human exposure is more likely
- climate change-induced changes in plant life that allow altered distributions of animals and microbes
- climate change-derived changes in precipitation patterns that affect the adaptation of species and their microbes.
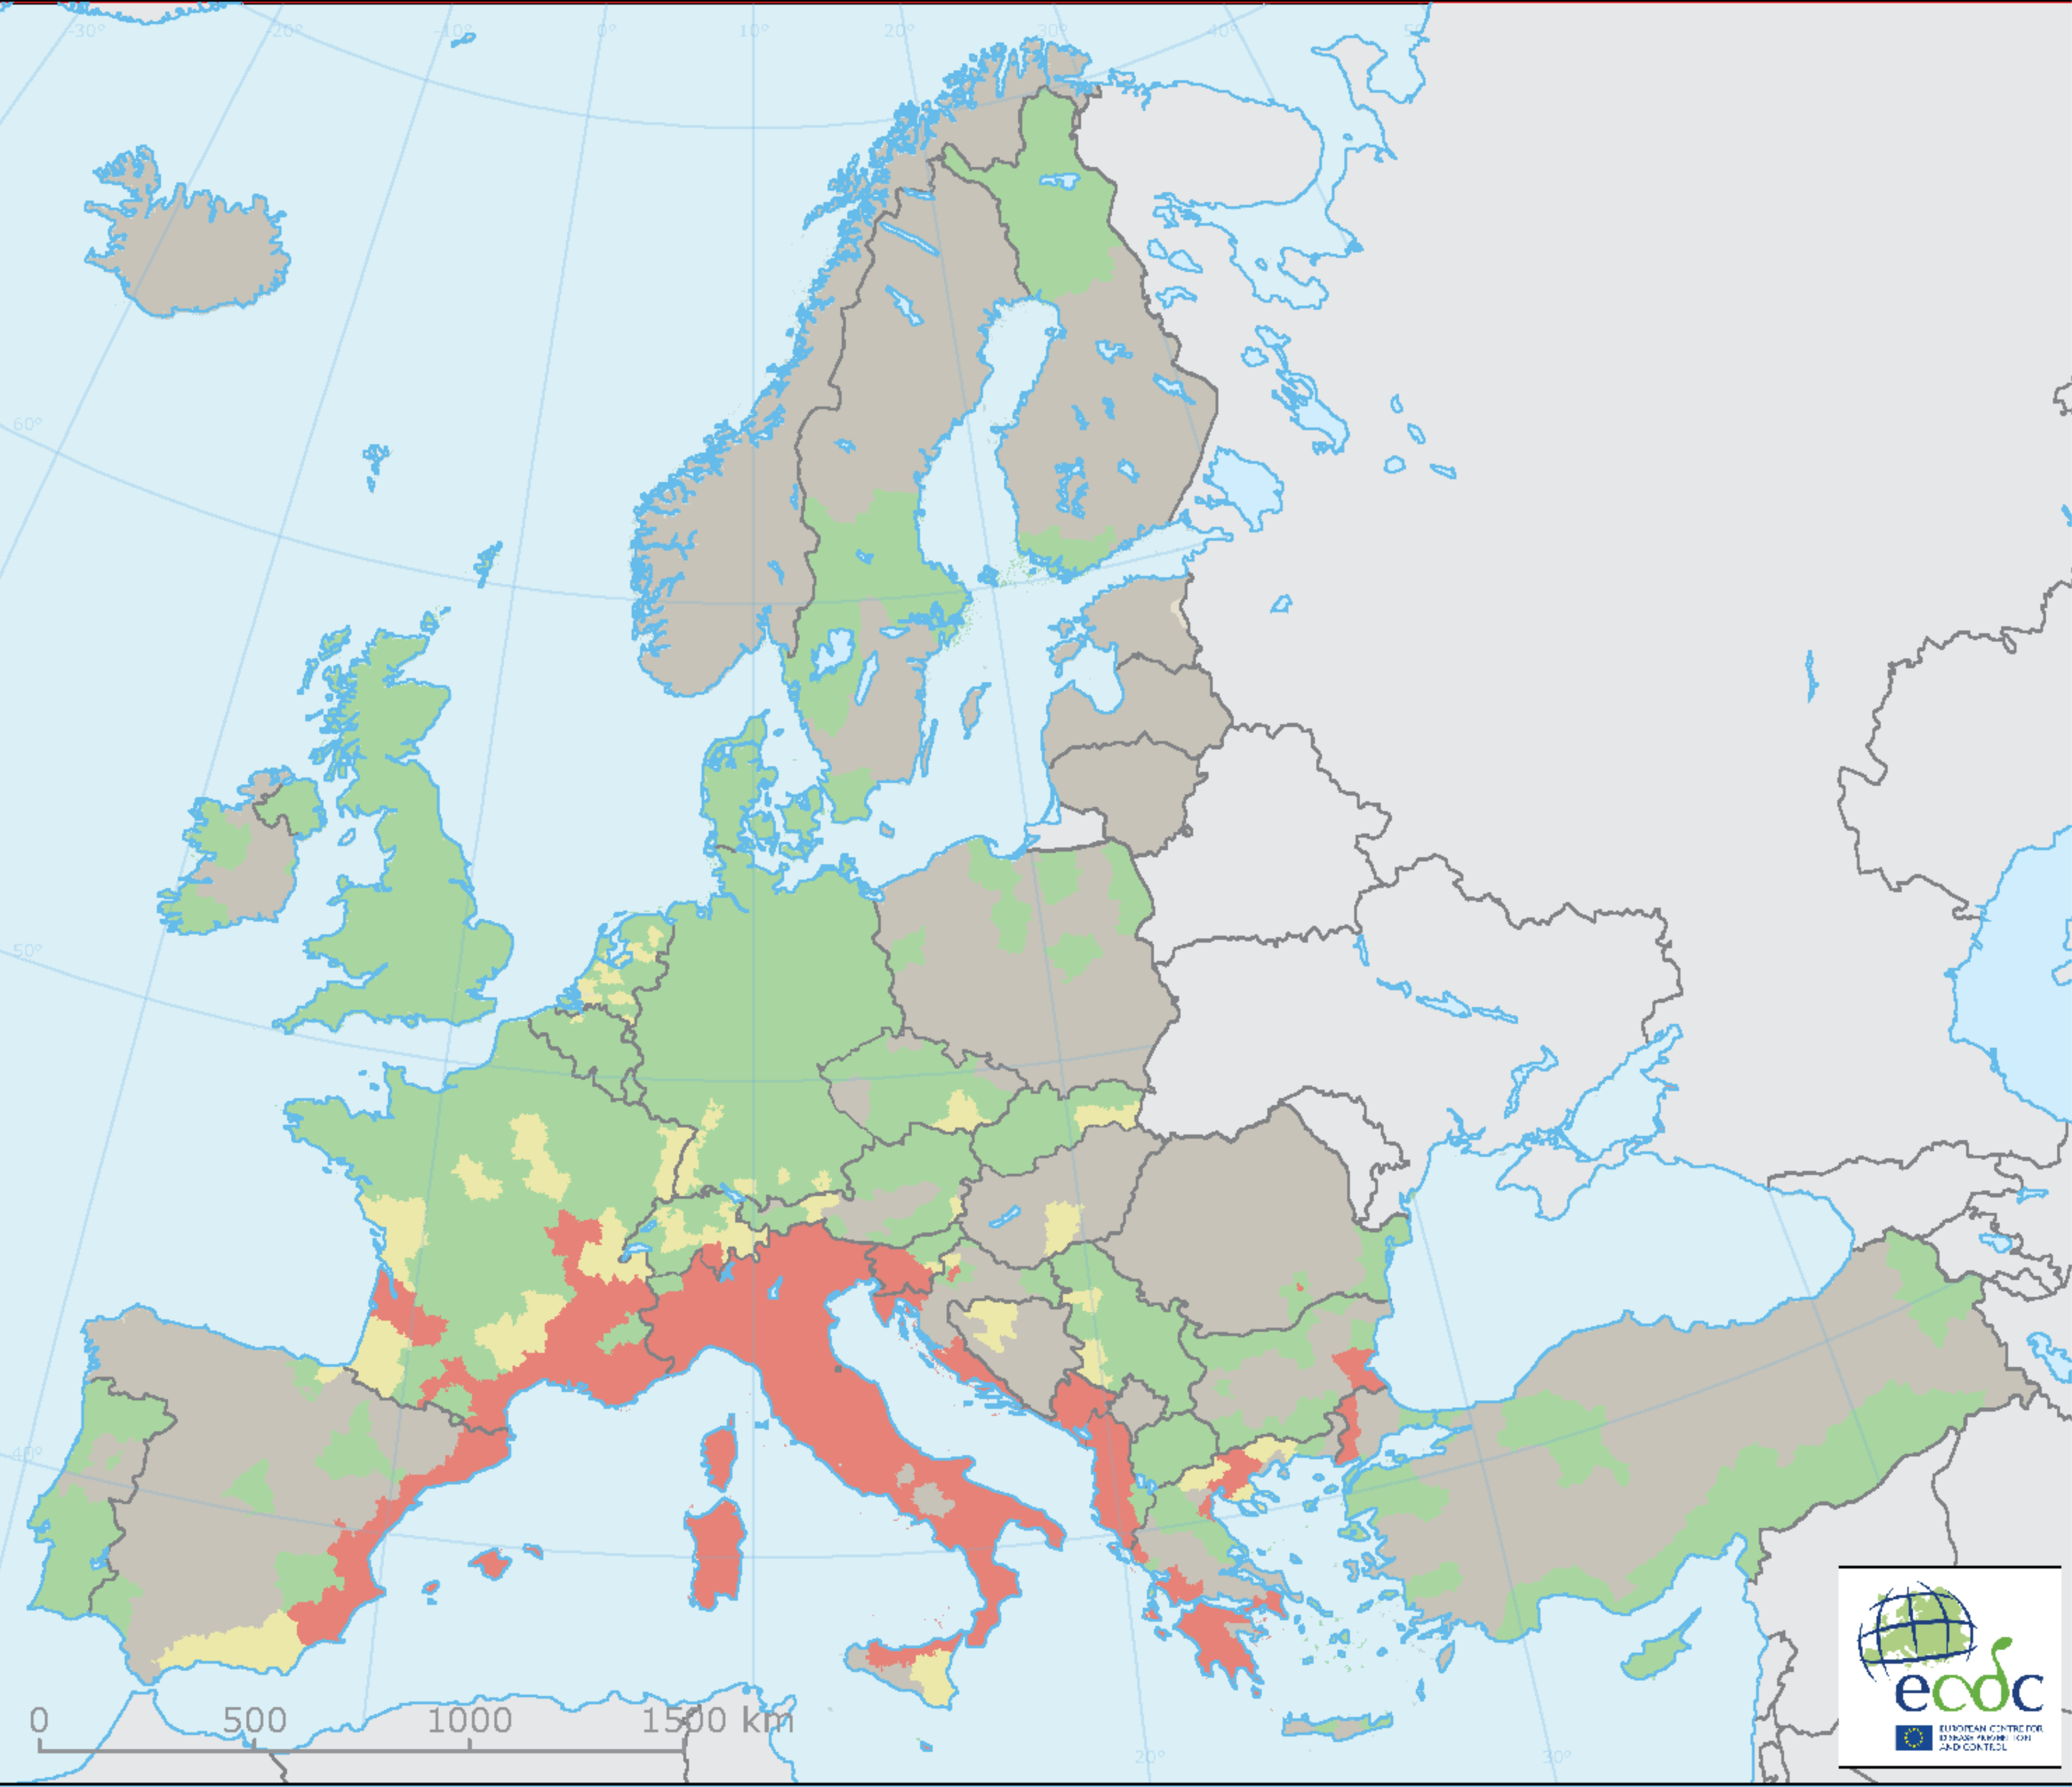
Humans affect all of these factors by causing climate change, and land use changes including the expansion of agriculture, urbanization, and the rapid global movement of people, commodities, and other animals. Studies have shown that 58% of human infectious diseases have already worsened with climate change. An invasive species that has expanded rapidly is the Tiger Mosquito (Aedes albopictus). It is a known vector of chikungunya virus (cause of Chikungunya fever) and dengue virus, the cause of dengue fever and dengue hemorrhagic fever. The change in its distribution in Europe in just 7 years is shown in Figure \(\PageIndex{12}\) below.
 |
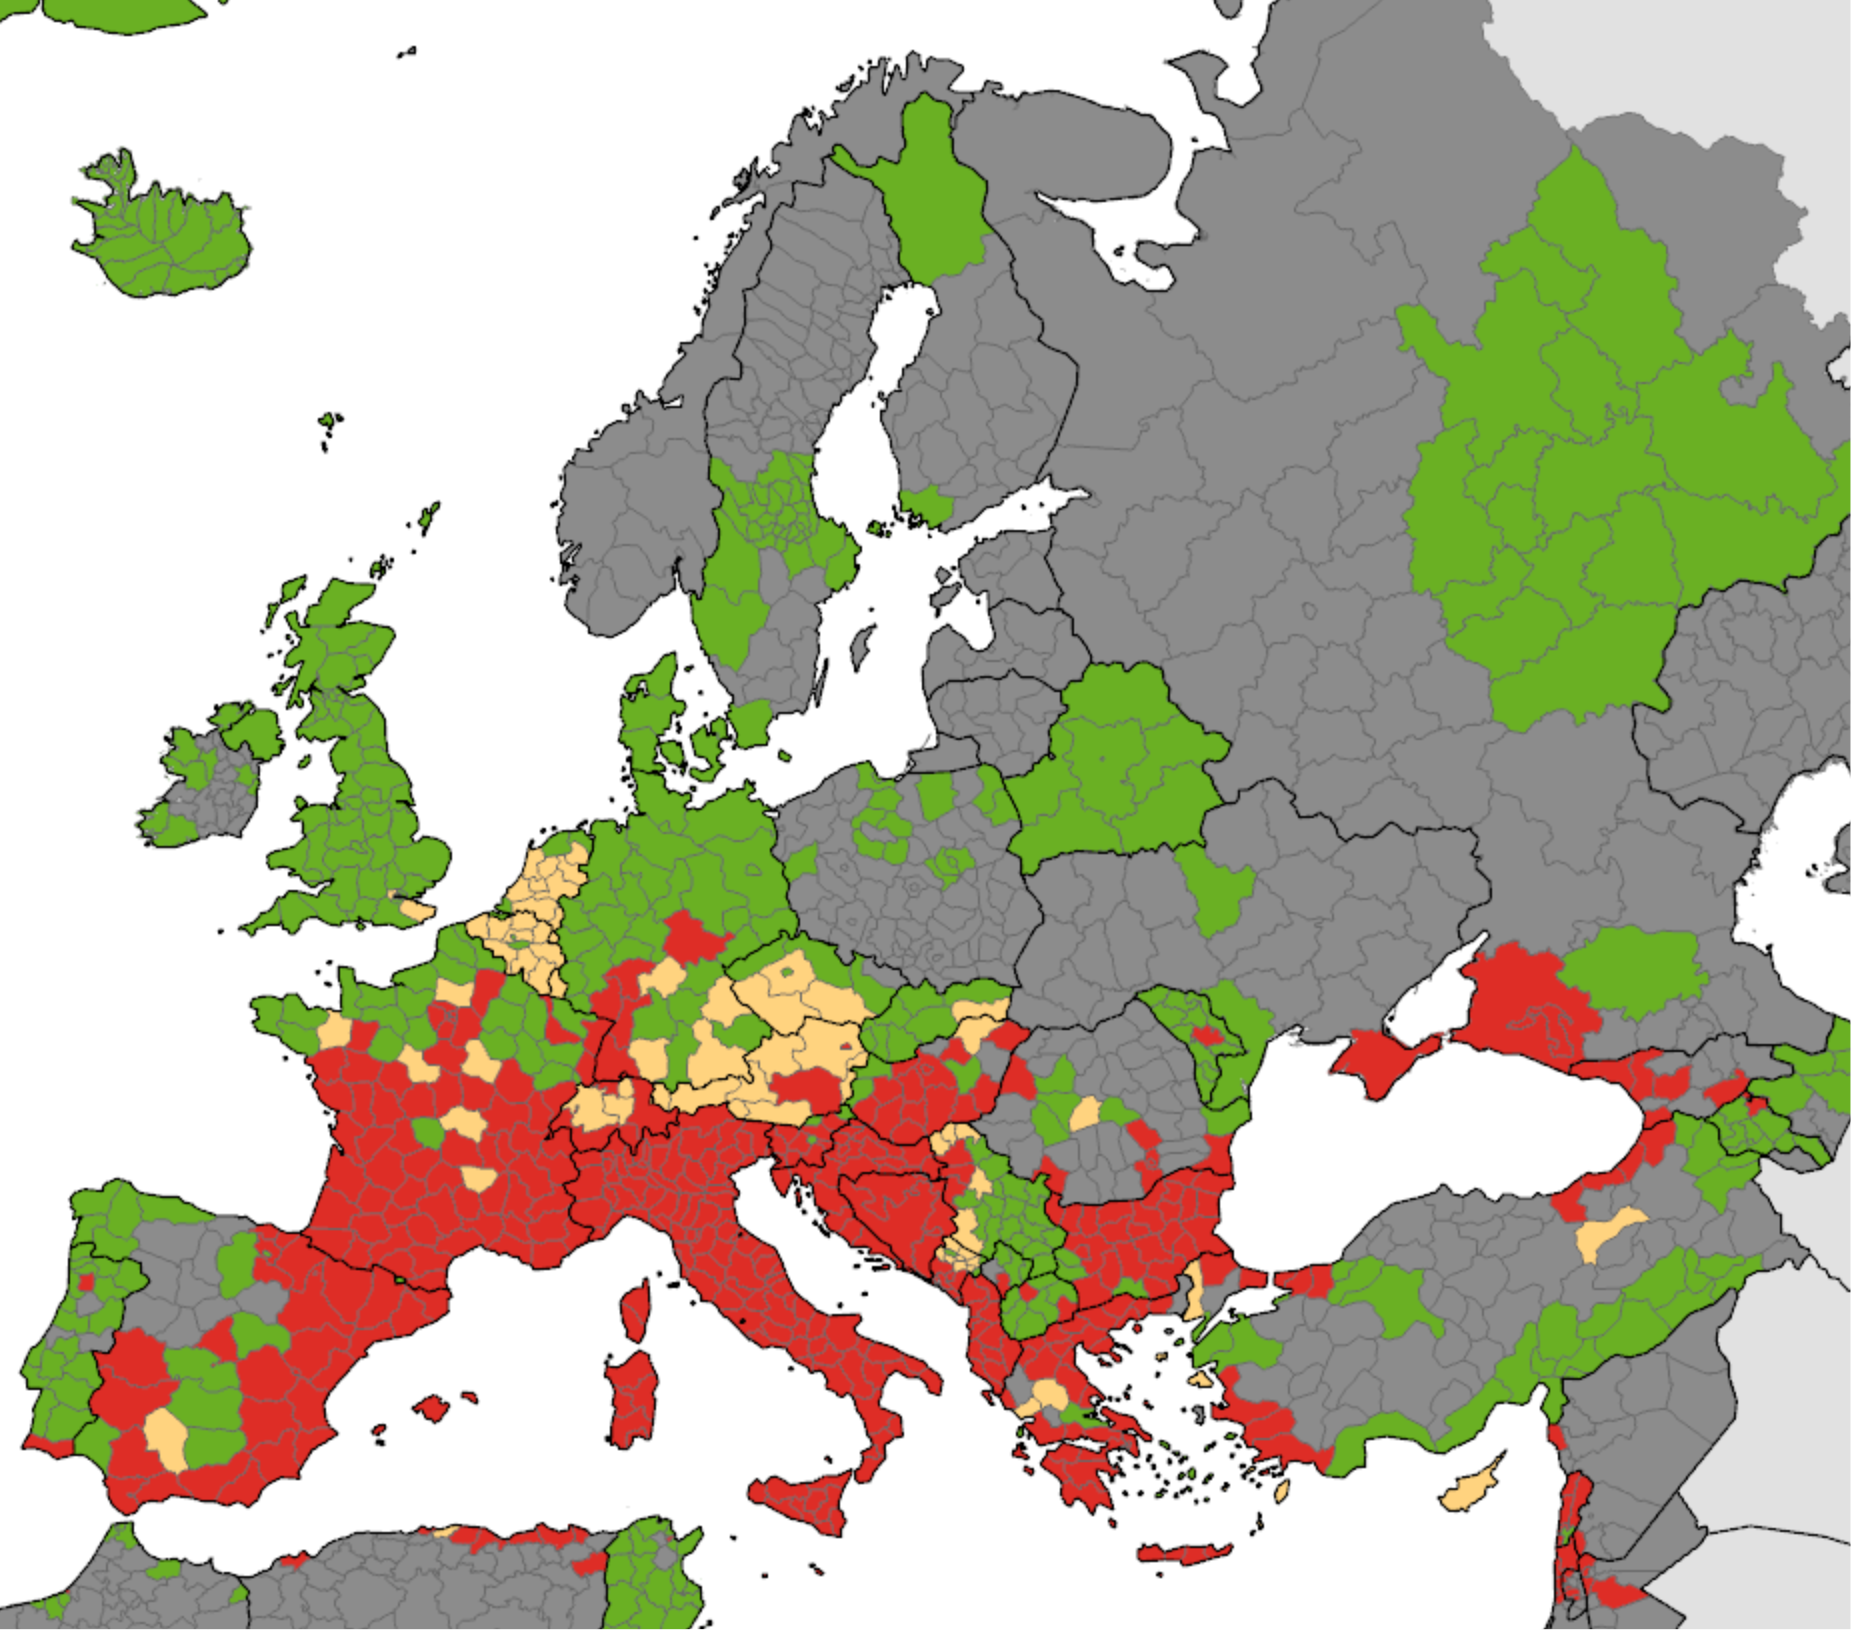 |
Figure \(\PageIndex{12}\): Change in distribution of Asian tiger mosquito (Aedes albopictus) in Europe. Left panel: Presence (red) of the Asian tiger mosquito (Aedes albopictus) in 2016. Right panel: presence (red) in 2023. Europe Environmental Agency.
Another study used databases of mammalian viruses and their host to see which ones might share viruses, an occurrence made much more likely when the species live in the same geographic area. Machine learning was used to model how mammals might share viruses and change their living range in a warming world through 2070. The study found over 4000 viruses could move among 3000 species, greatly enhancing the changes for the exchange of single and multiple viruses among species. Bats (see below) are especially worrisome as they harbor many viruses capable of infecting humans. As bats move habitats due to climate warming, their chances of infecting new species that could then infect humans are greatly increased.
25 years of land use changes in Australia led to altered bat (flying foxes) behavior and to their more permanent presence in agricultural land. This has resulted in viral"spillover" (transmission of a pathogen from a non-human vertebrate to a human) that is driven by periodic food shortages, especially in winters following El Nino weather patterns (characterized by less rain, warmer temperatures, and greater temperature extremes). These changes in bat behavior led to the emergence of the Hendra virus, which infected domestic horses (an intermediate vector), and could pass the virus to humans. The virus does not cause disease in bats but leads to a high mortality rate in horses (75%) and humans (57% based on just four deaths). With climate and land use change, bats persistently spent winters in agricultural lands close to horses. Spillovers occurred more frequently during low food conditions following an El Nino summer.
The Black Death (Second Great Pandemic, 1347-1351), occurred during the Little Ice Age in Europe (1300-1850), which also led to a great famine from 1315-1322. There is a link between the pandemic and climate change, but it's difficult to ascertain the strength of the association. An association exists between periodic warm springs and wet summers in Central Asia (using tree-ring data) and outbreaks of the Plague in Europe about 15 years later. This suggests a continual re-importation of Yersinia pestis in Asian rodents into Europe and could explain how long the Plague lasted in Europe.
The presence of the plague in gerbils in Kazakhstan would increase with warm spring and wet summer which increase gerbil and flee populations. This Moran effect (time correlation of two populations of a species with change in environment) is well known in population ecology. When gerbil populations collapse, the flea density of the remaining gerbils increases which also leads them to seek different hosts. The spread across geographic distance would take time. In the case of periodic import of flees to Europe, it has been proposed that the 4000 km from west central Asia to the Black Sea took 10-12 years (around 350km/y) .
Most attention has been given to pathogens moving northward from the south as warmer temperatures allow them to thrive in traditionally colder climates. There is growing parallel concern about pathogens moving south from the Arctic as it warms. In fact, the high northern latitudes have experienced the greatest increase in temperature as the planet warms. The Arctic is predicted to be soon ice-free in the summers.
One major concern is that thawing of the permafrost (comprising almost 1/4 of the northern hemisphere that is "permanently" frozen) will allow the release of CO2 (a metabolic product of microbes in the presence of oxygen) and CH4 (a metabolic product of Archeal microbes in an anoxic environment) from organic molecules previously found in frozen soils. (A similar concern is the release of "frozen" methane clathrates from a warmer ocean).
An emerging concern is the "activation" of microbes from the permafrost that have been sequestered and dormant for 500,000 years or more. In fact, species like tardigrades, rotifers, and nematodes, that can go dormant and enter a state called cryptobiosis in harsh conditions such as freezing and dehydration, can reactivate. Two species of nematodes (roundworms), dating back to 46,000 years ago (based on radioactive dating), the last years of the Pleistocene, were recovered and revived. Periodic re-occurences of anthrax from the release of the Gram-positive bacterium Bacillus anthracis spores from permafrost thawed in summers have been reported. In 2016, when average temperatures were significantly elevated (see Figure \(\PageIndex{13}\) below), over 2000 reindeer died (close to a 90% mortality rate) and close to 100 people were hospitalized from an anthrax outbreak in Siberia. On June 20, 2020, a record temperature of 38 °C (100 °F) in the Russian town of Verkhoyansk was recorded!
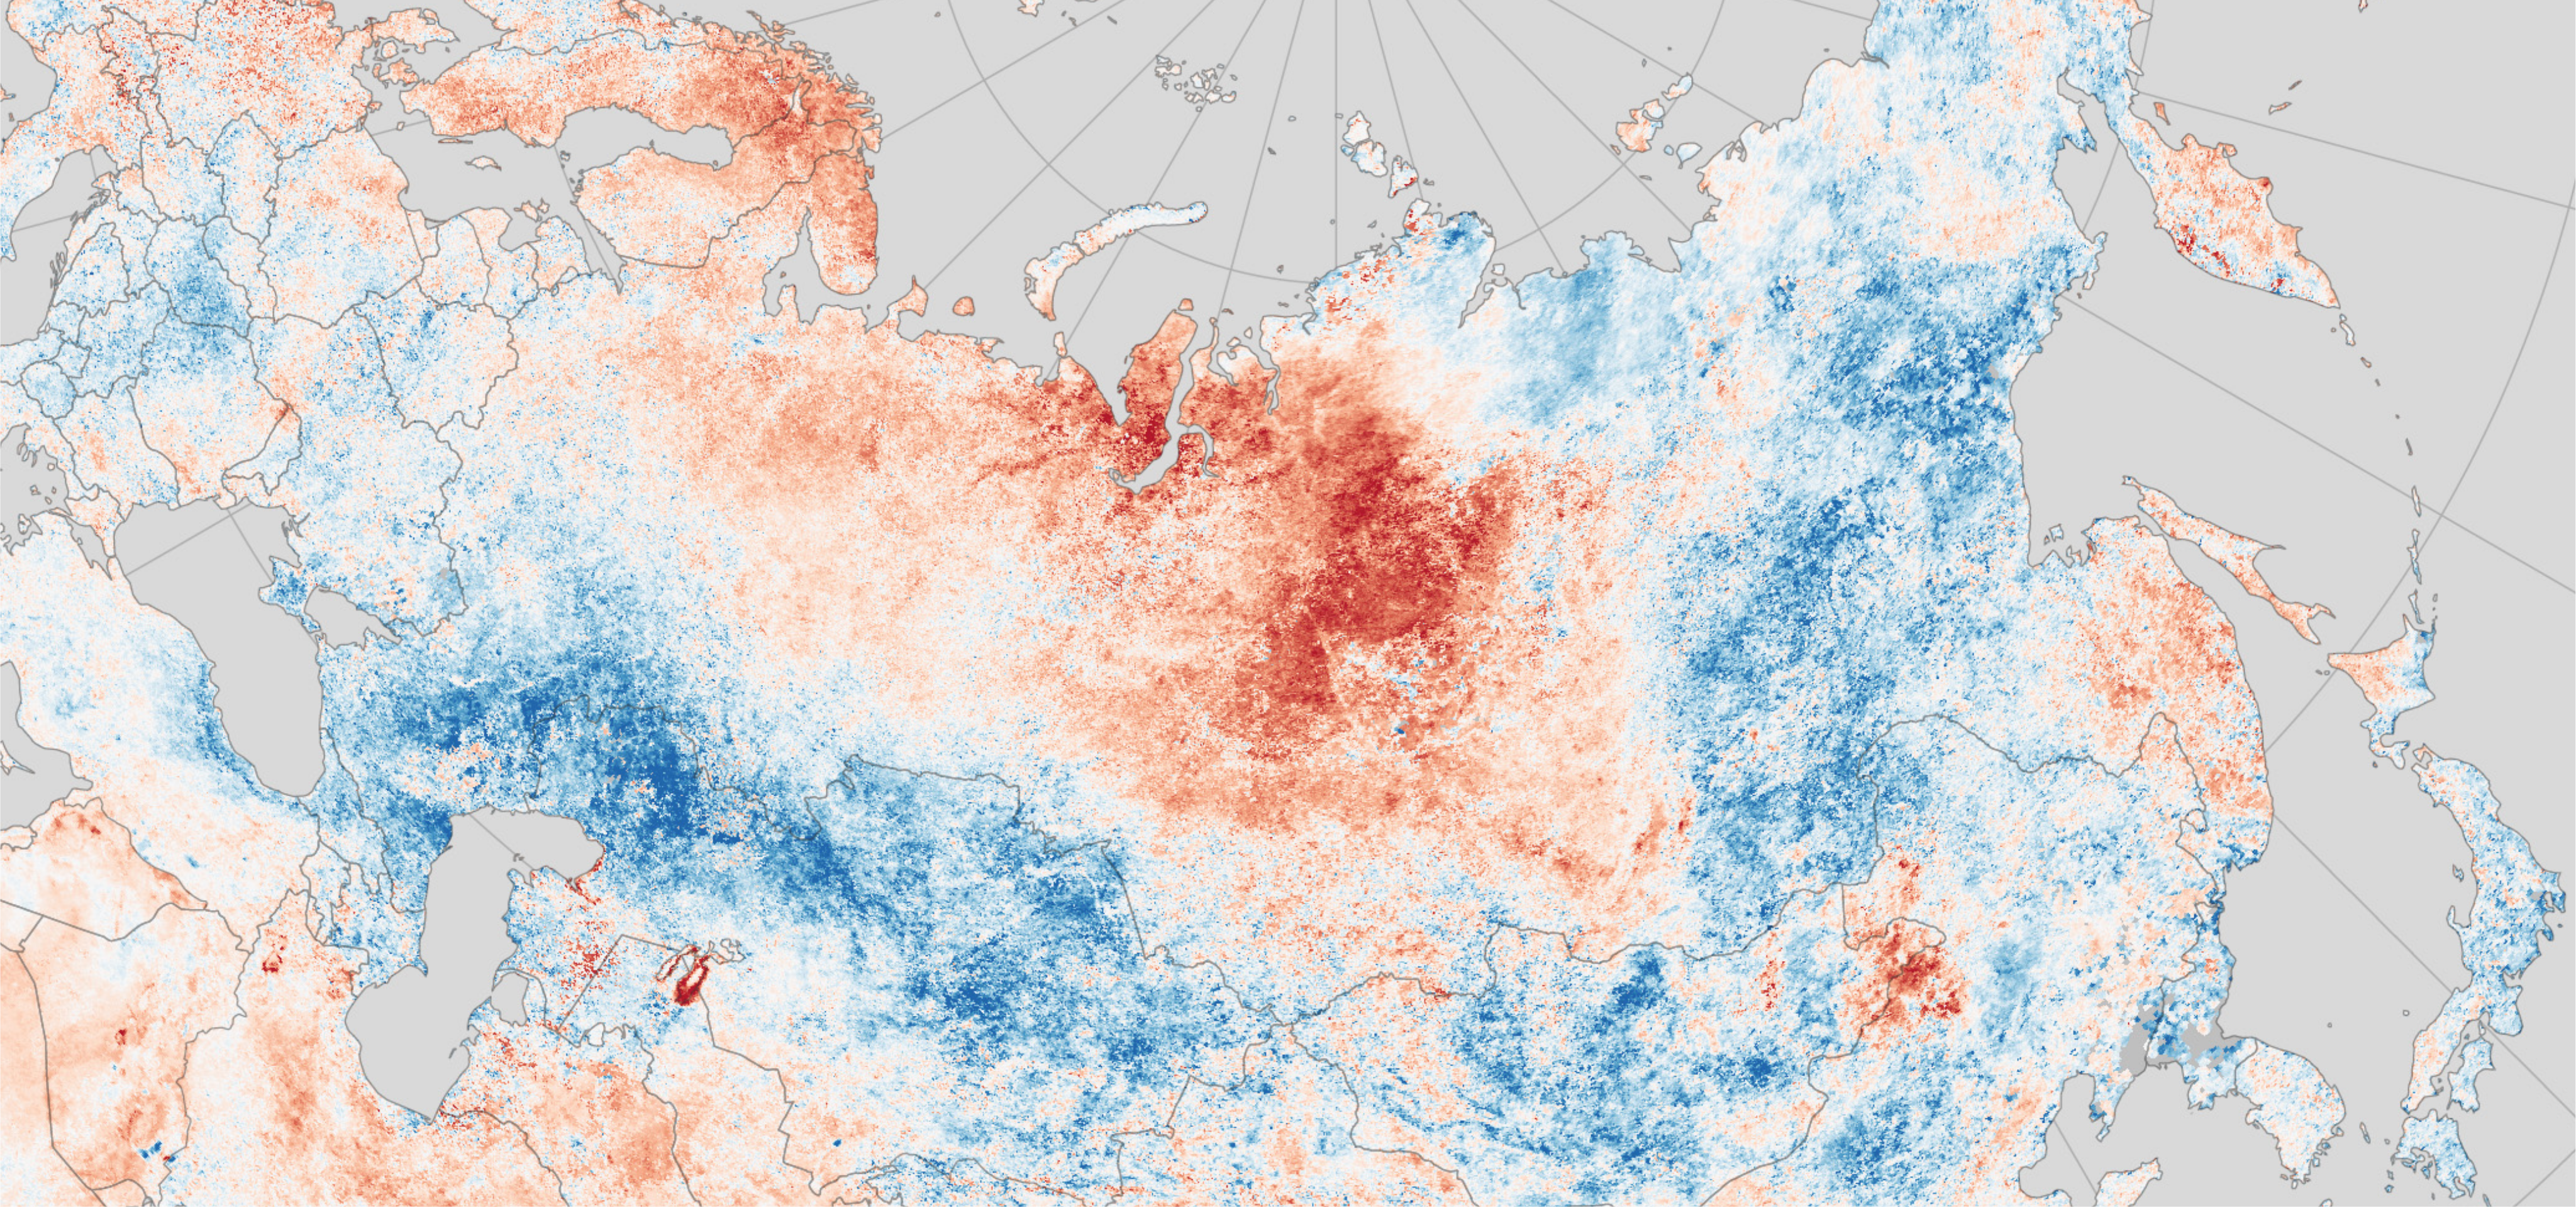
Figure \(\PageIndex{13}\): Color map showing land surface temperature anomalies from -12 °C (-21.6 °F) (darkest red) to + 12 °C (+21.6 °F) (darkest red) during the week of July 20-27, 1916. https://earthobservatory.nasa.gov/im...n-extreme-year
We also have to worry about emerging viruses that are released from the thawing of the tundra. Just as for the SARS-Covid-2 virus, we would have no immunity to these viruses. Figure \(\PageIndex{14}\) below shows EM pictures of new infectious viruses isolated from seven different ancient Siberian permafrost samples.
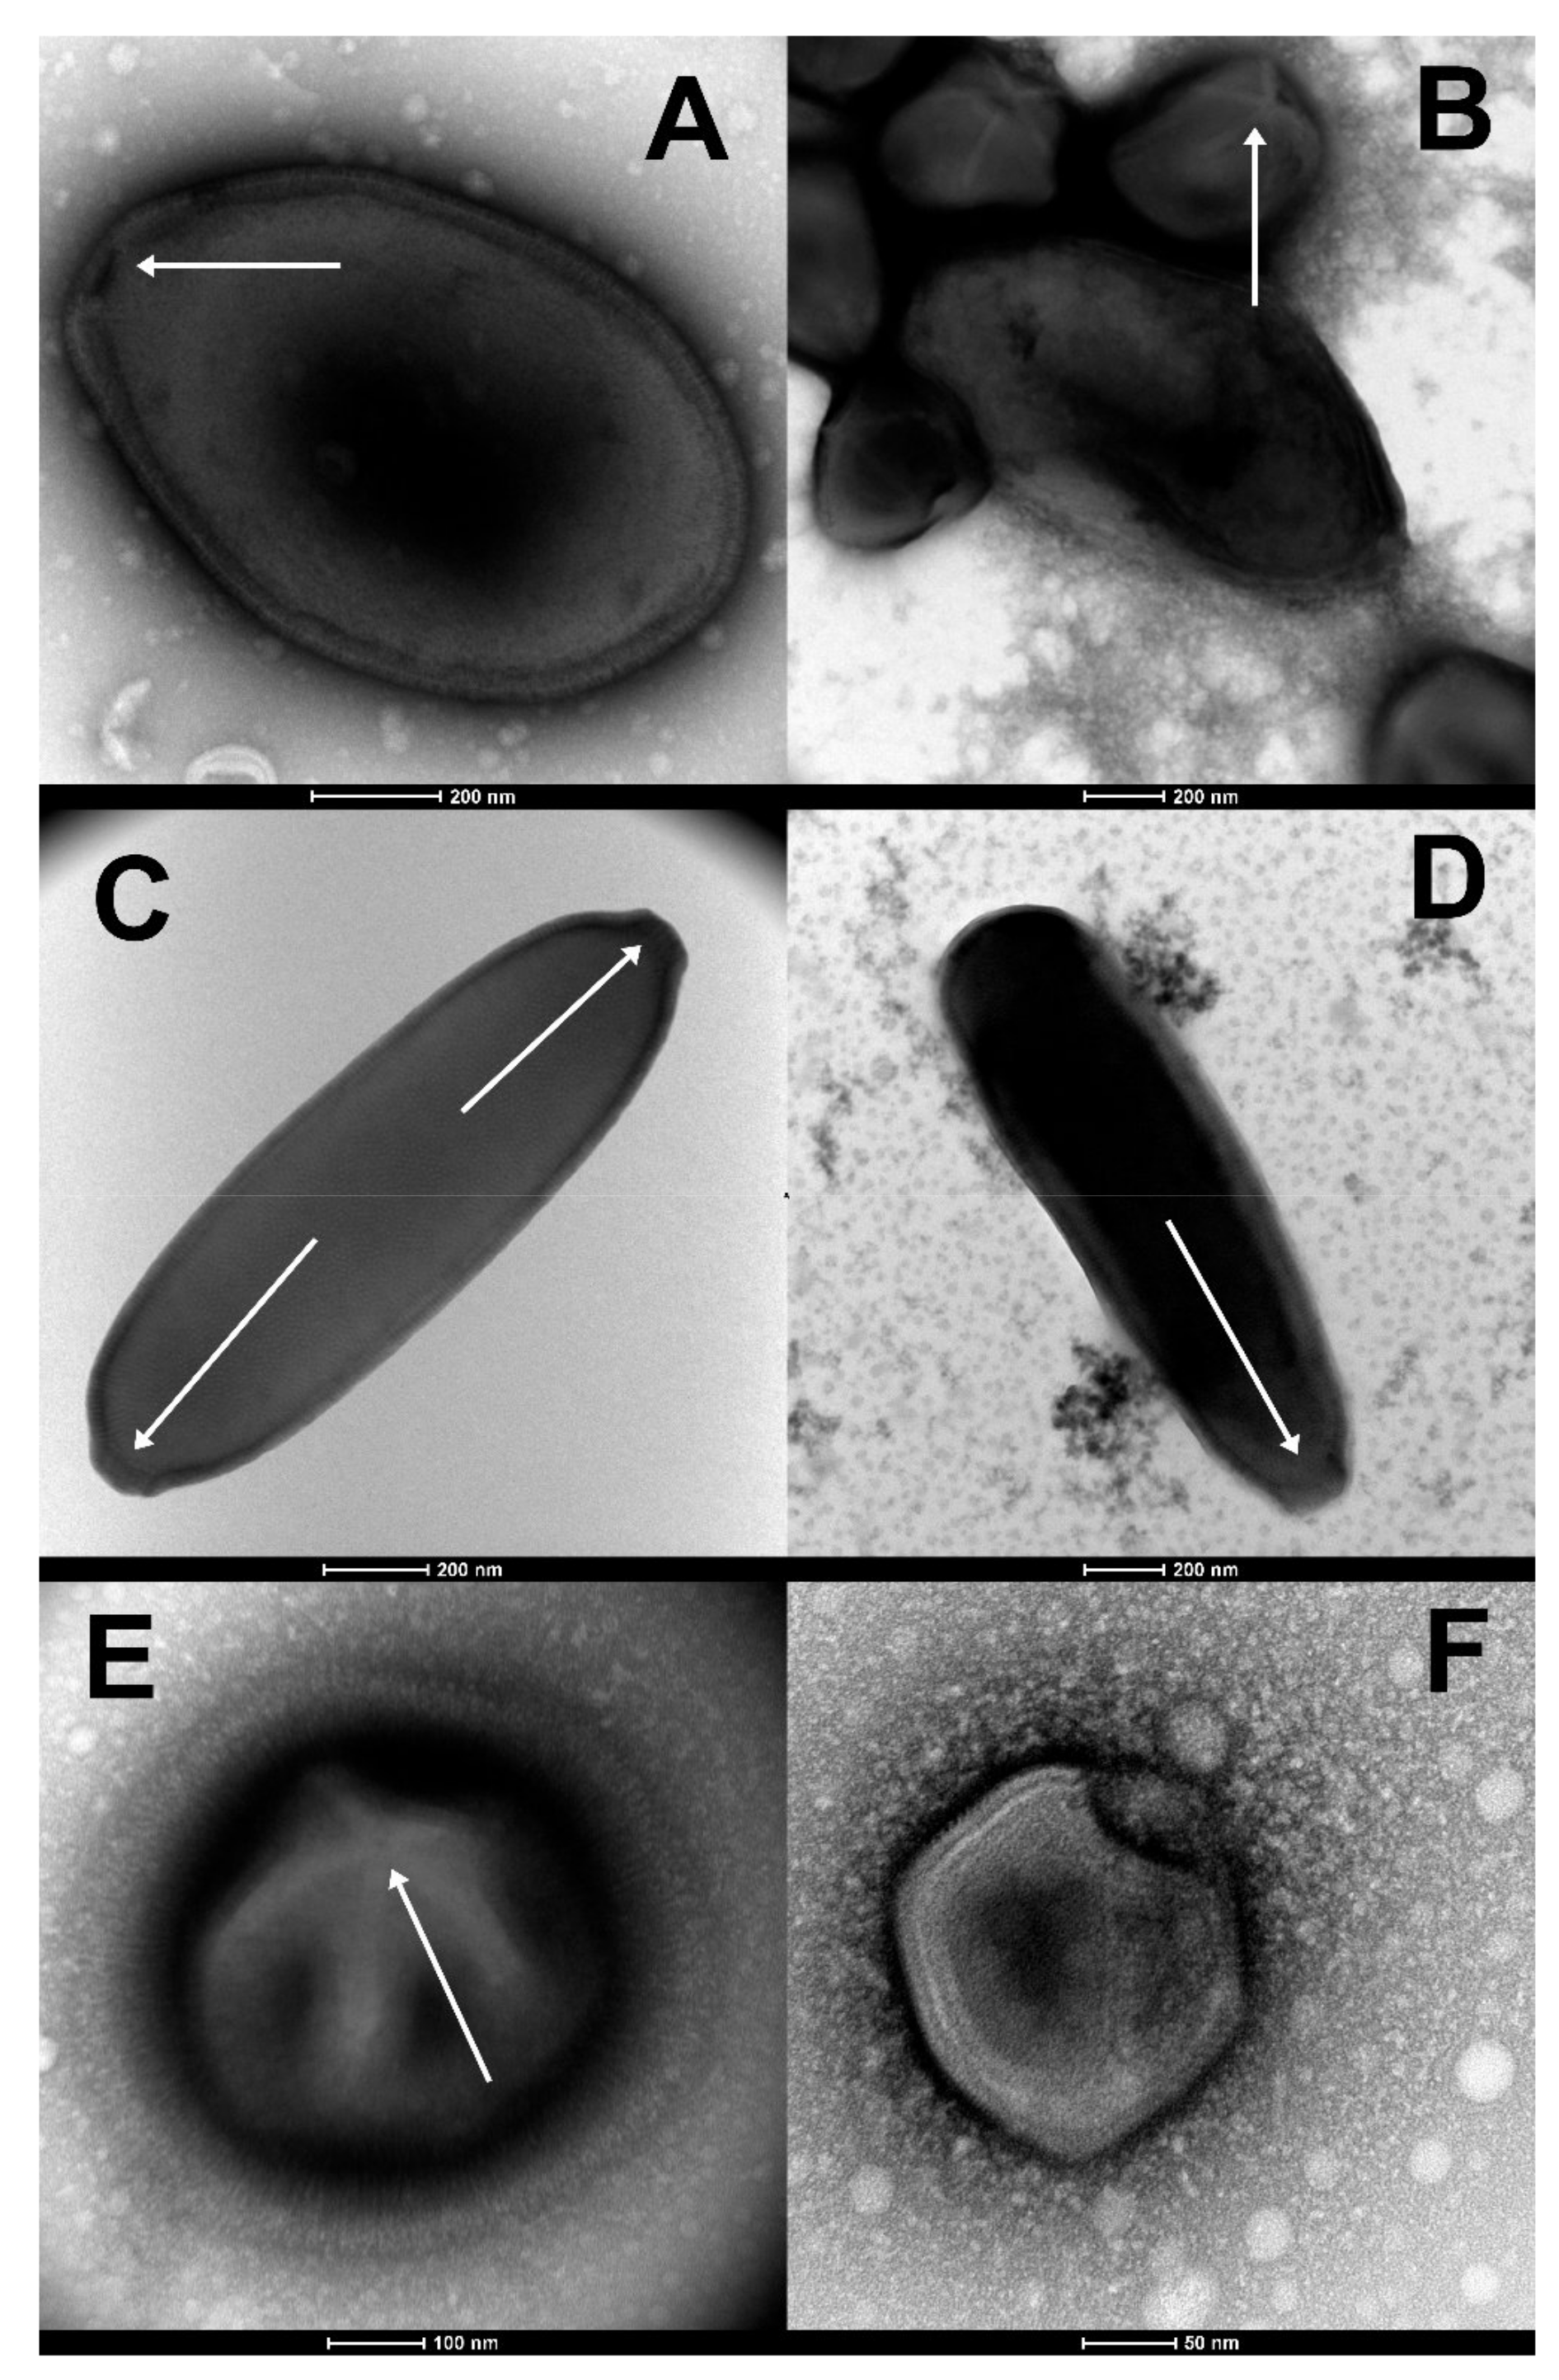
Figure \(\PageIndex{14}\): Morphological features guiding the preliminary identification of newly isolated viruses (negative staining, TEM). Alempic, J.-M.; Lartigue, A.; Goncharov, A.E.; Grosse, G.; Strauss, J.; Tikhonov, A.N.; Fedorov, A.N.; Poirot, O.; Legendre, M.; Santini, S.; et al. An Update on Eukaryotic Viruses Revived from Ancient Permafrost. Viruses 2023, 15, 564. https://doi.org/10.3390/v15020564. Creative Commons Attribution (CC BY) license (https://creativecommons.org/licenses/by/4.0/).
Panel (A) shows large ovoid particle (1000 nm in length) of Pandoravirus yedoma (strain Y2) ( showing the apex ostiole (white arrowhead) and the thick tegument characteristic of the Pandoraviridae family.
Panel (B) shows a mixture of Pandoravirus mammoth (strain Yana14) oblate particles and of Megavirus mammoth (strain Yana14) icosahedral particles exhibiting a “stargate” (white starfish-like structure crowning a vertex, white arrowhead)
Panel (C) shows the elongated particle of Cedratvirus lena (strain DY0) (1500 nm in length) exhibits two apex cork-like structures (white arrowheads)
Panel (D) shows the elongated particle of Pithovirus mammoth (1800 nm in length) exhibiting a single apex cork-like structure (white arrowhead).
Panel (E) shows the large (770 nm in diameter) “hairy” icosahedral particle of Megavirus mammoth (strain Yana14), showing the “stargate” (white arrowhead) characteristic of the Megavirinae subfamily
Panel (F) shows the smaller icosahedral particle (200 nm in diameter) of Pacmanvirus lupus (strain Tums2) typical of asfarviruses/pacmanviruses.
Fungal Diseases
We have concentrated solely on bacteria and viral epidemics/pandemics. We also have to consider fungal outbreaks that affect human health but also the foods that sustain us. We have few medicines that treat fungal infections and no vaccines, so any outbreaks could be quite serious. Most grow optimally between 12-30 0C (54-86 0F) so they don't adapt easily to warm blooded animals like humans. Nevertheless, global warming will increase their range and lead to increased thermal tolerance.
Candida auris: This was first found in 2009 in Japan as a cause of an ear infection. It is now found around the world.
Batrachochytrium dendrobatidis (Bd): This affects amphibians and has caused a high loss in amphibian diversity on all continents.
Cryptococcus deuterogattii:, This was typically found in more tropical/subtropical climates but now is also found in western Canada and the Pacific Northwest. It causes infections in people and animals.
Puccinia striiformis: This causes wheat rust which devastates crops and is now moving into warmer areas.
Fusarium graminearum: This causes diseases in wheat and other food crops, especially in warm and wet conditions.
Coccidioides immitis: This fungus, which grows in desert soil, can also spread through severe dust storms that cause fungal spores to be blown over wide regions. An example is the dispersal of Coccidioides immitis from Bakersfield, where it was endemic, to Sacramento County, where it wasn't, in 1977. Another example is Apophysomyces trapeziformis, which caused disease in 2011 in Joplin, Missouri after a tornado. The fungus actively thrives in wet soils but forms spores in dry conditions These spores can last for decades and cause disease when blown into the air and inhaled. They are associated with a condition called Valley Fever which affects farm workers who spend much time outside. Latino, Asian, and Native American people get Valley Fever at 2-4 times the rate of others.
Bats, Viruses, and Climate Change
We have seen that new infectious diseases arise from pathogen jumps to humans from other species. The more distant the species, the more unlikely humans have encountered the disease and the more likely it could cause severe illness and pandemics. A clear example is the avian flu that led to the 1918 flu pandemic. Yet we also have to worry about zoonoses from pathogen transfer from mammals, including rodents, bats, moles, shrews, monkeys, pigs, camels (a host of the deadly MERS virus), whales, cats, dogs, and seals (a likely source of the original TB virus).
Bats are a key source of zoonotic disease, including Middle East respiratory syndrome (MERS), which has a death rate of around 35%. Bats are the source of the Covid virus MERS-CoV which causes MERS. The virus spreads to people from camels. Severe acute respiratory syndrome (SARS) is another coronaviral disease, caused by the called SARS-associated coronavirus (SARS-CoV) which emerged in China in 2003. It had a death rate of around 12% but it was much higher in older people. Neither of these became lengthy full-blown pandemic, as with the SARS-CoV2 virus, the cause of the COVID-19 pandemic. In addition, viruses from bats include rabies, Ebola, and Marburg viruses, as well as the Nipah and Hendra viruses. Bats are more likely to be infected with zoonotic viruses than rodents.
Why are bat viruses so key in our worst zoonotic diseases? Two features are important. The same viruses that are so virulent to humans do not kill bats. A clue as to the special nature of bats is that they are the only flying mammals. What might protect bats from their own viruses is that their core temperatures are quite elevated during flight, which requires a high metabolic rate. These high temperatures likely prevent these viruses from harming bats but also make the viruses immune to the high-temperature fevers accompanying infection in humans. The average core temperature of flying bats derived from a variety of species was 39.6 0C or 103.3 0F. Many pathogens replicate optimally at temperatures less than normal body temperature.
Fevers in humans are regulated by the hypothalamus, mainly through prostaglandin E2 (PGE2). This response is part of the innate immune response and is elicited by most pathogens. PGE2 binds to the E-prostanoid-3 receptor (EP3), a G protein-coupled receptor in the hypothalmus, which determines the "set point" for body temperature. Hypothalmic PGE2 is produced from the endocannabinoid 2-arachidonylglycerol by the action of monoacylglycerol lipase, at least in mice stimulated with a bacterial cell wall component (LPS), that stimulates fever production.
Figure \(\PageIndex{15}\) shows an interactive iCn3D model of the human prostaglandin E receptor EP3 bound to prostaglandin E2 (6AK3).
.png?revision=1&size=bestfit&width=464&height=380)
Figure \(\PageIndex{15}\): Human prostaglandin E receptor EP3 bound to prostaglandin E2 (6AK3).. (Copyright; author via source). Click the image for a popup or use this external link: https://structure.ncbi.nlm.nih.gov/i...cCgTGEKu3KoGx9
The model shows a dimer of two, GPCRs each bound to 1 PGE2.
Research suggests that bats have also evolved to have a lower inflammatory response, mediated by the inflammasome (discussed in detail in Chapter 5.4). Here is a short review of the inflammasome modified from that chapter section. It's needed to give readers a more biochemical explanation for immunosuppression in bat cells, a topic critical to understand the role of bats in present and future pandemics.
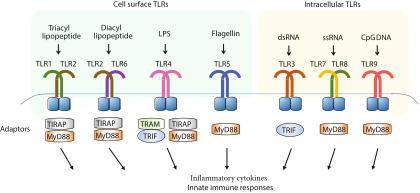
The inflammasome, part of the innate immune system, is activated by a plethora of pathogens or damaged host molecules. Our innate system immune cells (dendritic cells, macrophages, eosinophils, etc) have receptors that recognize common pathogen-associated molecular patterns (PAMPs) such as lipopolysaccharides (LPS) on the surface of bacteria, mannose on bacteria, and yeast, flagellin from bacterial flagella, dsRNA (from viruses) and nonmethylated CpG motifs in bacterial DNA. These antigens are recognized by pattern recognition receptors (PRRs) - specifically the Toll-like Receptors (TLRs) 1-10. These include plasma membrane TLRs (TL4 for LPS, TL5 for flagellin, TLR 1, 2 and 6 for membrane and wall components of fungi and bacteria) and intracellular endosomal TLRs (TLR3 for dsRNA, TLR 7 and 8 for ssRNA and TLR9 for dsDNA).
Figure \(\PageIndex{16}\) shows the TLR family, their binding signals, and intracellular adapter proteins used to transmit signals into the cell.
Inflammasomes are also activated by Damage-associated molecular patterns (DAMPs). These are typically found on molecules released from the cell or intracellular compartments on cellular damage (hence the name DAMP). Many are nuclear or cytoplasmic proteins released from the cells. These would now find themselves in a more oxidizing environment which would further change their properties. Common DAMP proteins include heat shock proteins, histones and high mobility group proteins (both nuclear), and cytoskeletal proteins. Here are some other common non-protein DAMPS that can be released on cellular damage: ATP, uric acid, heparin sulfate, DNA, and cholesterol crystals. In the wrong location, these can be considered danger signals. They are sometimes referred to as "sterile" signals.
If TLRs recognize PAMPs, what recognizes DAMPs? They are recognized by another type of intracellular pattern recognition receptor (PRR) called NOD (Nucleotide-binding Oligomerization Domain (NOD)- Like Receptors or NLRs. NLRs also recognize PAMPs. The abbreviation NLR also comes from the Nucleotide-binding domain (NBD) and Leucine-Rich repeat (LRR)–containing proteins (NLR)s. This family of proteins participates in the formation of a large protein structure called the inflammasome. (Sorry about the multiple abbreviations and naming systems!)
As both PAMPs and DAMPs pose dangers, it would make sense that once they recognize their cognate PRRs (TLRs and NLRs, respectively), pathways leading from the occupied receptors might converge in a common effector system for the release of inflammatory cytokines from immune cells. Given that uncontrolled immune effector release from cells in an inflammatory response might be dangerous, it would be sometimes helpful to require two signals to trigger cytokine release from the cell.
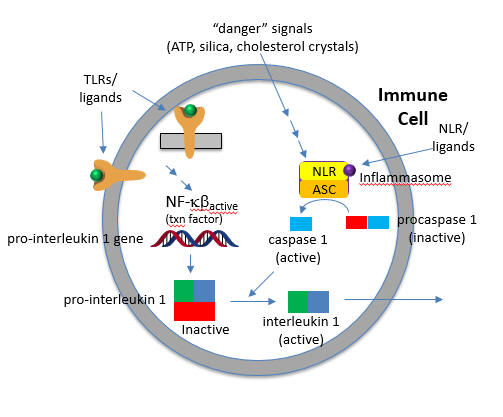
Two such inflammatory cytokines are Interleukin 1-β (IL 1-β) and IL-18. Activation of TLRs by a PAMP leads to activation of a potent immune cell transcription factor, NF-kbeta, which leads to transcription of the gene for the precursor of the cytokine, pro-interleukin 1-β. Without a specific proteolytic cleavage, the active cytokine will not be released from the cell.
The protease required for this cleavage is activated by a signal arising when a DAMP activates a NLR, which then through a sequence of interactions leads to the proteolytic activation of another inactive protease, procaspase 1, on the inflammasome. The activated inflammasome activates procaspase to produce the active protein caspase (a cysteine-aspartic protease).
The convergence of the signals from the PAMP activation of a TLR and DAMP activation of a NLD at the inflammasome is shown in Figure \(\PageIndex{17}\).
The active cytokine interleukin 1-β helps recruit innate immune cells to the site of infection. It also affects the activity of immune cells in the adaptive immune response (T and B cels). Active IL-18 leads to the increase of another cytokine, interferon-gamma and it also increases the activity of T cells that kill other cells.
Figure \(\PageIndex{18}\) shows an interactive iCn3D model of the NLRP3 double-ring cage, 6-fold (12-mer) (7LFH)
_(7LFH).png?revision=1)
Figure \(\PageIndex{18}\): NLRP3 double-ring cage, 6-fold (12-mer) (7LFH). (Copyright; author via source). Click the image for a popup or use this external link: https://structure.ncbi.nlm.nih.gov/icn3d/share.html?DEbdkUoBtqRQ9bu59
The full-length mouse NLRP3 consists of 12- to 16-mer organized in a double-ring cage. It is held together by interactions between the leucine-rich repeats (LRR) domains. The pyrin domains are shielded by the structure, so they will not be activated without appropriate signals. The complex is also localized to the membrane. NLRP3 inflammasomes seem to be activated by cellular distress as well as cell exposure to pathogens. It is one of the main responders to a variety of microbial infections.
In summary, two signals are again needed:
Signal 1
The first signals are the bacterial and viral (influenza virus, poliovirus, enterovirus, rhinovirus, human respiratory syncytial virus, etc) PAMPs, which bind to TLRs and lead to the activation of the NFkb transcription factor. This activates not only the transcription of pro-interleukin 1-β and interleukin 18, but also the transcription of the NLRP3 sensor itself.
Signal 2
Signal 2 is delivered by PAMPs and DAMPs indirectly to the sensor NLRP3. This leads to the assembly of the inflammasome. These DAMPs appear to prime the activation of NLRP3 protein and subsequent formation of the active NLRP3 inflammasome. But what activates NLR3P3? After many studies, it became clear that the typical bacterial ligands that would activate TLRs and perhaps NLRs only prime NLRP3 for activation. They don't bind to it directly.
Extracellular ATP is a major activator of NLRP3. Nanoparticles are known to release ATP as well. Most studies show that K+ efflux from the cell is an early signal.
Back to Bats
To survive the viruses they harbor, bats decrease their inflammatory response upstream at the level of PAMP and DAMP recognition, as well as downstream at the level of caspase-1 inhibition. In addition, additional cleavage sites in IL-1β cause its loss through proteolysis. These events decreased inflammasome signaling. That multiple steps are inhibited suggests that they have been selected through evolutionary pressures.
The activation of the bat NLRP3 inflammasome by a "sterile" agent (ATP), as well as 3 RNA viruses is significantly decreased in bat cells compared to responses to these signals in humans and mice cells. The viruses include:
- H1N1 influenza A virus (a negative-sense single-stranded RNA virus known to activate the NLRP3 inflammasome);
- the Melaka virus (a bat-borne zoonotic double-stranded RNA virus);
- MERS-CoV (a positive-sense (+) ssRNA zoonotic virus).
Even though the secretion of interleukin-1β is inhibited in bat cells, viral loads remained high in virally-infected bat cells. The altered NLRP3 activation in bat cells occurs in part through decreasing RNA splicing and an altered LRR domain in NLRP3.
It should be clear that if bat population increases or if they move to new habitats, both events which could be promoted by climate change, humans are at greater risks for bat-derived pandemics. Coronaviruses, with over 3000 species, make up about 1/3 of the bat's viral load. The region comprising southern Yunan (in China, Myanmar and Laos have very high populations of bats and it is from these areas that new bat zoonoses are likely to derive. Models of past climate (in the 1900s) and bat species richness compared to present climatic conditions, along with the knowledge of specific climate conditions necessary to support bat population and diversity, show that the greatest increase in bat species population in the 20th century occurred in SE Asia. Less important sites included regions in Central Africa and some pockets of Central and South America. The region in China, Myanmar, and Laos is likely the location for the origin of the SAR-CoV1 and SARS-CoV2 viruses.