

13.1: Glycolysis
- Page ID
- 15004


\( \newcommand{\vecs}[1]{\overset { \scriptstyle \rightharpoonup} {\mathbf{#1}} } \)
\( \newcommand{\vecd}[1]{\overset{-\!-\!\rightharpoonup}{\vphantom{a}\smash {#1}}} \)
\( \newcommand{\id}{\mathrm{id}}\) \( \newcommand{\Span}{\mathrm{span}}\)
( \newcommand{\kernel}{\mathrm{null}\,}\) \( \newcommand{\range}{\mathrm{range}\,}\)
\( \newcommand{\RealPart}{\mathrm{Re}}\) \( \newcommand{\ImaginaryPart}{\mathrm{Im}}\)
\( \newcommand{\Argument}{\mathrm{Arg}}\) \( \newcommand{\norm}[1]{\| #1 \|}\)
\( \newcommand{\inner}[2]{\langle #1, #2 \rangle}\)
\( \newcommand{\Span}{\mathrm{span}}\)
\( \newcommand{\id}{\mathrm{id}}\)
\( \newcommand{\Span}{\mathrm{span}}\)
\( \newcommand{\kernel}{\mathrm{null}\,}\)
\( \newcommand{\range}{\mathrm{range}\,}\)
\( \newcommand{\RealPart}{\mathrm{Re}}\)
\( \newcommand{\ImaginaryPart}{\mathrm{Im}}\)
\( \newcommand{\Argument}{\mathrm{Arg}}\)
\( \newcommand{\norm}[1]{\| #1 \|}\)
\( \newcommand{\inner}[2]{\langle #1, #2 \rangle}\)
\( \newcommand{\Span}{\mathrm{span}}\) \( \newcommand{\AA}{\unicode[.8,0]{x212B}}\)
\( \newcommand{\vectorA}[1]{\vec{#1}} % arrow\)
\( \newcommand{\vectorAt}[1]{\vec{\text{#1}}} % arrow\)
\( \newcommand{\vectorB}[1]{\overset { \scriptstyle \rightharpoonup} {\mathbf{#1}} } \)
\( \newcommand{\vectorC}[1]{\textbf{#1}} \)
\( \newcommand{\vectorD}[1]{\overrightarrow{#1}} \)
\( \newcommand{\vectorDt}[1]{\overrightarrow{\text{#1}}} \)
\( \newcommand{\vectE}[1]{\overset{-\!-\!\rightharpoonup}{\vphantom{a}\smash{\mathbf {#1}}}} \)
\( \newcommand{\vecs}[1]{\overset { \scriptstyle \rightharpoonup} {\mathbf{#1}} } \)
\( \newcommand{\vecd}[1]{\overset{-\!-\!\rightharpoonup}{\vphantom{a}\smash {#1}}} \)
\(\newcommand{\avec}{\mathbf a}\) \(\newcommand{\bvec}{\mathbf b}\) \(\newcommand{\cvec}{\mathbf c}\) \(\newcommand{\dvec}{\mathbf d}\) \(\newcommand{\dtil}{\widetilde{\mathbf d}}\) \(\newcommand{\evec}{\mathbf e}\) \(\newcommand{\fvec}{\mathbf f}\) \(\newcommand{\nvec}{\mathbf n}\) \(\newcommand{\pvec}{\mathbf p}\) \(\newcommand{\qvec}{\mathbf q}\) \(\newcommand{\svec}{\mathbf s}\) \(\newcommand{\tvec}{\mathbf t}\) \(\newcommand{\uvec}{\mathbf u}\) \(\newcommand{\vvec}{\mathbf v}\) \(\newcommand{\wvec}{\mathbf w}\) \(\newcommand{\xvec}{\mathbf x}\) \(\newcommand{\yvec}{\mathbf y}\) \(\newcommand{\zvec}{\mathbf z}\) \(\newcommand{\rvec}{\mathbf r}\) \(\newcommand{\mvec}{\mathbf m}\) \(\newcommand{\zerovec}{\mathbf 0}\) \(\newcommand{\onevec}{\mathbf 1}\) \(\newcommand{\real}{\mathbb R}\) \(\newcommand{\twovec}[2]{\left[\begin{array}{r}#1 \\ #2 \end{array}\right]}\) \(\newcommand{\ctwovec}[2]{\left[\begin{array}{c}#1 \\ #2 \end{array}\right]}\) \(\newcommand{\threevec}[3]{\left[\begin{array}{r}#1 \\ #2 \\ #3 \end{array}\right]}\) \(\newcommand{\cthreevec}[3]{\left[\begin{array}{c}#1 \\ #2 \\ #3 \end{array}\right]}\) \(\newcommand{\fourvec}[4]{\left[\begin{array}{r}#1 \\ #2 \\ #3 \\ #4 \end{array}\right]}\) \(\newcommand{\cfourvec}[4]{\left[\begin{array}{c}#1 \\ #2 \\ #3 \\ #4 \end{array}\right]}\) \(\newcommand{\fivevec}[5]{\left[\begin{array}{r}#1 \\ #2 \\ #3 \\ #4 \\ #5 \\ \end{array}\right]}\) \(\newcommand{\cfivevec}[5]{\left[\begin{array}{c}#1 \\ #2 \\ #3 \\ #4 \\ #5 \\ \end{array}\right]}\) \(\newcommand{\mattwo}[4]{\left[\begin{array}{rr}#1 \amp #2 \\ #3 \amp #4 \\ \end{array}\right]}\) \(\newcommand{\laspan}[1]{\text{Span}\{#1\}}\) \(\newcommand{\bcal}{\cal B}\) \(\newcommand{\ccal}{\cal C}\) \(\newcommand{\scal}{\cal S}\) \(\newcommand{\wcal}{\cal W}\) \(\newcommand{\ecal}{\cal E}\) \(\newcommand{\coords}[2]{\left\{#1\right\}_{#2}}\) \(\newcommand{\gray}[1]{\color{gray}{#1}}\) \(\newcommand{\lgray}[1]{\color{lightgray}{#1}}\) \(\newcommand{\rank}{\operatorname{rank}}\) \(\newcommand{\row}{\text{Row}}\) \(\newcommand{\col}{\text{Col}}\) \(\renewcommand{\row}{\text{Row}}\) \(\newcommand{\nul}{\text{Nul}}\) \(\newcommand{\var}{\text{Var}}\) \(\newcommand{\corr}{\text{corr}}\) \(\newcommand{\len}[1]{\left|#1\right|}\) \(\newcommand{\bbar}{\overline{\bvec}}\) \(\newcommand{\bhat}{\widehat{\bvec}}\) \(\newcommand{\bperp}{\bvec^\perp}\) \(\newcommand{\xhat}{\widehat{\xvec}}\) \(\newcommand{\vhat}{\widehat{\vvec}}\) \(\newcommand{\uhat}{\widehat{\uvec}}\) \(\newcommand{\what}{\widehat{\wvec}}\) \(\newcommand{\Sighat}{\widehat{\Sigma}}\) \(\newcommand{\lt}{<}\) \(\newcommand{\gt}{>}\) \(\newcommand{\amp}{&}\) \(\definecolor{fillinmathshade}{gray}{0.9}\)Introduction
In this chapter, we will provide you with a historical overview of glycolysis and introduce you to the 10 enzymatic reactions in the pathway. Our main goal is to understand how the oxidation of our major food molecules, sugars in the case of glycolysis, can lead to ATP synthesis.
Before we begin our journey into the glycolytic pathway, it is useful to review the concept of free energy within reactions. For a reaction to be spontaneous, the change in the free energy within the system must be negative. From the equation in Figure \(\PageIndex{1}\) you can see that the change in free energy of a reaction is dependent on the concentration of the reactants and the products, as well as the temperature within the system.
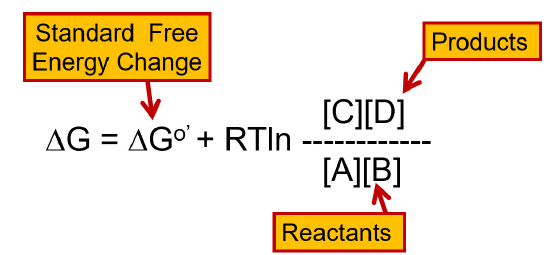
You will note that some reactions of glycolysis and other metabolic pathways that we will investigate are not favored. Thus, it is necessary to drive the reaction to become spontaneous by either coupling the reaction with a spontaneous reaction that can generate enough free energy to drive the nonspontaneous reaction forward, or by using Le Chatelier’s principle and removing the products from the enzyme’s area as soon as they are made. This will help drive the reaction in the forward direction as it will reestablish equilibrium. In this way, a small amount of product can be formed spontaneously. Essentially, the continued removal of the product or the addition of excess reactant will drive the reaction forward. It is of note that the temperature of the reaction can also influence the change in free energy. However, in biological systems, temperature changes that will significantly affect the change in free energy usually are not compatible with maintaining most life forms. Thus, it will not be a large consideration in the context of our metabolic discussions, here.
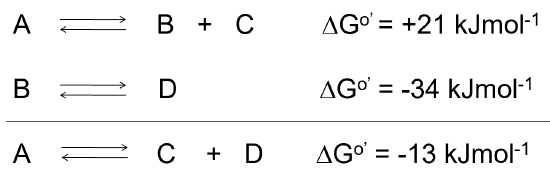
When reactions are coupled together to obtain a spontaneous reaction, the overall free energy change for a chemically coupled series of reactions is equal to the sum of the free energy changes of the individual steps, as noted in Figure \(\PageIndex{2}\).
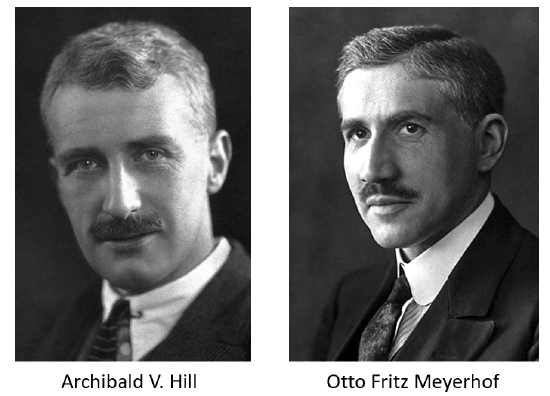
The metabolic reactions of carbohydrates and other food molecules play an important role in generating energy within living systems in the form of ATP. For carbohydrates, this begins with the metabolic process known as glycolysis (or the breakdown, "lysis", of sugars, "glyco") At the end of the 1910s Otto Meyerhof mapped some of these metabolic conversions by measuring heat trends and oxygen consumption in frog muscles. When the muscle is working, lactic acid is formed from carbohydrates, and Otto Meyerhof showed that during recovery, this is followed partly by the burning of lactic acid and partly by reprocessing of lactic acid to carbohydrates.
Concurrently, Archibald Hill was also outlining these processes in the muscles of frogs. In opposition to the prevailing view that mechanical movement and chemical processes were parallel sequences, Hill was able to show through measurements of heat generated by the mechanical processes that these were delayed compared to the movements. The chemical sequence consists of a work phase, which is not dependent on oxygen supply, and a recovery phase when oxygen is required. Together, their work has opened the door to understanding aerobic and anaerobic metabolism beginning with the process of glycolysis. They both shared the Nobel Prize in Physiology and Medicine in 1922 for their work in these processes Figure \(\PageIndex{3}\).
The glycolytic pathway consists of 10 enzymatic steps that convert glucose to pyruvate. This conversion generates a small amount of energy. The pyruvate can then be converted to lactic acid (lactate) in vertebrates or to ethanol in yeast in an anaerobic (or oxygen-independent) pathway or it can be fully oxidized to carbon dioxide in an aerobic (or oxygen-requiring) pathway that takes place within the mitochondria (which is shown in green in Figure \(\PageIndex{4}\): ). Aerobic oxidation yields about 18 times as much energy as the anaerobic pathways causing them to be favored over anaerobic pathways. Most animal tissues can only survive short anaerobic bursts that occur in isolation and don’t involve the entire organism. The aerobic pathway is required to sustain life. Yeast also prefers to grow using the aerobic, mitochondrial pathway. However, if oxygen is unavailable, yeast and other fungi can switch to anaerobic growth and produce ethanol as a byproduct. The production of alcoholic beverages through this fermentation process is quite popular.
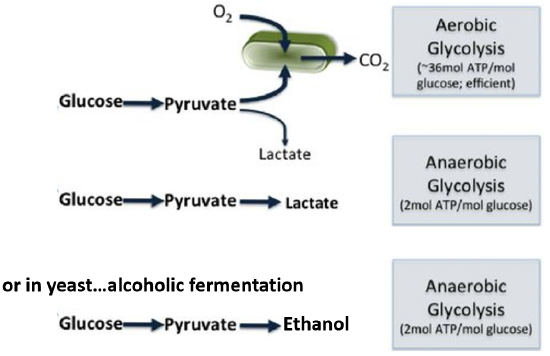
Figure \(\PageIndex{5}\) provides a summary of the glycolytic pathway coupled to the oxidative phosphorylation pathway that occurs within the mitochondria.
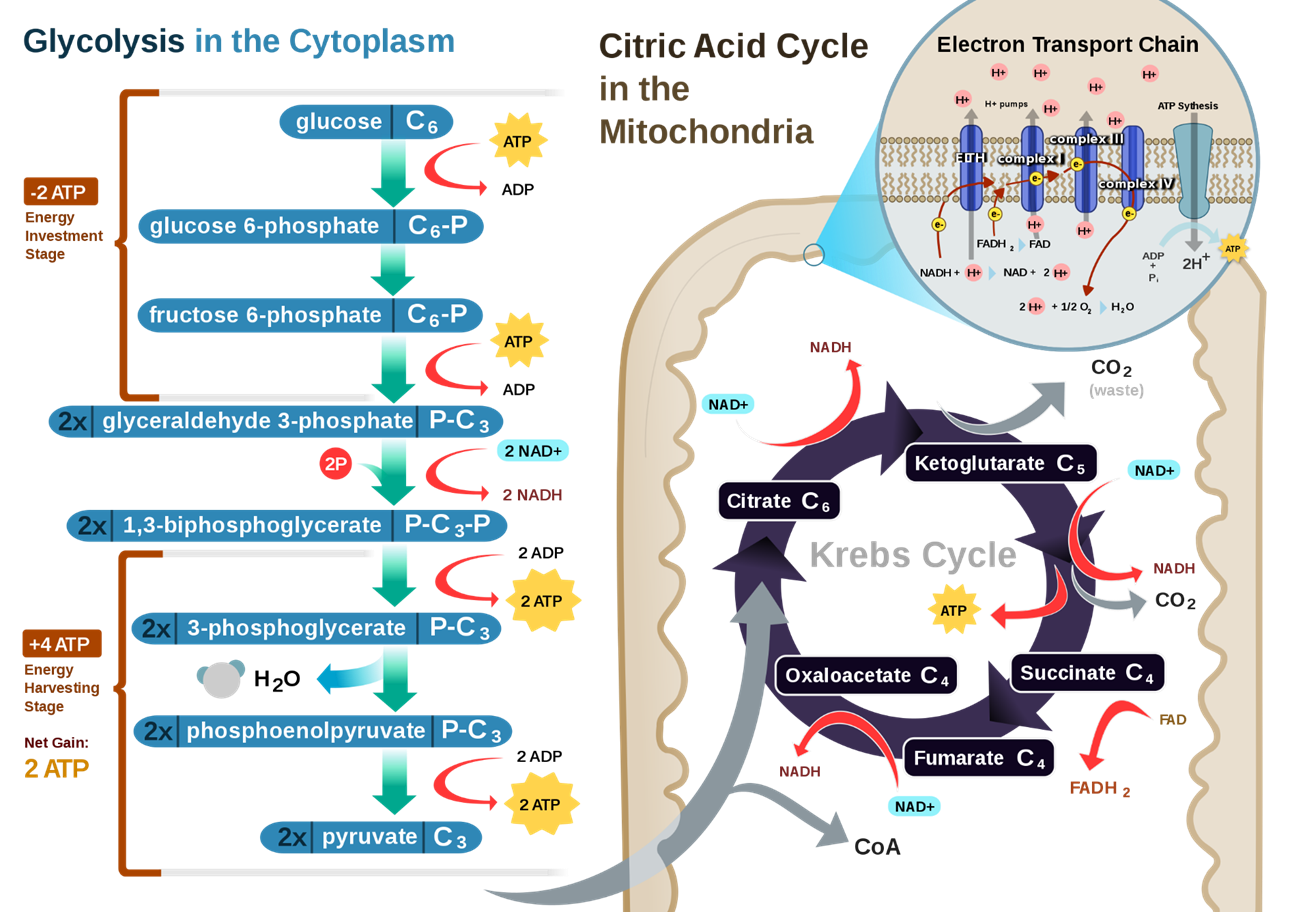
Figure \(\PageIndex{5}\): A Summary of the Glycolytic and Oxidative Phosphorylation Pathways. The glycolytic pathway is shown on the left-hand side in blue. During aerobic metabolism, pyruvate would be converted to acetyl-CoA which then enters the Kreb cycle within the matrix of the mitochondria. Future chapters will focus on the reactions inside the mitochondria. Our focus in this chapter will be on the cytosolic reactions of the glycolytic pathway.
The major reactions of glycolysis are shown in Figure \(\PageIndex{6}\). The pathway can be broken down into two major sections: (1) the energy-consuming reactions and the (2) the energy-generating reactions. An adage states that ‘It takes money to make money’. The same can be thought about the glycolytic pathway. The first section requires an investment of energy to generate energy in the second half of the reaction pathway. In this pathway, glucose, a 6-carbon hexose, is converted to two, 3C molecules - pyruvate. Note that Figure \(\PageIndex{6}\) shows the entire pathway using Lewis wedge/dash representations plus the anaerobic conversion of pyruvate to lactate.
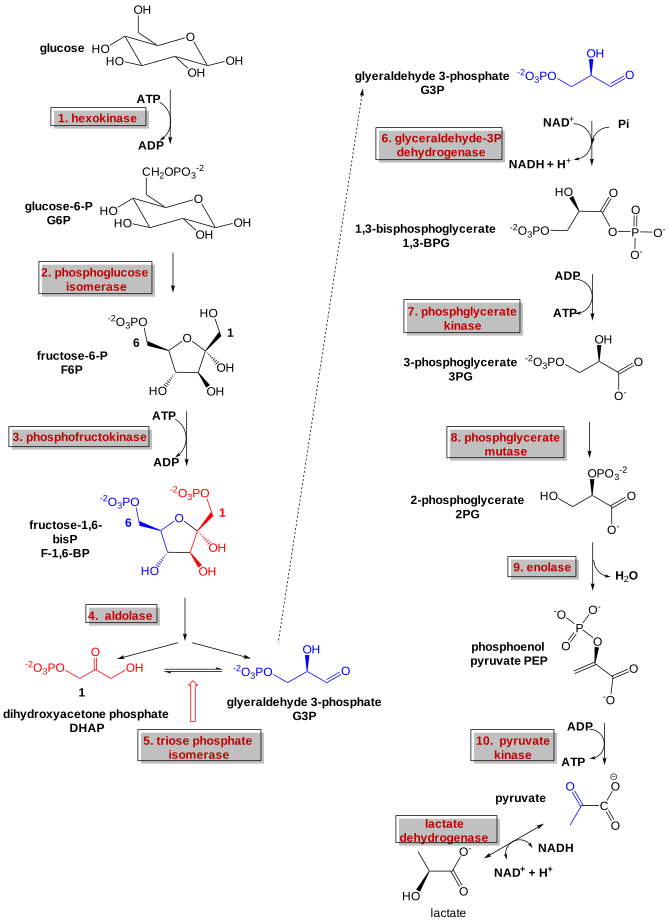
Figure \(\PageIndex{6}\): Glycolytic pathway. The chemical steps of the glycolytic pathway are shown using Lewis wedge/dash representations. Enzymes required at each step are labeled in red. The energy-consuming steps encompass reactions 1 - 3, whereas the energy-producing steps occur in the second half of the pathway from reactions 4 - 10. The conversion of pyruvate to lactate by lactate dehydrogenase represents anaerobic respiration as it occurs within mammalian species.
Glycolysis is the key anaerobic pathway for energy products in all organisms, except in lithotropes that use the oxidation of inorganic molecules for energy production. In aerobic systems, glycolysis provides the release of fast energy within the body as glycogen metabolism can quickly release free glucose for utilization. Given the centrality of glycolysis to all of life, we will explore each of the reactions in detail below.
Reaction 1: Glucose → Glucose-6-Phosphate. ΔGo=-4.0 kcal/mol (-16.7 kJ/mol).
The first step in glycolysis is catalyzed by enzymes known as hexokinases. The hexokinase family enzymes typically have broad specificity for various hexoses and catalyze the phosphorylation of carbon 6. Hexokinase phosphorylates glucose using ATP as the source of the phosphate, producing glucose-6-phosphate, a more reactive form of glucose. Notably, this reaction prevents the phosphorylated glucose molecule from continuing to interact with the GLUT transport proteins that can shuttle glucose into and out of the cell. Thus, once glucose is phosphorylated it can no longer leave the cell. Do note that both of these sugar forms (the free sugar and the phosphorylated version) can shift back and forth between the ring-closed and ring-opened conformation. Hexokinases require glucose to be in the closed conformation for the phosphorylation reaction. Figure \(\PageIndex{7}\) shows the reaction which is catalyzed by hexokinase (a kinase that transfers the γ-phosphate from ATP to a hexose in the closed-ring form).
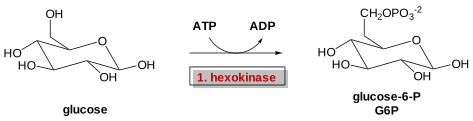
Figure \(\PageIndex{7}\) : Summary reaction - hexokinase
This reaction is a nucleophilic substitution reaction on the gamma phosphate of ATP. A phosphoanhydride bond is broken in ATP as a phosphoester bond is made producing glucose 6-phosphate. Hence the reaction proceeds with a negative ΔGo.
Vertebrates have 4 different types of hexokinases, I-IV (also called A-D). The regulation of these enzymes is presented in more detail in Chapter 15.5. Hexokinases I-III bind glucose more tightly as reflected by low KM values. Type IV or glucokinase binds it less tightly, and is found in high concentrations in vertebrate livers. Yeast has 3 isozymes, P1, PII or hexokinase B, and glucokinase. Most prokaryotic hexokinases are in the glucokinase (Type IV) class.
In addition to hexokinases, there are also many other different types of sugar kinase enzymes. Notably, all sugar kinases must prevent the spurious hydrolysis of ATP by water, which can also be considered a phosphotransfer to water, instead of the preferred transfer of the γ phosphate of ATP to a sugar ROH (alcohol), an "alcoholysis" reaction. Hexokinase does this through an "induced fit" mechanism, in which glucose binding triggers a large conformation change to close off the active site to water.
This conformational change is illustrated in Figure \(\PageIndex{8}\) below which shows an interactive iCn3D model of the yeast hexokinase PI in the absence (2YHX) and presence (3B8A) of glucose.
_and_presence_(3B8A)_of_glucose%25C2%25A0.png?revision=1&size=bestfit&width=429&height=311)
 Figure \(\PageIndex{8}\): Yeast hexokinase PI in the absence (2YHX) and presence (3B8A) of glucose. (Copyright; author via source). Click the image for a popup or use this external link: https://structure.ncbi.nlm.nih.gov/i...84YGEd1ob3th7A
Within Figure \(\PageIndex{8}\), the gray structure is hexokinase without glucose (2YHX). However, it has a glucose analog bound, o-tolyoylglucosamine (spacefill, yellow highlights), which binds at the glucose binding site but does not cause a subsequent conformation change. The cyan structure (in the actual iCn3D model) show the enzyme with glucose shown as colored sticks. Note the large conformational change on the actual binding of glucose, a classical example of an "induced fit" mechanism.
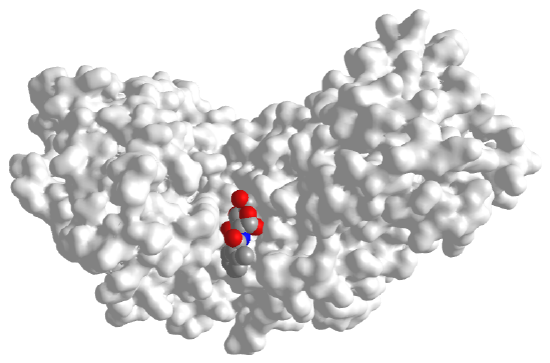
Figure \(\PageIndex{9}\) shows the surface of both enzymes using the same color coding as in the above figure These images better show how the active site of hexokinase is occluded in the glucose-bound form. This prevents water access and hydrolysis of bound ATP instead of "alcoholysis" of ATP (transfer of phosphate to glucose). The gray structure on left has the glucose analog bound which doesn't alter the global conformation of the protein.
 |
|
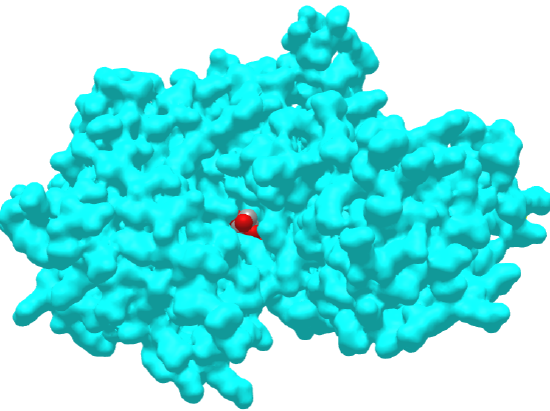
Figure \(\PageIndex{9}\): Surface of human hexokinase I with bound o-tolyoylglucosamine (spacefill, left, 2YHX) and with bound glucose (spacefill, right, 3B8A)
Hexokinase I is the key form in the brain. It forms a complex with porin in the mitochondrial outer membrane and ATP/ADP translocase or carrier protein in the mitochondrial inner membrane which facilitates the hexokinase reaction. The mechanism for the reaction of human hexokinase I is shown in Figure \(\PageIndex{10}\) below.
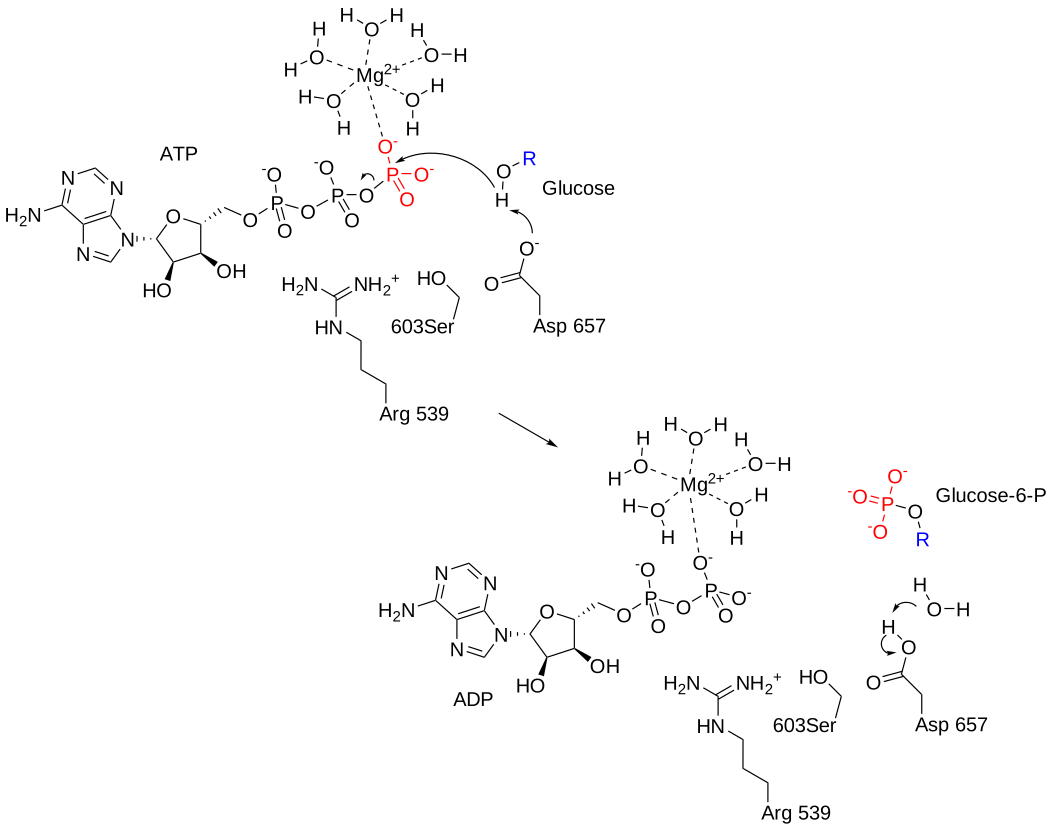
Figure \(\PageIndex{10}\): Mechanism of human hexokinase I.
Ribeiro AJM et al. (2017), Nucleic Acids Res, 46, D618-D623. Mechanism and Catalytic Site Atlas (M-CSA): a database of enzyme reaction mechanisms and active sites. DOI:10.1093/nar/gkx1012. PMID:29106569. https://www.ebi.ac.uk/thornton-srv/m-csa/entry/696/. Creative Commons Attribution 4.0 International (CC BY 4.0) License.
Figure \(\PageIndex{11}\) below shows an interactive iCn3D model of human hexokinase I with glucose and ADP in the active site (1dgk).
.png?revision=1&size=bestfit&width=639&height=280)
Figure \(\PageIndex{11}\): Human hexokinase I with glucose and ADP in the active site (1dgk). (Copyright; author via source). Click the image for a popup or use this external link: https://structure.ncbi.nlm.nih.gov/i...aQy4gf6A2bWtp8
The key catalytic residues are shown in colored sticks and labeled. Glucose, ADP, and PO42- are shown as colored spheres.
Note that hexokinase I, as well as forms II and III, have spatially distinct halves similar to those in the yeast enzymes. Forms I-III have a molecule weight of about 100K. Form IV (glucokinase) has a molecular weight of 50K and is similar to the distinct halves of I-III. suggesting that I-III arose through gene duplication.
Each half also binds glucose and ADP but the N-terminals of I and III are catalytically inactive. Hexokinase II, with both halves active, is the main enzyme involved in glycolysis in most mammalian tissues. Other differences are that glucose-6-phosphate, a product, inhibits I-III. PO42- relieves G6P product inhibition in form I but not the others. ADP binding at multiple sites in hexokinase I likely causes a conformational change that affects structure and activity.
Sugar kinases in general
We will see many kinases that use ATP to phosphorylate sugars, so it is useful to explore both their differences and similarities at the beginning of our studies on carbohydrate metabolism.
Figure \(\PageIndex{12}\) below shows the comparative structures of the five carbohydrate kinase classes.
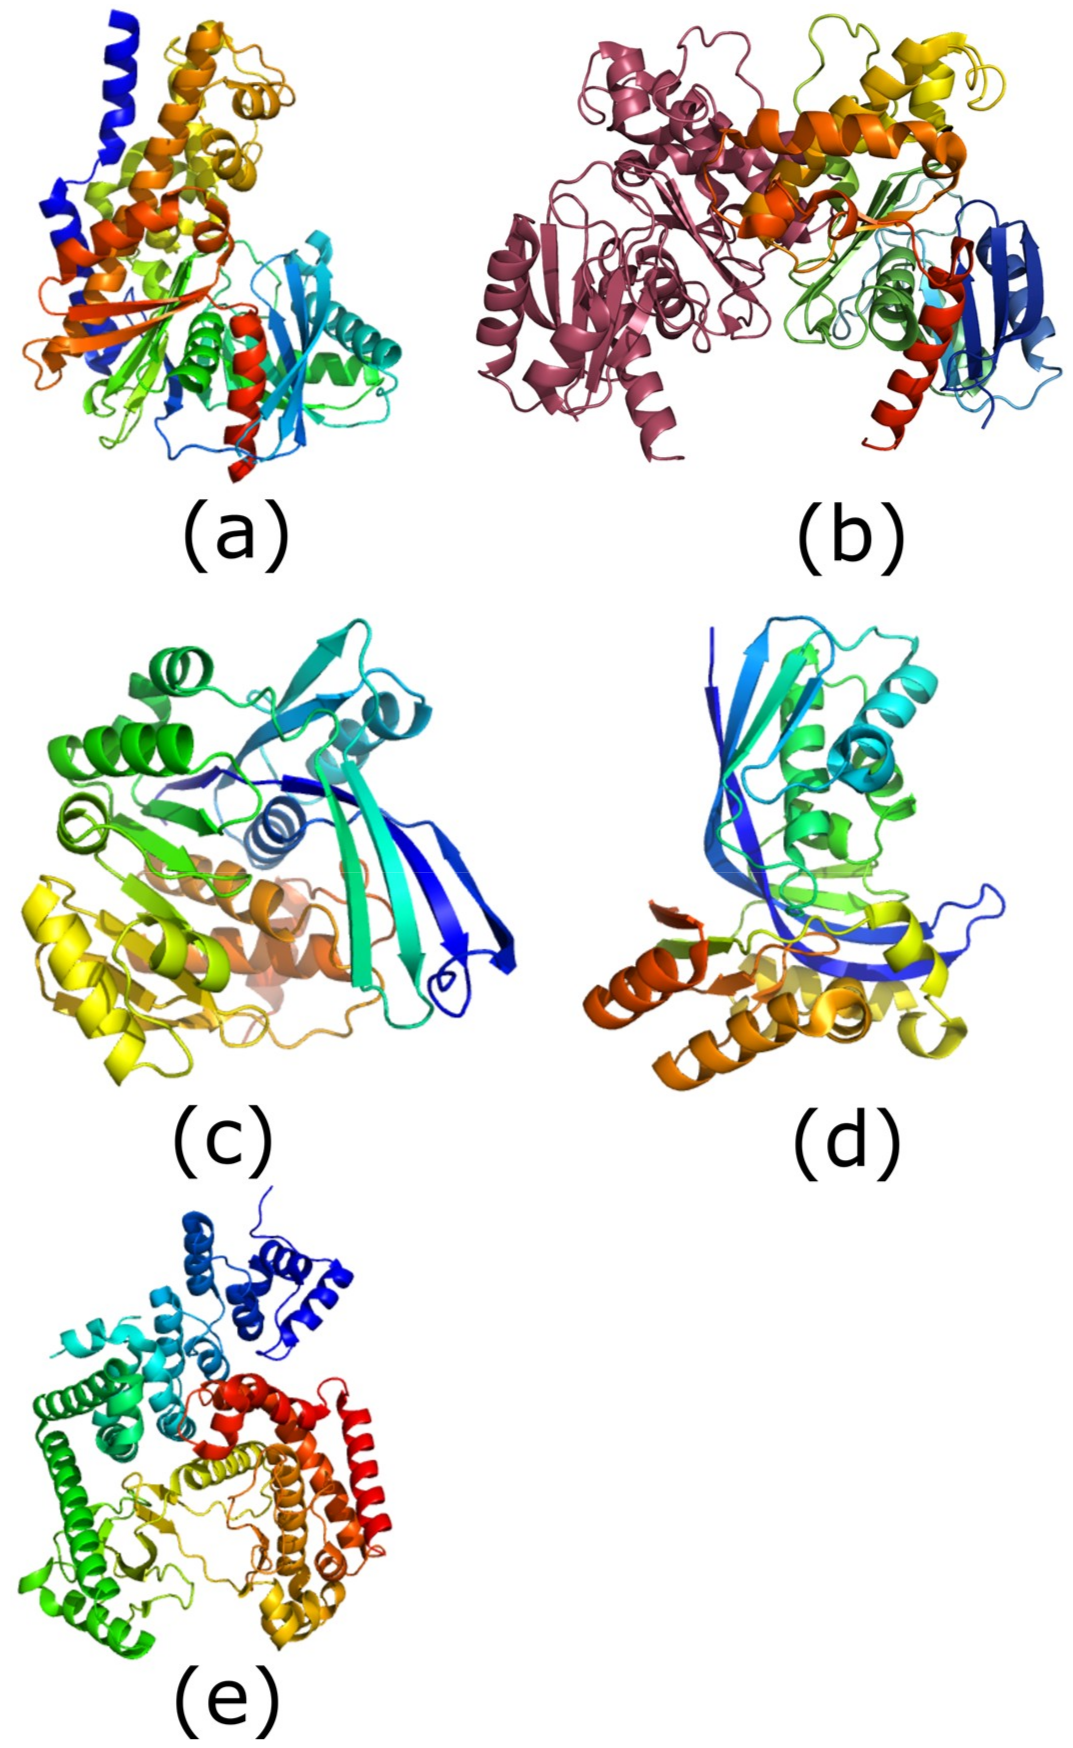
Figure \(\PageIndex{12}\): Structures of the five carbohydrate kinase classes. All images are shown in rainbow format (blue: N-terminus, red: C-terminus). Roy, S.; Vivoli Vega, M.; Harmer, N.J. Carbohydrate Kinases: A Conserved Mechanism Across Differing Folds. Catalysts 2019, 9, 29. https://doi.org/10.3390/catal9010029. Creative Commons Attribution License
Panel (a) shows the structure of human glucokinase (hexokinase class; PDB (protein data bank) ID: 4IWV).
Panel (b) shows the structure of Bacillus subtilis fructokinase dimer: the second molecule shown in raspberry (ROK kinase class; PDB ID: 1XC3 [17]).
Panel (c) shows the structure of Escherichia coli ribokinase (ribokinase class; PDB ID: 1RKD; [18]).
Panel (d) shows the structure of Aquifex aeolicus IspE (GHMP kinase class; PDB ID: 2V2Z; [19]).
Panel (e) shows the structure of human PIK3C3 (phosphatidylinositol phosphate kinase class; PDB ID: 3IHY).
Table \(\PageIndex{1}\): Overview of the Five Carbohydrate Kinase Classes.
| Carbohydrate Kinase Family | Common Substrates | Native Phosphate Donors (Minor Donors in Parentheses) | Pfam ID |
|---|---|---|---|
| Hexokinase | Glucose, mannose, fructose | ATP (ITP) | PF00349, PF03727, PF02685 |
| ROK Kinase | Glucose, allose, fructose, N-acetylglucosamine, N-acetylmannosamine | ATP (polyphosphate) | PF00480 |
| Ribokinase | Ribose, 2-deoxy-d-ribose, adenosine | ATP, ADP (GTP, ribonucleotide) | PF00294 |
| GHMP Kinase | Galactose, N-acetylgalactosamine, | ATP (GTP, ITP) | PF00288 |
| Phosphatidylinositol kinase | Phosphatidylinositol, phosphatidylinositol phosphates | ATP (GTP) | PF00454, PF01504 |
ROK is a bacterial Repressor, Open reading frame, Kinases are predominantly bacterial enzymes. Ribokinases include adenosine kinases, fructokinases, and phosphofructokinases. GHMP Kinases include Galactokinase, Homoserine kinase, Mevalonate kinase, and Phosphomevalonate kinase. Roy et al. Ibid
Many of these kinases are regulated by the binding of allosteric effectors.
Figure \(\PageIndex{13}\) shows a common mechanism for all, using glucose as an example substrate.
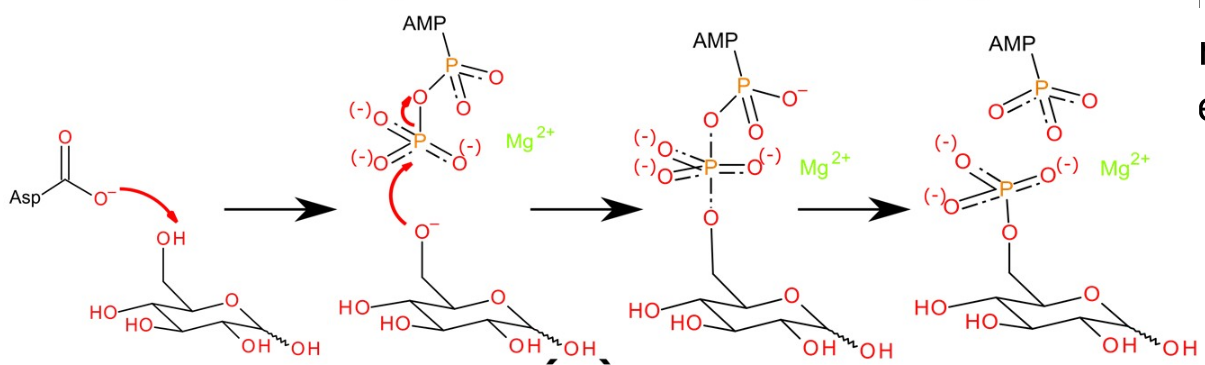
Figure \(\PageIndex{13}\): Generic reaction mechanism for carbohydrate kinases (hexokinase shown). Roy et al, Ibid. The generic reaction is initiated by a catalytic base abstracting a proton from the reactive hydroxyl (left). The oxygen atom then attacks the -phosphate of ATP (second left), forming a pentacoordinate transition state (second right). This is stabilized by a divalent cation, and by the protein (not shown). This transition state resolves, leaving ADP and the phosphorylated carbohydrate (right).
Reaction 2: Glucose-6-Phosphate ↔ Fructose-6-Phosphate. ΔGo=+0.4 kcal/mol (+1.7 kJ/mol)
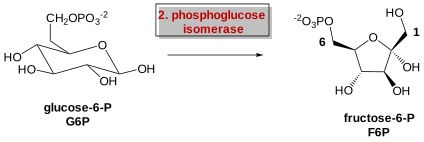
In the second step of glycolysis, the phosphoglucose isomerase (PGI) converts glucose-6-phosphate into one of its isomers, fructose-6-phosphate. Recall that an isomerase is an enzyme that catalyzes the conversion of a molecule into one of its isomers. In this reaction, the aldose, glucose-6-phosphate, is converted to the ketose, fructose-6-phosphate. This conversion is essential to allow the eventual split of the sugar into two three-carbon molecules. We'll present this reaction, catalyzed by phosphoglucose isomerase (PGI), in several different types of representations (chair, wedge/dash, and Fischer projection), as shown in Figure \(\PageIndex{14}\) below.
 |
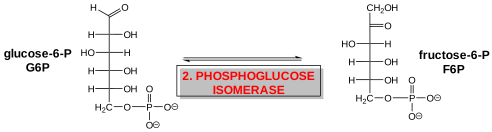 |
Figure \(\PageIndex{14}\): Summary reaction, phosphoglucoisomerase
From a functional perspective, seen more clearly from the linear Fischer structure, it is evident that the C=O has been moved to the C2 position to create the ketose structure. The carbonyl O is now positioned to be an electron sink facilitating electron flow for reaction 4. This isomerization reaction would be expected to have a ΔGo of about 0.
It has been proposed that the mechanism of PGI requires the enzyme to open the Glucose-6-Phosphate ring before the actual isomerization step, which proceeds through the formation of a cis-enediol intermediate and keto-enol tautomers before conversion back to the cyclic form.
Figure \(\PageIndex{15}\) below shows a proposed mechanism for rabbit phosphoglucose isomerase
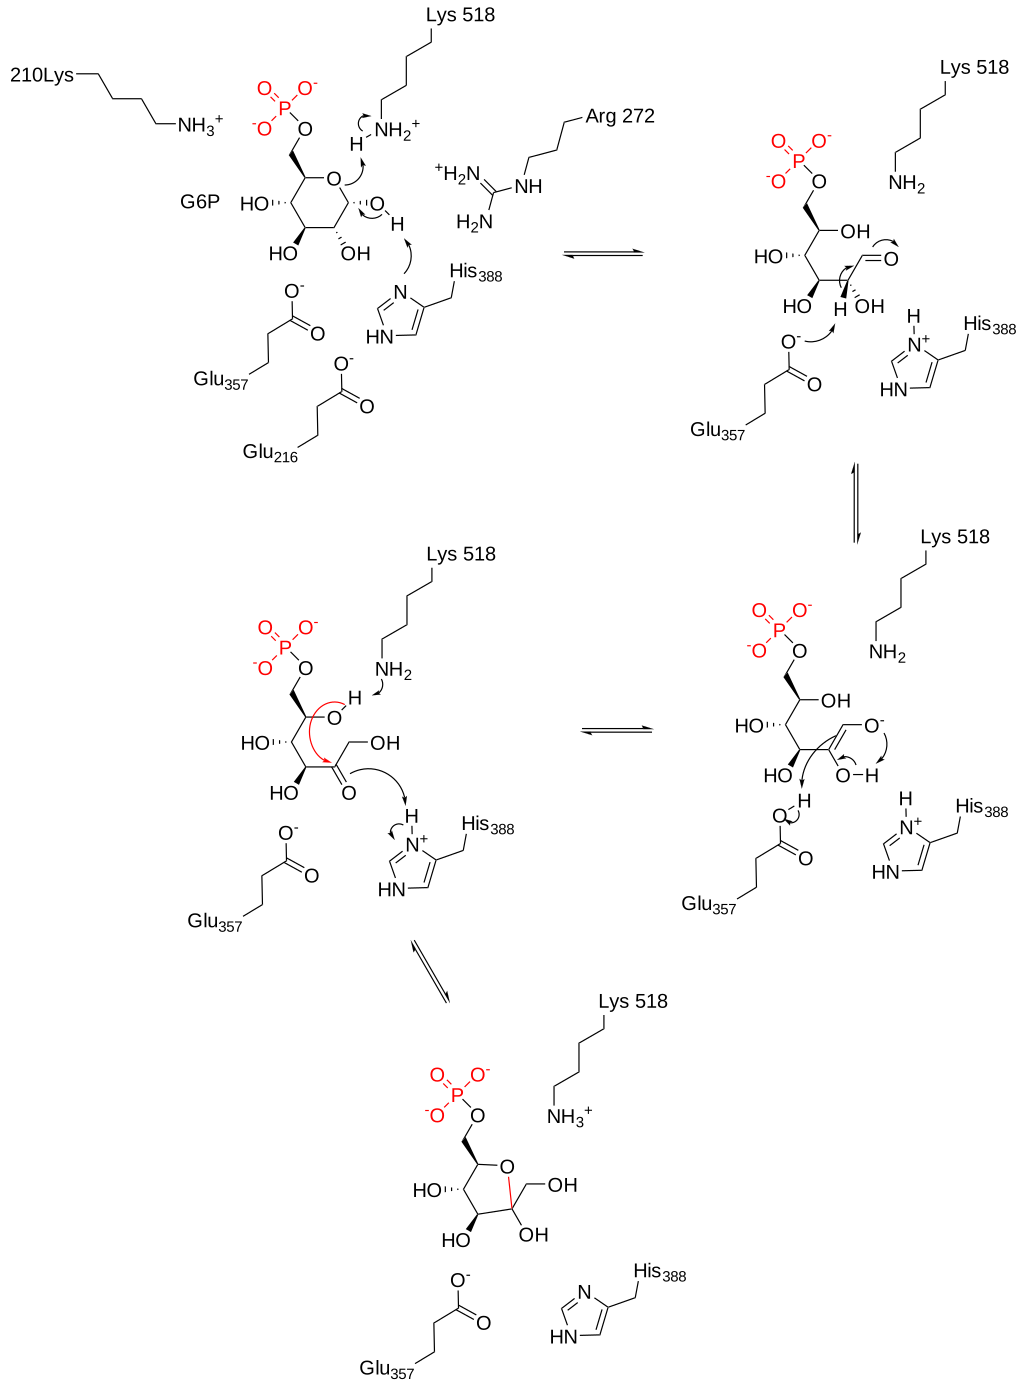
Figure \(\PageIndex{15}\): Mechanism for phosphoglucose isomerase. Ribeiro AJM et al. Ibid
Figure \(\PageIndex{16}\) below shows an interactive iCn3D model of rabbit phosphoglucose isomerase with bound 6-phosphogluconic acid (1DQR)
.png?revision=1&size=bestfit&width=433&height=394)
Figure \(\PageIndex{16}\): Rabbit phosphoglucose isomerase with bound 6-phosphogluconic acid (1DQR). (Copyright; author via source). Click the image for a popup or use this external link: https://structure.ncbi.nlm.nih.gov/i...xo1SgF1ZpAySm9
One monomer of the dimer is shown in gray and the other in cyan. The catalytic residues Lys518 and His388 are shown in both subunits in colored sticks and labeled. Additional residues that contribute to specificity (Ser209, Ser159, Thr214, Thr217, and Thr211) are shown in the gray subunit with color sticks and labeled. 6-phosphogluconic acid, a competitive inhibitor, is shown in color spacefill.
The enzyme also has other functions in addition to its role in glycolysis, so it is a member of a group called "moonlighting" (a term that refers to working at a secondary job). proteins. Outside of the cell, phosphoglucoisomerase acts as a nerve growth factor and cytokine. It is also called autocrine motility factor (PGI/AMF) and its cytokine activity is associated with aggressive cancers.
Reaction 3: Fructose-6-Phosphate → Fructose-1,6-Bisphosphate. ΔGo=-3.4 kcal/mol (-14 kJ/mol)
The third step is the phosphorylation of fructose-6-phosphate, catalyzed by the enzyme phosphofructokinase-1 (PFK1). A second ATP molecule donates a high-energy phosphate to fructose-6-phosphate, producing fructose-1,6-bisphosphate. The term bisphosphate is used when two phosphate groups are joined to a molecule at different positions on the molecule. In this case, one phosphate is at the 1-carbon position and the other is at the 6-carbon position. This differs from the term diphosphate, which is used when the phosphate groups are joined in a sequence, as in the molecule ADP. In ADP, both phosphate groups are joined in tandem from the 5-carbon position on the ribose ring structure.
In the glycolytic pathway, PFK1 is a rate-limiting enzyme. The mechanism of PFK1 regulation is discussed in greater detail in Chapter 15.5. However, we will introduce the process here. Essentially, the enzyme is sensitive to the energy load within the cell. Recall that ATP is a recycled molecule and exists in a pool of interconverting ATP, ADP, and AMP. A chief outcome of glycolysis is to shift the pool towards increased levels of ATP to drive endergonic processes like muscle contraction. PFK1 activity is sensitive to the ATP:ADP ratio within the cell. PFK1 is more active when the concentration of ADP is high and the concentration of ATP is low, and it is conversely less active when ADP levels are low and the concentration of ATP is high. This is a type of end-product inhibition since ATP is the end product of glucose catabolism. Note, however, that ATP is also a substrate for PFK1. ATP serves as the phosphate donor in the reaction and is required in the process. This is the second energy-intensive step in the glycolytic pathway. At the end of the PFK1 step, a total of 2 ATP molecules have been broken down in the glycolytic pathway.
The PFK1 enzymatic step is also important within the glycolytic pathway as it is the committed step in the pathway. Glucose-6-phosphate may be used for other purposes within the cell, and the isomerase step that converts glucose-6-phosphate to fructose-6-phosphate is readily reversible. The PFK1 enzyme only works in the forward direction to create fructose 1,6-bisphosphate. It cannot in the reverse direction and recover the reactant. Thus, it is thought of as the committed step in the glycolytic pathway as the fructose-1,6-bisphosphate will predominantly be converted into pyruvate through the remaining enzymatic steps.
The reaction catalyzed by PFK1 is shown in Figure \(\PageIndex{17}\) below.
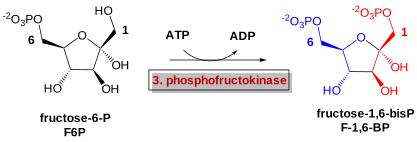
Figure \(\PageIndex{17}\): Summary reaction - phosphofructokinase
By phosphorylating this intermediate, both products of the cleavage of this 6C molecule will be phosphorylated, keeping both more readily inside the cell. This reaction is a nucleophilic substitution reaction on the gamma phosphate of ATP. A phosphoanhydride bond is broken in ATP as a phosphoester bond is made producing fructose-1,6-bisphosphate. As in reaction 1, this reaction proceeds with a negative ΔGo
The PFK1 enzyme exists as a tetramer and as with another "famous" tetramer, hemoglobin, it can exist in T and R symmetry states. Hence it is an allosteric enzyme and has many allosteric regulators. One important allosteric activator of eukaryotic (but not prokaryotic) PFK is fructose-2,6-bisphosphate. This is formed by a separate phosphofructokinase enzyme named PFK2. This regulatory pathway will be described in greater detail in Chapter 15.5. Hence the number 1 is added to the name of the glycolytic enzyme, PFK1, that forms fructose 1,6-bisphosphate, to indicate the position of phosphorylation. Mammals have three isoforms of PFK1, muscle (PFKM), liver (PFKL), and platelet (PFKP).
The mechanism for E. Coli phosphofructokinase is shown in Figure \(\PageIndex{18}\) below. A metal cofactor (Mg2+) coordinates the positioning of the ATP and stabilizes the gamma phosphate for nucleophilic attack by the fructose alcohol group at position-1. Activation of the fructose alcohol group is mediated by proton abstraction with a coordinated Asp127 of PFK1.
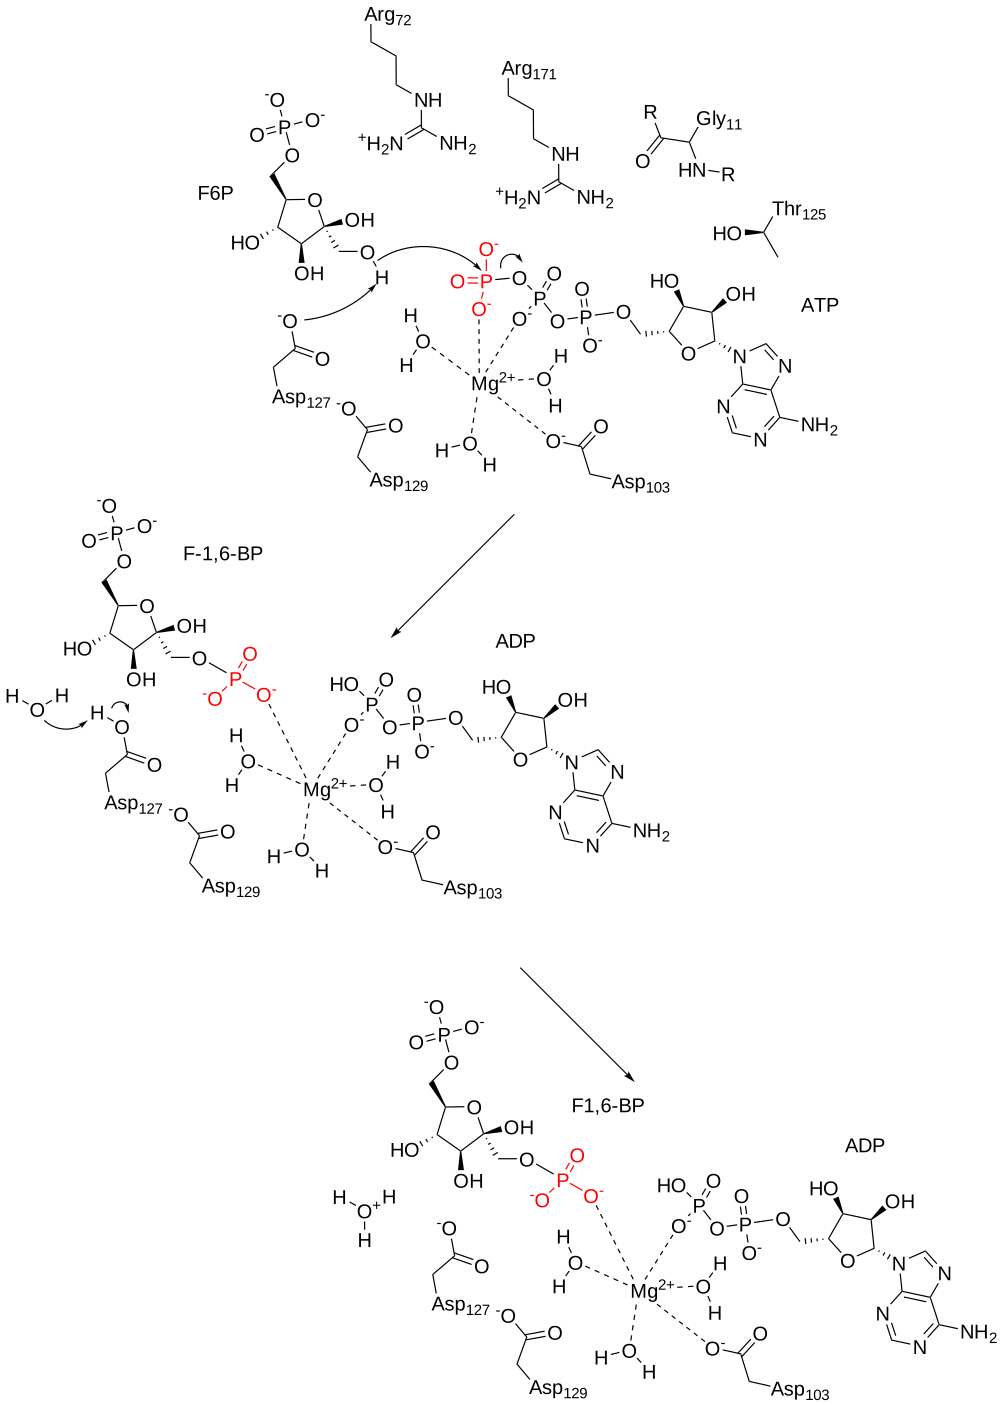
Figure \(\PageIndex{18}\): Proposed mechanism for E. Coli phosphofructokinase. Ribeiro AJM et al. Ibid
Figure \(\PageIndex{19}\) below shows an interactive iCn3D model of the E. Coli phosphofructokinase with bound F1,6-bisphosphate and ADP products (1PFK). (long load)
.png?revision=1&size=bestfit&width=427&height=382)
Figure \(\PageIndex{19}\): E. Coli phosphofructokinase with bound F1,6-bisphosphate and ADP products (1PFK). (Copyright; author via source). Click the image for a popup or use this external link: https://structure.ncbi.nlm.nih.gov/i...t4KKgLAGzHrzo8
Each monomer of the tetramer is shown in a different color. The gray monomers show key binding and catalytic residues described in the mechanism above. F1,6-bisphosphate is shown as spacefill and ADP is shown as sticks.
The structure of the human platelet PFK1 tetramer has been determined in the presence of ATP and ADP. Figure \(\PageIndex{20}\) below shows an interactive iCn3D model of the human phosphofructokinase-1 dimer (for clarity) in complex with ATP and Mg (4XYJ). (long load)
.png?revision=1&size=bestfit&width=442&height=390)
Figure \(\PageIndex{20}\): Human phosphofructokinase-1 dimer in complex with ATP and Mg (4XYJ). (Copyright; author via source). Click the image for a popup or use this external link: https://structure.ncbi.nlm.nih.gov/i...AKfonyGsNq6Cs9 (long load). Here is a link to the ADP bound structure: https://structure.ncbi.nlm.nih.gov/i...N81MBS4PZfSQp9
The monomers are shown as colored surfaces with secondary structures underneath. Note that side chains from each monomer in the dimer contribute to binding and catalysis. The actual PDB structure is tetrameric. The structures have an E173S mutation.
Figure \(\PageIndex{21}\) shows the differences in orientation of the key side chains in the ADP structure (left) and the ATP structure (right) that are key in the conformation changes in the enzyme on binding substrate.
|
ADP bound form of human PFK (4XKJ) |
ADP bound form of human PFK (4XYJ) |
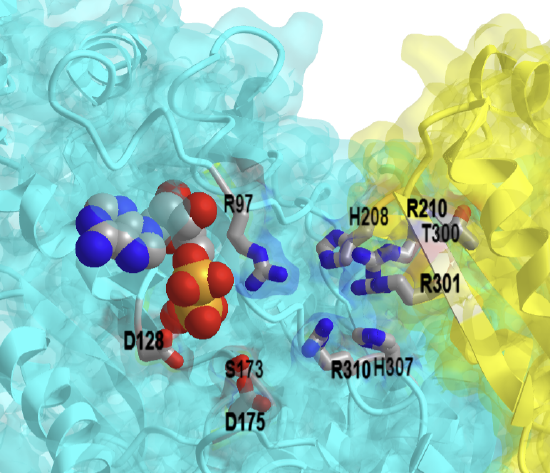
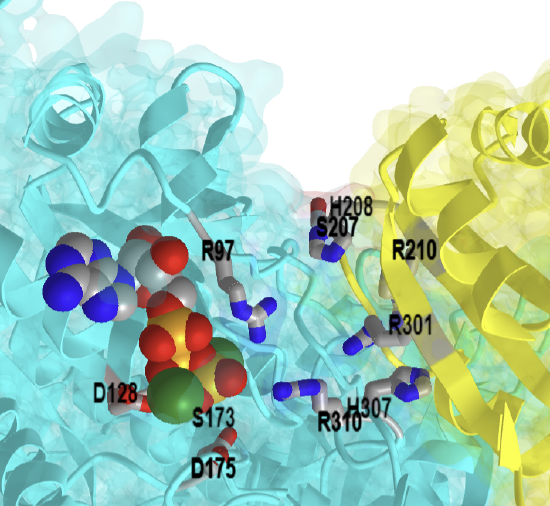
Figure \(\PageIndex{21}\): Conformation changes in the active site of PFK on ATP hydrolysis
Reaction 4: Fructose-1,6-bisphosphate → Dihydroxyacetone phosphate (DHAP) + Glyceraldehyde 3-phosphate (G3P). ΔGo = + 5.7 kcal/mol (+24 kJ/mol)
The newly added high-energy phosphates further destabilize fructose-1,6-bisphosphate. The fourth step in glycolysis employs an enzyme, aldolase, to cleave fructose-1,6-bisphosphate into two three-carbon isomers: dihydroxyacetone phosphate and glyceraldehyde-3-phosphate. This reaction is shown in Figure \(\PageIndex{22}\) below in both wedge dash and Fischer projections.
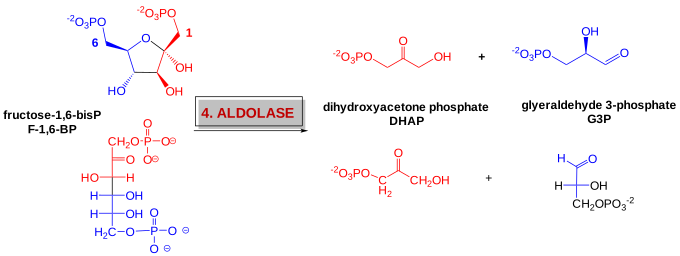
Figure \(\PageIndex{22}\): Summary reaction - aldolase
This is the first C-C bond cleavage within glucose on the path to complete cleavage during aerobic respiration and release of 6 carbon dioxide molecules per glucose metabolized. This reaction is the reverse of an aldol condensation when an enol or enolate reacts with a carbonyl C to form an adduct. Note that both products are phosphorylated. The reaction is not thermodynamically favored but is pulled in the forward direction by the utilization of the product in subsequent reactions in the pathway.
Table \(\PageIndex{2}\) Characteristics of the Three Classes of Aldolases (I, IA, and II) and the Organisms in Which They are Found.
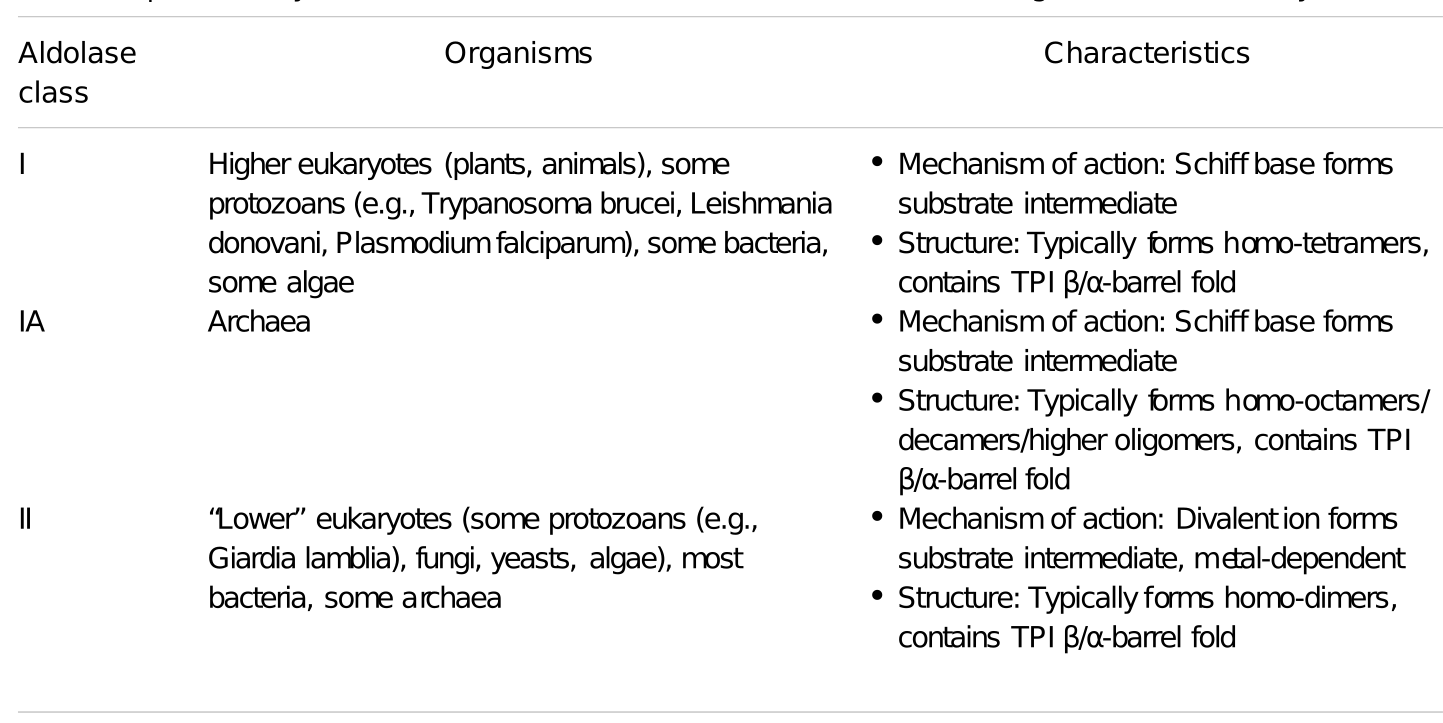
Pirovich et al, Frontiers in Molecular Biosciences, 8 (2021), https://www.frontiersin.org/article/...lb.2021.719678. AUTHOR=Pirovich David B., Da’dara Akram A., Skelly Patrick J. Creative Commons Attribution License (CC BY).
Class I Aldolase
These enzymes proceed through a Schiff base intermediate between a reactive lysine and the reactant/product. The enzyme is favored in the reverse direction and it's perhaps easier to see the mechanism presented in that fashion. In rabbits, the muscle Class I aldolase (RAMA) uses Lys-229 to form a Schiff base with DHAP as shown in a mechanism presented in Figure \(\PageIndex{23}\) below.
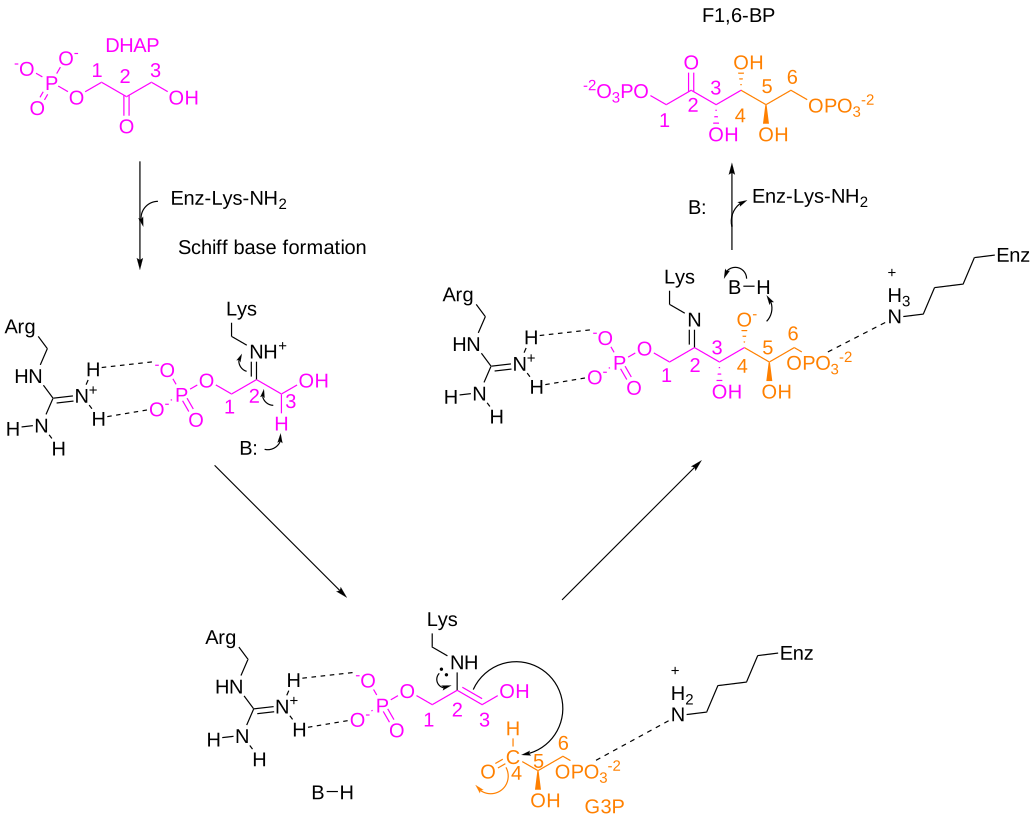
Figure \(\PageIndex{23}\): Class I aldolases - general mechanism (after Bolt et al., Arch Biochem Biophys. 2008 June 15; 474(2): 318–330)
Only the pro(S) proton of the dihydroxyacetone phosphate C3 carbon is removed and effectively exchanged with the glyceraldehyde-3-phosphate substrate. Figure \(\PageIndex{24}\) below reviews how the pro(R) and pro(S) hydrogens can be visually differentiated by replacing one with a deuterium and determining the stereochemistry of the now chiral C3.
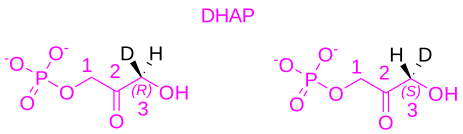
Figure \(\PageIndex{24}\): Visualization of the Pro(R) and Pro(S) Hydrogens on DHAP
Figure \(\PageIndex{25}\) shows key active site residues in the active site of a Class I aldolase from rabbit muscle. The first step in Schiff base formation with Lys229 is shown.
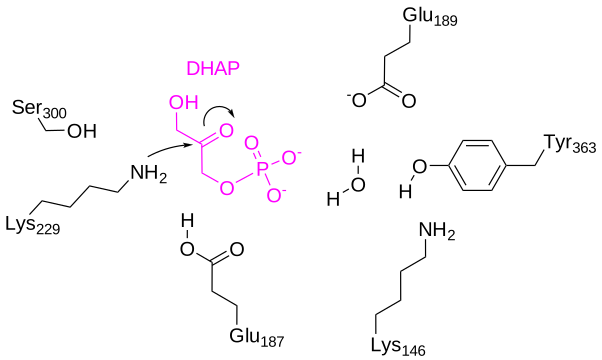
Figure \(\PageIndex{25}\): Catalytic residues in rabbit muscle Class I enolase.
Figure \(\PageIndex{26}\) shows an interactive iCn3D model of the dihydroxyacetone phosphate enamine intermediate in fructose-1,6-bisphosphate aldolase from rabbit muscle (2QUT)
.png?revision=1&size=bestfit&width=424&height=398)
Figure \(\PageIndex{26}\): Dihydroxyacetone phosphate enamine intermediate in fructose-1,6-bisphosphate aldolase from rabbit muscle (2QUT). (Copyright; author via source). Click the image for a popup or use this external link: https://structure.ncbi.nlm.nih.gov/i...uR5KZBsfN8QQh9
Only one monomer of the four in the homotetramer is shown. The ligand, 1,3-dihydroxyacetonephosphate, is shown in spacefill with CPK colors. It is Schiff base linkage with Lys229. The key catalytic residues are shown and labeled.
The reaction proceeds between eneamine and iminium covalent intermediates. A K146M mutation (in the active site) decreases enzyme activity and allows the trapping of the K229 eneamine intermediate. A key tyrosine (Y363) in its deprotonated state formed in the presence of the iminium phosphate and a local water appears to abstract the C3 pro(S) proton to form the enamine.
Class II Aldolase
Figure \(\PageIndex{27}\):
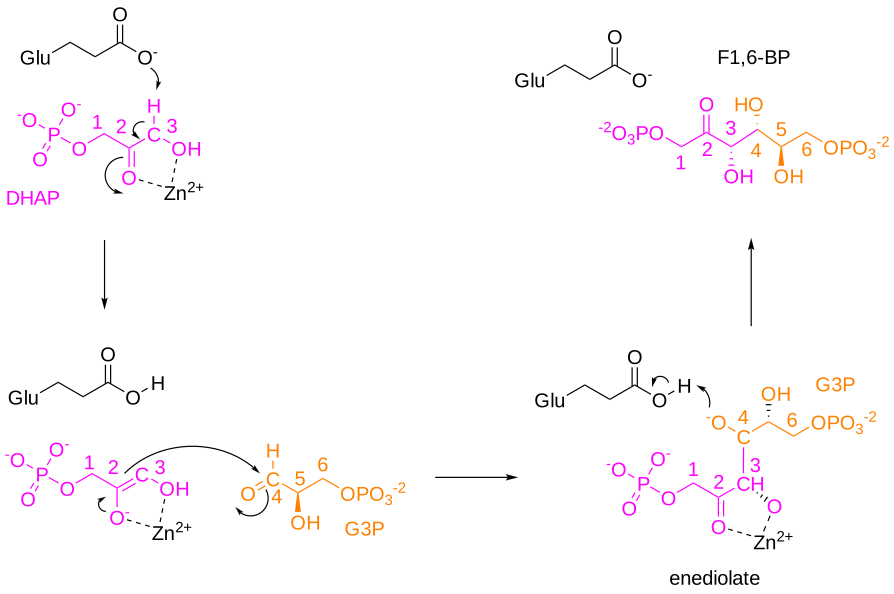
Figure \(\PageIndex{27}\): Class II aldolases - general mechanism (after Bolt et al, ibid)
Reaction 5: DHAP ↔ G3P. ΔGo= +1.8 kcal/mol (+7.5 kJ/mol)
This reaction, catalyzed by triose phosphate isomerase (TPI), is shown in Figure \(\PageIndex{28}\).

Figure \(\PageIndex{28}\: Summary reaction - triose phosphate isomerase.
This is another simple isomerization reaction. Only one product, glyceraldehyde-3P continues on in glycolysis, so only one enzyme is needed to metabolize the cleavage products of this reaction further. As in other isomerization reactions, the ΔGo is close to 0.
A proposed mechanism for this reaction is shown in Figure \(\PageIndex{29} below.
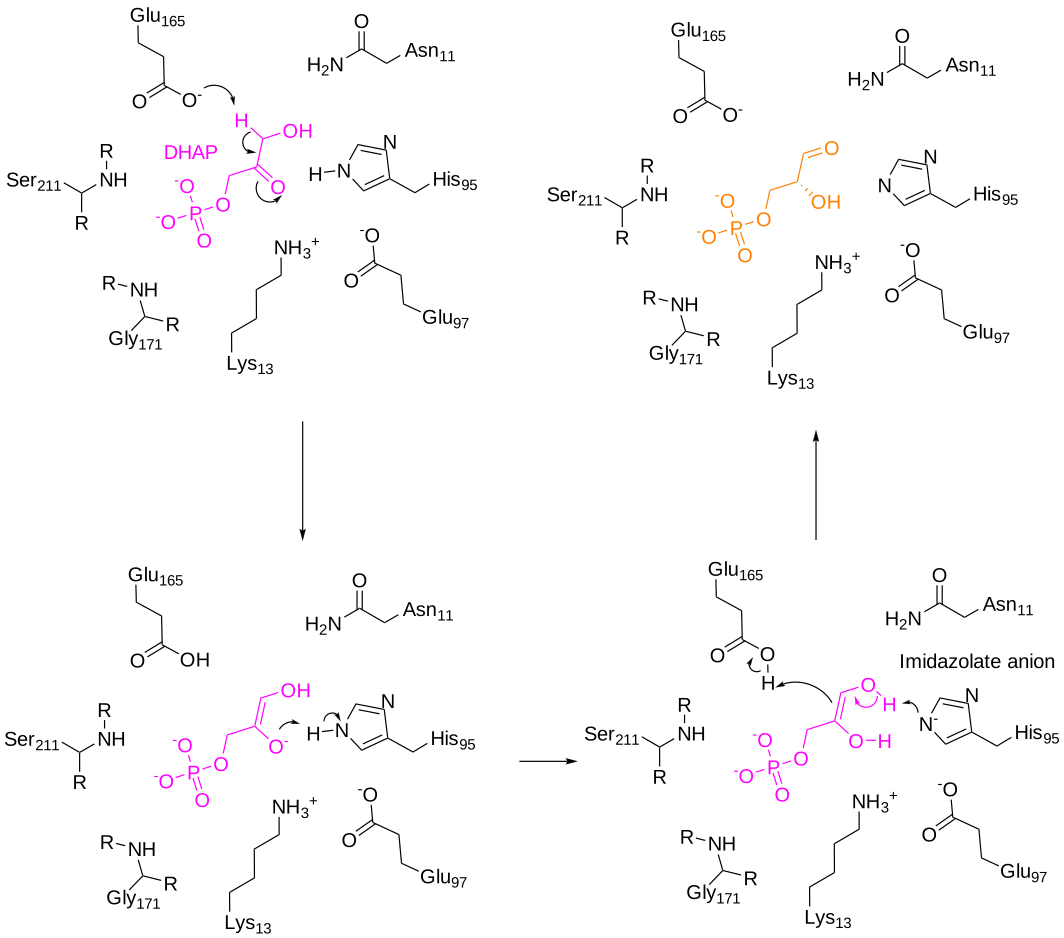
Figure \(\PageIndex{29}\): Proposed mechanism for triose phosphate isomerase (after Bolt et al, ibid)
Note that the reaction employees the deprotonation of a neutral imidazole side chain to form an imidazolate anion. This would not likely be favorable, given its pKa value.
The are four possible conserved proton donors with more reasonable pKas in the active sites of TPIs, including K12, H95, E97, and E165. Mutations of E97 to E97Q and E97D lead to a 4000-fold reduction in kcat (E97Q) but only a 100-fold reduction for E97D suggesting tha30}\) shows an interactive iCn3D model of the chicken triosephosphate isomerase-phosphoglycolohydroxamate complex (1TPH)
.png?revision=1&size=bestfit&width=518&height=341)
Figure \(\PageIndex{30}\): Chicken triosephosphate isomerase-phosphoglycolohydroxamate complex (1TPH). (Copyright; author via source). Click the image for a popup or use this external link: https://structure.ncbi.nlm.nih.gov/i...AFXpt9kg5aki5A
The four key conserved residues are shown in the gray monomer of the homodimer.
Reaction 6: G3P ↔1,3 BPG. ΔGo= +1.5 kcal/mol (+6.1 kJ/mol)
This reaction, catalyzed by glyceraldehyde-3-phosphate dehydrogenase, is shown in Figure \(\PageIndex{31}\)
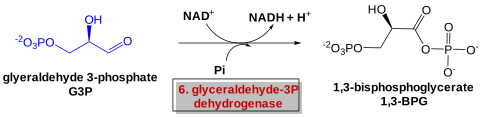
Figure \(\PageIndex{31}\: Summary reaction - glyceraldehyde-3-phosphate dehydrogenase
This is a big reaction! Note that the ΔGo is close to 0 but look at what happened. The carbonyl O in G3P has been oxidized to the form of a mixed anhydride which can donate a phosphate to ADP (in the next step) to form ATP. That this is an oxidation reaction should be obvious from the fact that the carbonyl C in G3P has two bonds to O but 3 bonds in 1,3 BPG.
To carry out an oxidation reaction, you need an oxidizing agent. In comes NAD+, a modest but very prevalent oxidizing agent in biology. When glucose is oxidized completely by O2 to CO2 during combustion, much energy is released so we can surmise that oxidation reactions, if carried out by powerful oxidizing agents like O2, proceed with a large negative ΔGo. For every oxidation reaction, the oxidizing agent is reduced. All reactions are potentially reversible so the products formed are new potential oxidizing and reducing agents. As in acid/base reactions, which proceed from stronger acid to weaker conjugate acid, redox reactions proceed from a stronger to a weaker oxidizing agent. For reaction 6, we must use tables of redox potentials to calculate the actual ΔGo. It turns out to be close to 0, which is great since in the same reaction, a substrate-level phosphorylation reaction (using inorganic phosphate - Pi instead of ATP) occurs. In summary, this reaction catalyzes the first and only oxidation of glucose in glycolysis which has paid (thermodynamically) for the generation of a mixed anhydride whose phosphorylating potential is higher than that of ATP.
Figure \(\PageIndex{32}\) shows a proposed mechanism for glyceraldehyde-3-phosphate dehydrogenase from Trypanosoma cruzi
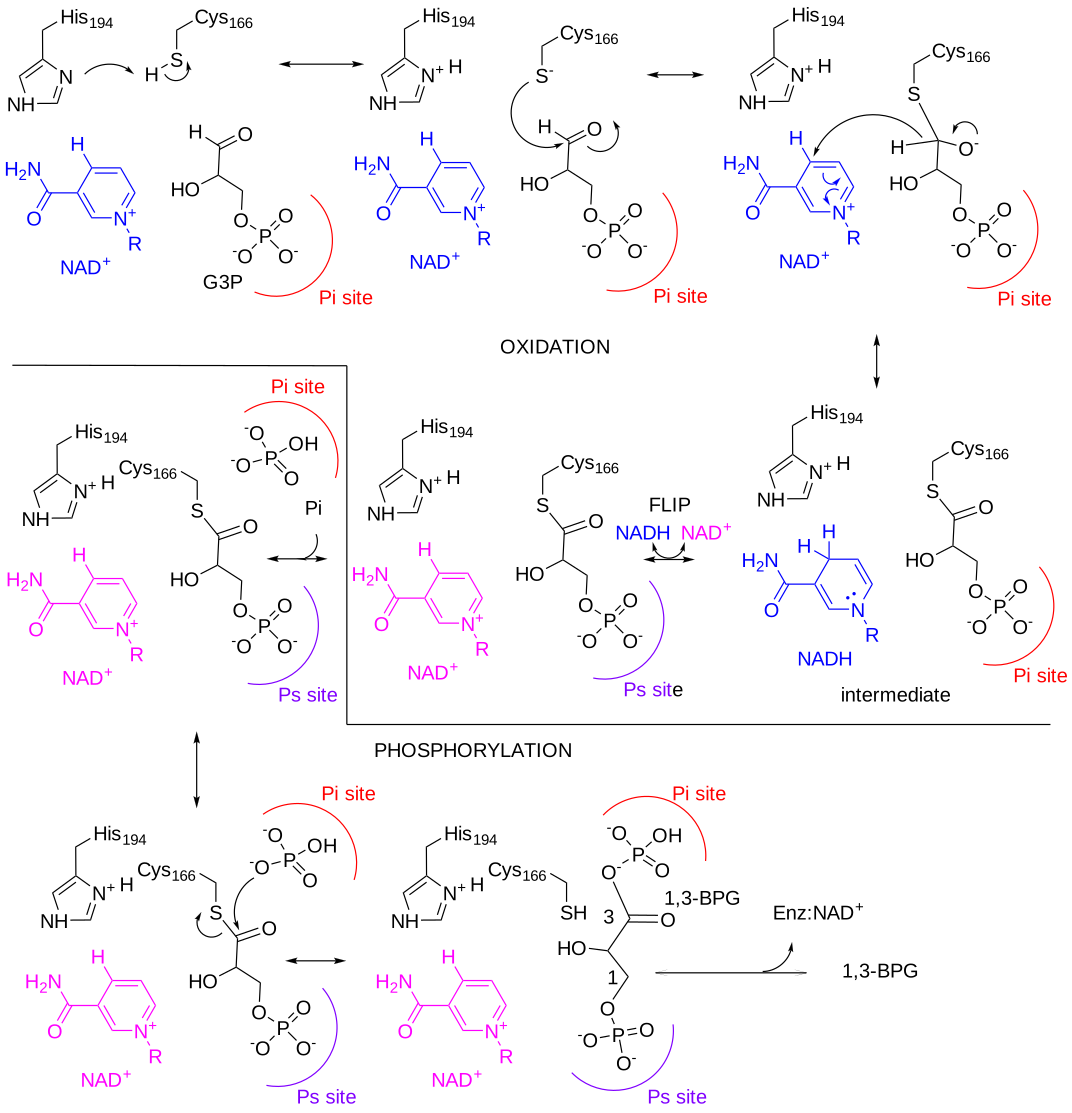
Figure \(\PageIndex{32}\): Proposed mechanism for glyceraldehyde-3-phosphate dehydrogenase from Trypanosoma cruzi (after Reis et al. Phys. Chem. Chem. Phys., 2013, 15, 3772. https://pubmed.ncbi.nlm.nih.gov/23389436/)
The reaction proceeds in two parts. The first (top section) is the oxidation of glyceraldehyde-3-phosphate (G3P) by NAD+ to the state of a thioester attached to Cys166. The now reduced NADH dissociates and is replaced by a new NAD+ for another cycle of catalysis. In the meantime, inorganic phosphate, Pi, binds and reacts with the thioester to form 1,3-bisphosphoglycerate (1,3-BPG).
The mechanism is not entirely clear. There are two phosphate binding sites, Pi (red) and Ps (purple) which interact with phosphate groups on the substrates. The oxidation part of the reactions appears to take place at the Pi site. Pi is composed of the side chains of Thr197, Thr199, and the 2-hydroxyl group of the ribose in NAD+. The Pi site in the T. cruzi enzyme consist of Thr226 and Arg249, Gly227, and Ser 247. The mechanism appears to involve a flip of the orientation of substrates and intermediates after the dissociation of NADH from the enzyme.
Figure \(\PageIndex{33}\) shows an interactive iCn3D model of the Trypanosoma cruzi glyceraldehyde-3-phosphate dehydrogenase with bound NAD and a 1,3-bisphosphoglycerate analogue (1QXS)
.png?revision=1&size=bestfit&width=488&height=367)
Figure \(\PageIndex{33}\): Trypanosoma cruzi glyceraldehyde-3-phosphate dehydrogenase with bound NAD and a 1,3-bisphosphoglycerate analogue (1QXS) . (Copyright; author via source). Click the image for a popup or use this external link: https://structure.ncbi.nlm.nih.gov/i...WnsNSgmA3AJyw6
Only two monomers of the homotetramer are shown for clarity. The Pi site is shown in magenta and the Ps site is in purple. The phosphonic acid analog is shown in spacefill and NAD in sticks. The active site His194 and Cys166 are also shown in sticks and labeled.
Reaction 7: 1,3 BPG + ADP + H+ → 3PG + ATP ΔGo= -4.5 kcal/mol (-19 kJ/mol)
This reaction, catalyzed by phosphoglycerate kinase, is shown in Figure \(\PageIndex{34}\)
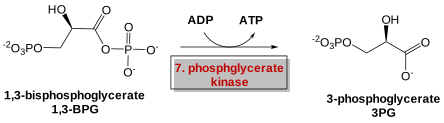
Figure \(\PageIndex{34}\): Summary reaction - phosphoglycerate kinase
It's finally happened! An ATP has been made for each of the two 1,3-BPG molecules derived from glucose. We've made back the ATP used in steps 1 and 3. A mixed phosphoanhydride bond is broken in 1,3 BPG as a phosphoanhydride bond is made in ATP. As the mixed phosphoanhydride has higher energy than its hydrolysis product compared to the phosphoanhydride in ATP, the reaction proceeds with a negative ΔGo
A mechanism for the reaction is shown in Figure \(\PageIndex{35}\).
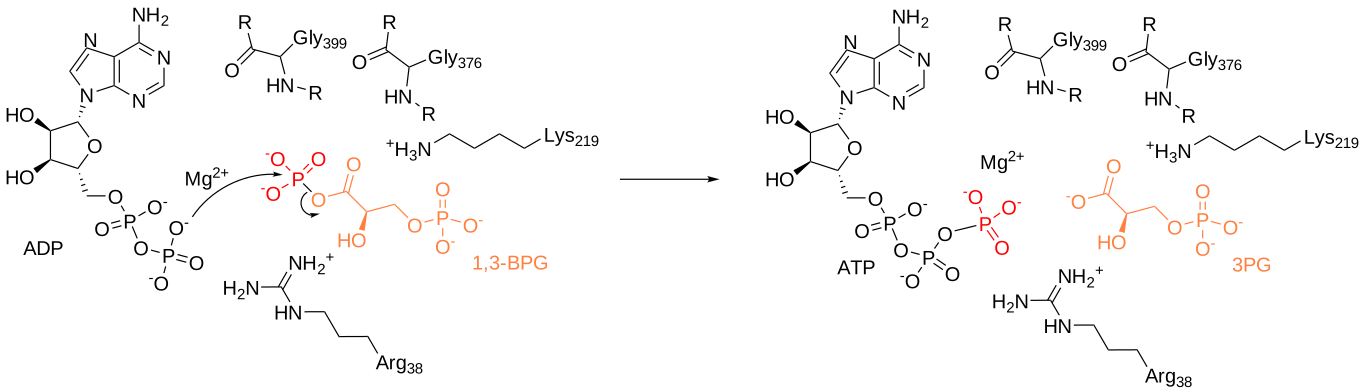
Figure \(\PageIndex{35}\): Reaction mechanism for phosphoglycerate kinase
Figure \(\PageIndex{36}\) shows an interactive iCn3D model of human phosphoglycerate kinase in complex with ADP, 3PG, and magnesium trifluoride (2WZB).
.png?revision=1&size=bestfit&width=486&height=342)
Figure \(\PageIndex{36}\): Human phosphoglycerate kinase in complex with ADP, 3PG, and magnesium trifluoride (2WZB). (Copyright; author via source). Click the image for a popup or use this external link: https://structure.ncbi.nlm.nih.gov/i...w5yvu2VuGhmQXA
3-phosphoglycerate is shown in spacefill with CPK colors. ADP plus the adjacent MgF3 is a mimetic for the transition state for ATP synthesis. Hence this structure shows the products/transition state in a closed active site, which as we have seen before prevents spurious hydrolysis of 1,3-BPG or ATP.
Figure \(\PageIndex{37}\) shows an interactive iCn3D model of the alignment of the open form of human phosphoglycerate kinase (2XE7) with bound 3PG and ADP with the closed form with bound 3PG, ADP, and MgF3 (2WZB).
__with_the_closed_(2WZB).png?revision=1&size=bestfit&width=428&height=321)
Figure \(\PageIndex{37}\): Alignment of the open form of human phosphoglycerate kinase (2XE7) with bound 3PG and ADP with the closed form with bound 3PG, ADP, and MgF3 (2WZB). (Copyright; author via source). Click the image for a popup or use this external link: https://structure.ncbi.nlm.nih.gov/i...n5FfsJeYitiWr9
Use the "a" key to toggle back between the open form (magenta) and closed forms (cyan). In the closed state most closely representing the bond transition state of ATP, the two lobes of the enzyme clamp together.
Reaction 8: 3PG ↔ 2PG ΔGo= +1.1 kcal/mol (4.6 kJ/mol)
This reaction, catalyzed by phosphoglycerate mutase (PGM), is shown in Figure \(\PageIndex{38}\)
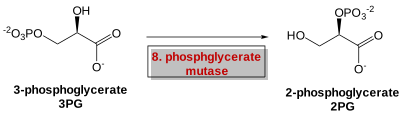
Figure \(\PageIndex{38}\): Summary reaction - phosphoglycerate mutase
This isomerization reaction proceeds with little thermodynamic barrier. Its function is to locate the phosphate on C2 which on the next reaction (dehydration) will form a molecule whose phosphoryl transfer potential is greater than ATP. It seems so simple but the enzymes that catalyze this reaction are diverse and quite complicated from a mechanistic perspective.
There are two types of PGMs, bisphosphoglycerate and monophosphoglycerate mutases that carry out three different reactions involving shuffling of phosphates from one position to another in 3C sugars or cleavage of a phosphate from a sugar
- 3-phosphoglycerate ↔ 2-phosphoglycerate (reaction 8 of glycolysis) catalyzed by bisphosphoglycerate and monophosphoglycerate (the glycolytic enzyme) mutases
- 1,3-bisphosphoglycerate ↔ 2,3-bisphosphoglycerate by bisphosphoglycerate mutases
- 2,3-phosphoglycerate ↔ 3-phosphoglycerate + Pi by bisphosphoglycerate mutases
Within the monophosphoglcyerate mutases, and more specifically the phosphoglycerate mutase (PGM) of glycolysis, there are two types
- one that depends on the cofactor 2,3-phosphoglycerate. These are called cofactor-dependent phosphoglycerate mutase (dPGM) and are found in mammals, yeast, and some bacteria. They do not require metal ions.
- one that does not depend on the cofactor 2,3-phosphoglycerate. These are called cofactor-independent phosphoglycerate mutase (iPGM) and are found in plants and some bacteria. These can only interconvert 3PGA and 2PGA. One family of enzymes in the class requires Mn2+ while the other requires Mg2+ or Zn2+. These enzymes are often structurally similar to alkaline phosphatases
The cofactor-independent and cofactor-dependent monophosphoglycerates (such as the phosphoglycerate mutase of glycolysis) are very different structurally and mechanistically so we will look at both types of mechanisms. Within each type, the enzyme sequences are very conserved.
Mechanism of cofactor (2,3-BPG) dependent phosphoglycerate mutase (dPGM)
The reaction is much less complicated than the cofactor-independent PGM. In E. Coli, the reaction involves the transfer of the phosphate on the C3-OH to the nucleophilic nitrogen on histidine 8 (His 10 in other enzymes) in the active site to form a covalent pHis8 intermediate. The phosphate on pHis could then be transferred to the O on carbon C2 of the substrate. An active His 181in E. Coli may also act as a general acid/base and is adjacent to the Glu 88 in the active site.
Figure \(\PageIndex{39}\) shows an interactive iCn3D model of yeast phosphoglycerate mutase (cofactor dependent) bound to 3-phosphoglycerate (1QHF)
_bound_to_3-phosphoglycerte%25C2%25A0(1QHF).png?revision=1&size=bestfit&width=589&height=331)
Figure \(\PageIndex{39}\): Yeast phosphoglycerate mutase (cofactor dependent) bound to 3-phosphoglycerate (1QHF). (Copyright; author via source). A dimer of the active tetramer is shown. Click the image for a popup or use this external link: https://structure.ncbi.nlm.nih.gov/i...9F4oc6mmr5DFs9
Mechanism of cofactor-independent phosphoglycerate mutase (iPGM)
Let's consider the mechanism for the Mn2+-requiring iPGM from Geobacillus stearothermophilus. Two Mn2+ ions are in the active site. The mechanism for the first half of the cofactor-independent phosphoglycerate mutase (iPGM) reaction is shown in Figure \(\PageIndex{40}\).
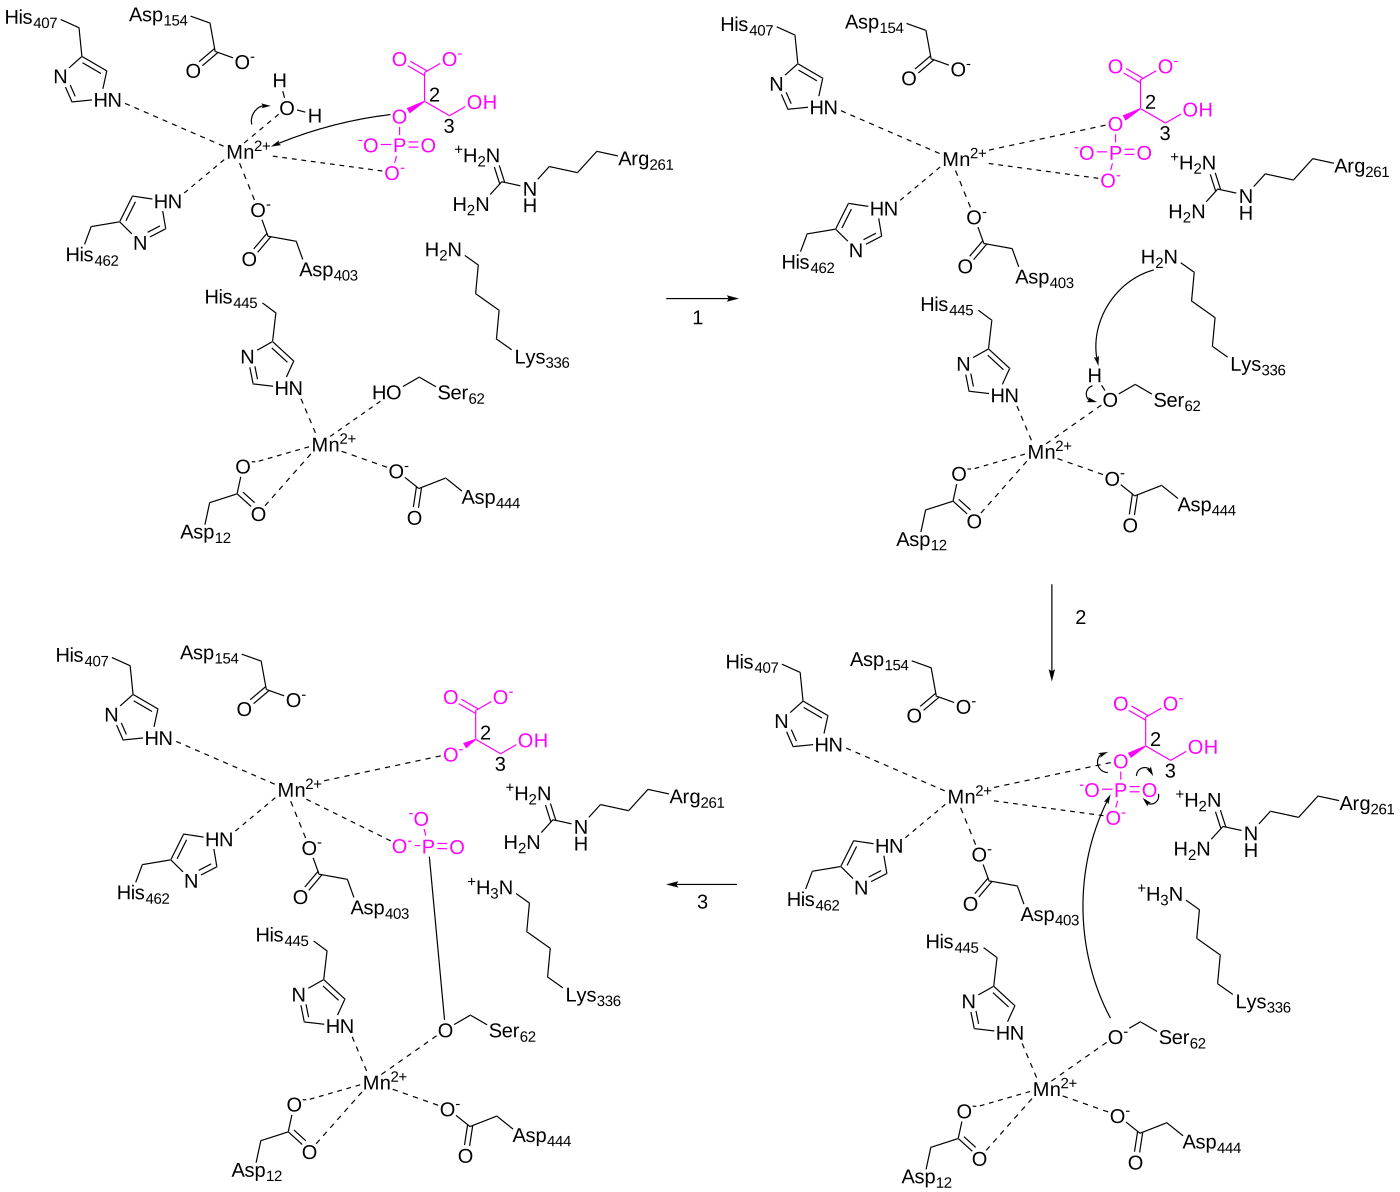
Figure \(\PageIndex{40}\): Part A - Mechanism for cofactor independent phosphoglycerate mutase (iPGM) from Geobacillus stearothermophilus (after Bolt et al, ibid)
Arg 261 interacts with the substrate, stabilizing the negative charge in it and its transition state. It also makes the target phosphorous more electrophilic. Ser62 is activated by a Mn2+ ion to become more nucleophilic on the abstraction of a proton by Lys336. Reaction 3 probably proceeds through an SN2 mechanism.
The rest of the mechanism is shown in Figure \(\PageIndex{41}\).
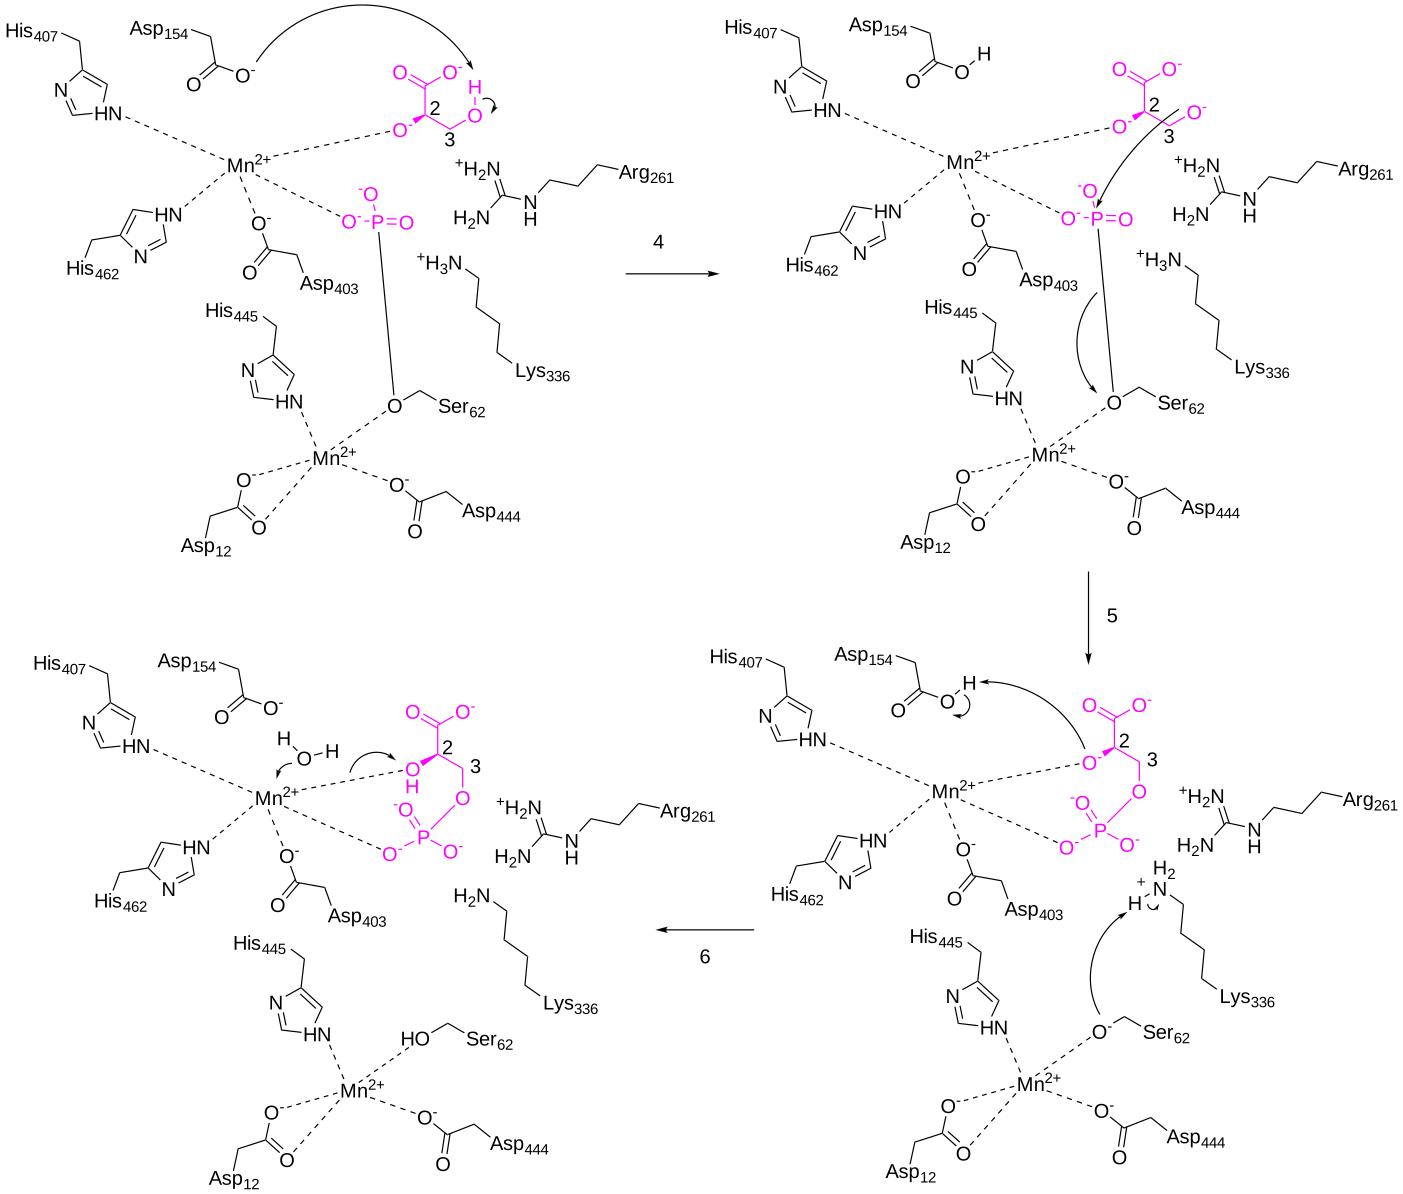
Figure \(\PageIndex{41}\): Part B - Mechanism for cofactor independent phosphoglycerate mutase (iPGM) from Geobacillus stearothermophilus (after Bolt et al, ibid)
The iPGMs are monomers with two distinct domains (lobes) containing a substrate binding site separated from an active site. They are connected by flexible sequences that bend to produce either an open or closed form of the enzymes (as we have seen before). In some enzymes, the two sites are merged at the interface between the domain. The active site Ser62 becomes phosphorylated and then transfers its phosphate to the new site in the substrate which is oriented differently in the enzyme.
Figure \(\PageIndex{42}\) shows an interactive iCn3D model of the Geobacillus stearothermophilus cofactor-Independent Phosphoglycerate Mutase (iPGM) with bound 2-phosphoglycerate (product) (1O98)
_(1O98).png?revision=1&size=bestfit&width=551&height=355)
Figure \(\PageIndex{42}\): Cofactor-Independent Phosphoglycerate Mutase with bound 2-phosphoglycerate (product) (1O98). (Copyright; author via source). Click the image for a popup or use this external link: https://structure.ncbi.nlm.nih.gov/i...71iYHXAEKMGsEA
Reaction 9: 2PG ↔ PEP + H2O ΔGo= +0.4 kcal/mol (+1.7 kJ/mol)
This reaction, catalyzed by enolase, is shown in Figure \(\PageIndex{43}\)

Figure \(\PageIndex{43}\: Summary reaction - enolase
Now you can see the rationale for reaction 8. With a simple dehydration, a molecule with high phosphoryl transfer potential has been produced which in the next and final step of glycolysis produces ATP.
This enzyme has an active site Mg2+ that is required for catalysis. Mammals have three forms of the enzyme, α-enolase (ENO-1) found in most tissues, β-enolase (ENO-3) found mostly in muscle, and γ-enolase (ENO-2) found in neurons. A possible mechanism for yeast enolase is shown in Figure \(\PageIndex{44}\).
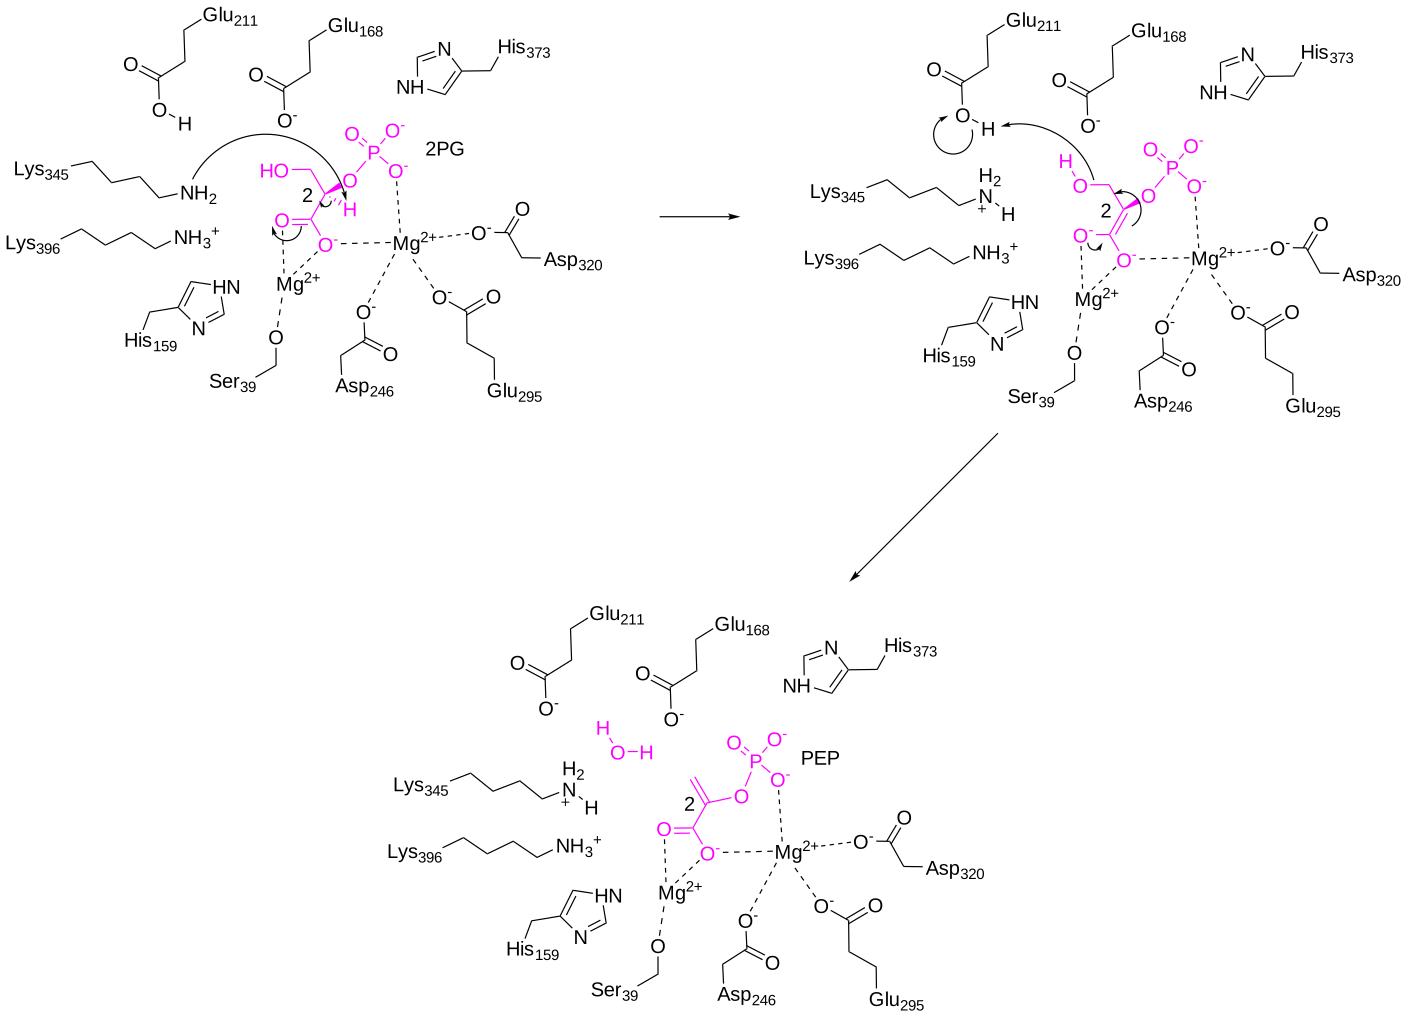
Figure \(\PageIndex{44}\): A possible mechanism for yeast enolase
Figure \(\PageIndex{45}\) shows an interactive iCn3D model of Yeast enolase with bound 2-phosphoglycerate (7ENL)
%25C2%25A0.png?revision=1&size=bestfit&width=507&height=363)
Figure \(\PageIndex{45}\): Yeast enolase with bound 2-phosphoglycerate (7ENL). (Copyright; author via source). Click the image for a popup or use this external link: https://structure.ncbi.nlm.nih.gov/i...TgwYV9vF8cYtPA
Reaction 10: PEP + ADP → Pyr + ATP ΔGo= -7.5 kcal/mol (-31 kJ/mol)
This reaction, catalyzed by pyruvate kinase, is shown in Figure \(\PageIndex{46}\)
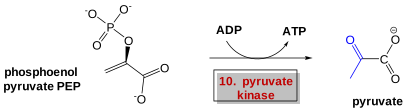
Figure \(\PageIndex{46}\): Summary reaction - pyruvate kinase
In this step, 1 more ATP is made for each PEP consumed (hence 2 ATPs for both 3C PEPs). The phosphoryl transfer potential for PEP is higher than for ATP, which allows this reaction to proceed with a large negative ΔGo (-7.5 kcal/mol, -31 kJ/mol).
The mechanism for rabbit pyruvate kinase is shown in Figure \(\PageIndex{47}\).
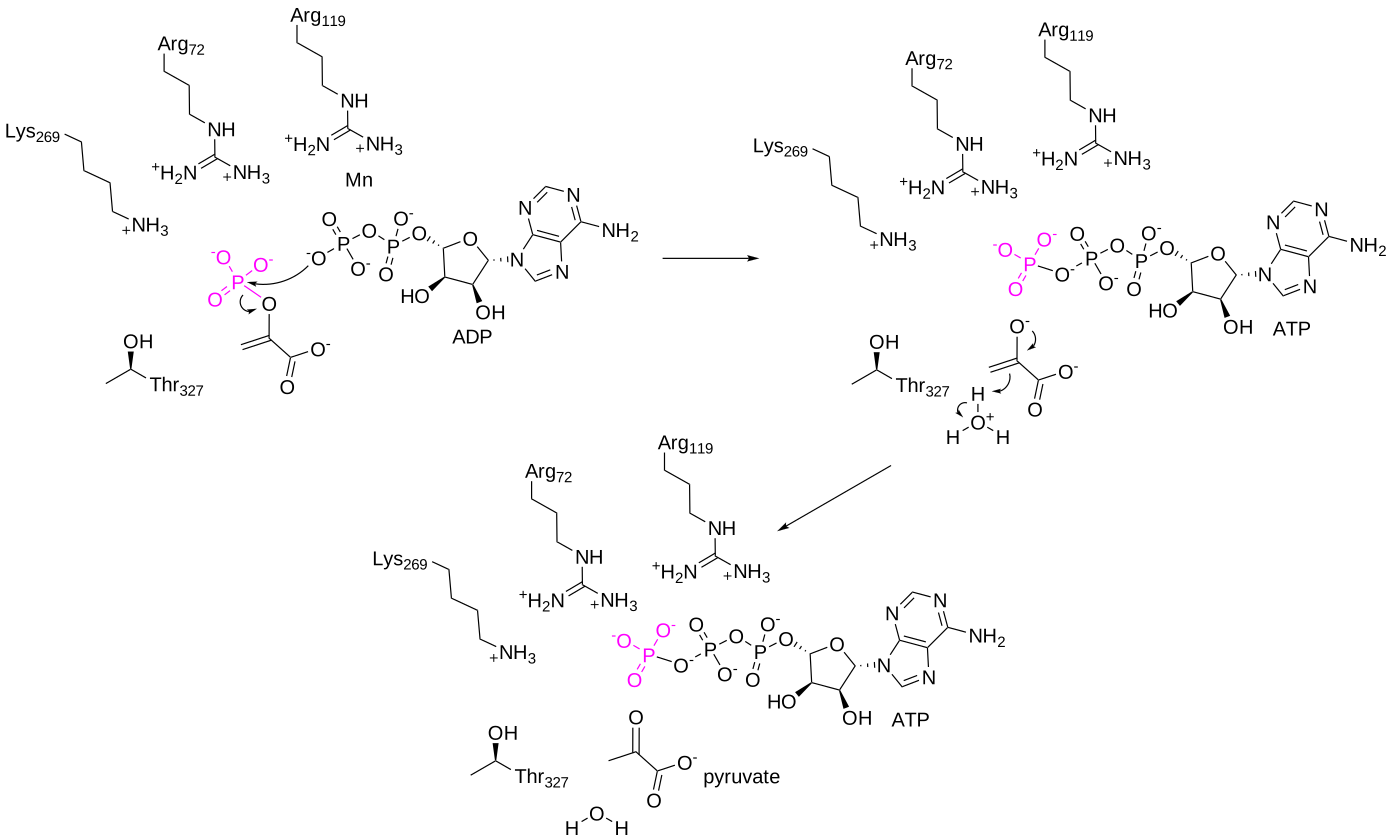
Figure \(\PageIndex{47}\): Mechanism for rabbit pyruvate kinase
Figure \(\PageIndex{48}\) shows an interactive iCn3D model of rabbit muscle pyruvate kinase complexed with Mn2+, K+, and pyruvate (1PKN)
.png?revision=1&size=bestfit&width=499&height=316)
Figure \(\PageIndex{48}\): Rabbit muscle pyruvate kinase complexed with Mn2+, K+, and pyruvate (1PKN). (Copyright; author via source). Click the image for a popup or use this external link: https://structure.ncbi.nlm.nih.gov/i...cZkm8DdEw2N3C6
We are done! Given that glycolysis is the central anaerobic energy-extracting pathway in all life, it is important that we examined each enzyme in detail.
This is the net reaction of the glycolytic pathway:
\[\ce{Glc + Pi + 2ADP + 2NAD^{+} -> 2 Pyr + 2 ATP + 2NADH + 2H^{+} + 2H2O} \nonumber \]
Uncoupling glycolytic oxidation and phosphorylation (ATP formation)
Since we are most interested in energy transduction at this point, let's consider just two important steps in glycolysis that directly lead to ATP synthesis. Only one oxidative step is found in this pathway, namely the oxidative phosphorylation of the 3C glycolytic intermediate glyceraldehyde-3-phosphate, to 1,3-bisphosphoglycerate, a mixed anhydride (see link below for mechanism). The oxidizing agent is NAD+ and the phosphorylating agent is NOT ATP but rather Pi. The enzyme is named glyceraldehyde-3-phosphate dehydrogenase. It contains an active site Cys, which helps explain how the enzyme can be inactivated with a stoichiometric amount of iodoacetamide. A general base in the enzyme abstracts an H+ from Cys, which attacks the carbonyl C of the glyceraldehyde, forming a tetrahedral intermediate. Instead of the expected reaction (which would be the protonation of the alkoxide in an overall nucleophilic addition reaction at the aldehyde), a hydride leaves from the former carbonyl C to NAD+ in an oxidation step. Notice, this is a two-electron oxidation reaction similar to that seen in alcohol dehydrogenase. An acyl-thioester intermediate has formed, much like the acyl intermediate that formed in Ser proteases. Next inorganic phosphorous, Pi, attacks the carbonyl C of the intermediate in a nucleophilic substitution reaction to form the mixed anhydride product, 1,3-bisphosphoglycerate. Although we have formed a mixed anhydride, we cleaved a sulfur ester, which is destabilized with respect to its hydrolysis products (since the reactant, the thioester, is not stabilized by resonance to the extent of regular esters owing to the poor donation of electrons from the larger S to the carbonyl-like C.) In the next step, catalyzed by the enzyme phosphoglycerate kinase, ADP acts as a nucleophile that attacks the mixed anhydride of the 1,3-bisphosphoglycerate to form ATP. Note that the enzyme is named for the reverse reaction. We have coupled the oxidation of an organic molecule (glyceraldehyde-3-phosphate) to phosphorylation of ADP through the formation of a "high" energy mixed anhydride, 1,3-bisphosphoglycerate.
The linkage between the oxidation of glyceraldehyde-3-phosphate and the phosphorylation of ADP by 1,3-bisphosphoglycerate can be artificially uncoupled by adding arsenate, which has a similar structure as phosphate. The arsenate can form a mixed anhydride at C1 of glyceraldehyde-3-phosphate, but since the bringing O-As bond is longer and not as strong as in the mixed anhydride, it is easily hydrolyzed. This prevents the subsequent transfer of phosphate to ADP to form ATP.
Figure \(\PageIndex{49}\) shows a summary of oxidation and substrate-level phosphorylation in glyceraldehyde-3-phosphate dehydrogenase.
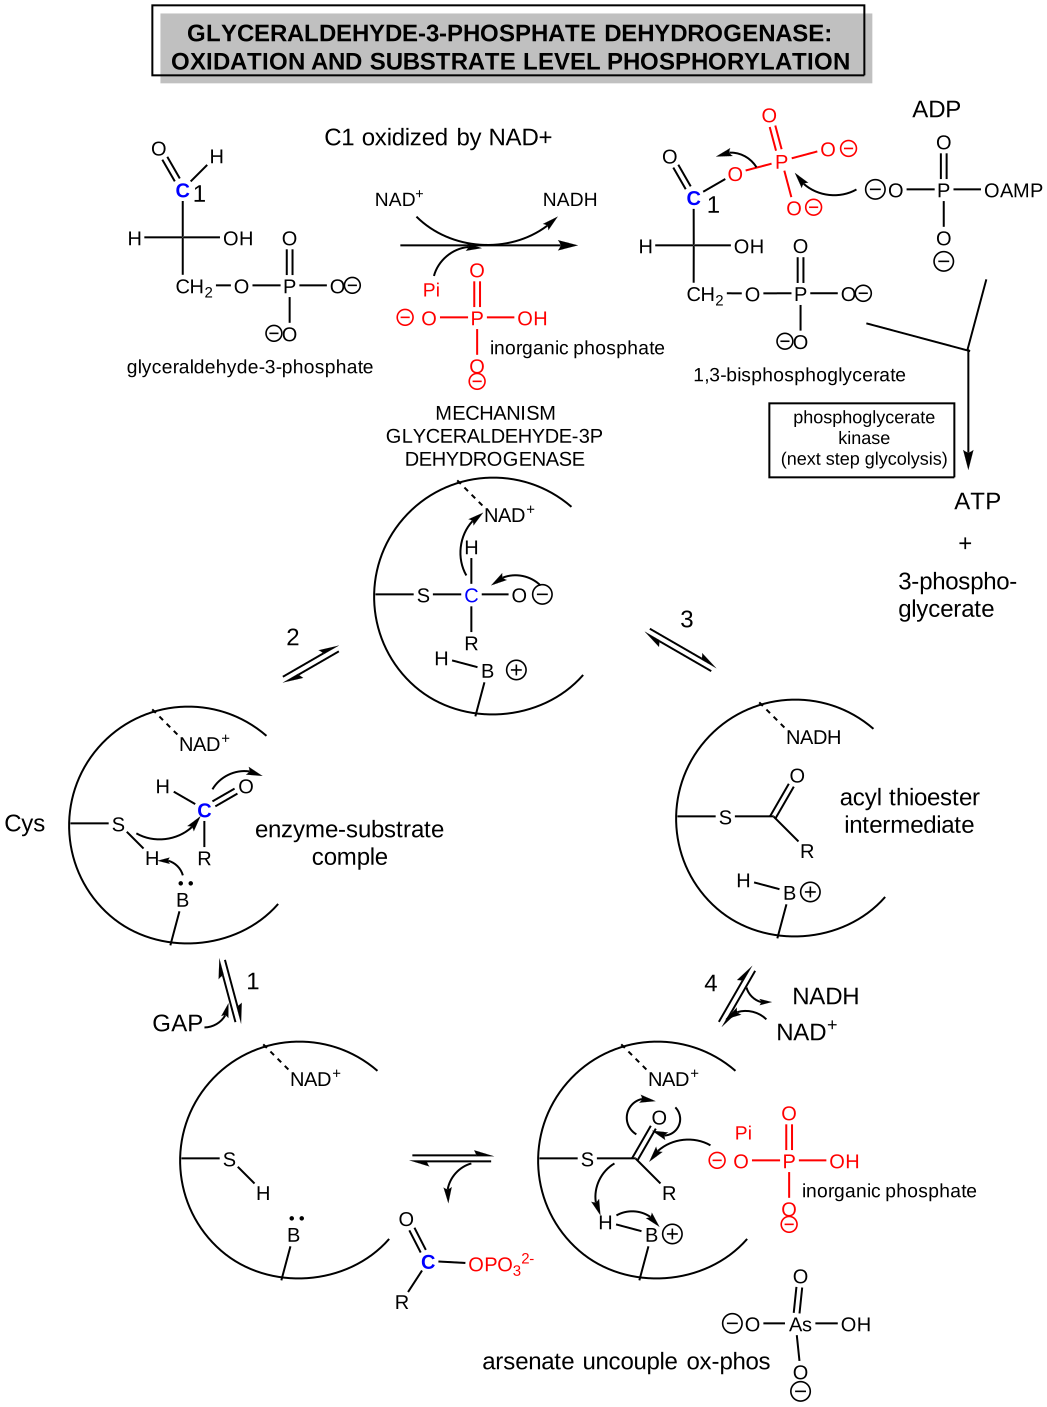
Figure \(\PageIndex{49}\): Oxidation and substrate-level phosphorylation in glyceraldehyde-3-phosphate dehydrogenase (after Voet and Voet)
Summary: Under anaerobic conditions, glucose (6Cs) is metabolized through glycolysis which converts it to two molecules of pyruvate (3Cs). Only one oxidation step has been performed when glyceraldehyde 3-phosphate is oxidized to 1,3-bisphosphoglycerate. To regenerate NAD+ so glycolysis can continue, pyruvate is reduced to lactate, catalyzed by lactate dehydrogenase. These reactions take place in the cytoplasm of cells actively engaged in the anaerobic oxidation of glucose (muscle cells for example during sprints). Note that t50}\).
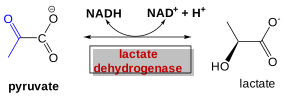
Figure \(\PageIndex{50}\): Conversion of pyruvate to lactate
We will explore the fate of pyruvate under anaerobic conditions more in the next chapter section.