
9: 9. Applied Population Biology
- Page ID
- 63239
9. Applied Population Biology
© 2019 J.W. Wilson and R.B. Primack, CC BY 4.0 https://doi.org/10.11647/OBP.0177.09

Staff from the Frankfurt Zoological Society (FZS) conducting an aerial survey over Selous Game Reserve, Tanzania. Photograph by Daniel Rosengren, https://commons.wikimedia.org/wiki/File:FZS_plane_conducting_an_aerial_survey_in_Selous_Game_Reserve,_Tanzania.jpg, CC BY 4.0.
Even without human influences, the size of any wildlife population may be stable, increasing, decreasing, or even fluctuating. These population changes, combined with occasional natural perturbations, can and have driven some species and populations to extinction. Such natural extinction events generally occur at local scales, and are interspersed by long periods of little change, so that overall ecosystem stability is not compromised. Moreover, as explained by the intermediate disturbance hypothesis (e.g. Bongers et al., 2009), localised disturbances and subsequent local extinctions play an important role in maintaining regional biodiversity, as they increase opportunities for a greater variety of species to live in an area (Figure 9.1), at least until succession drives them out again. Some species that colonise the empty niches left by extinctions or extirpations may even evolve to become new species over time.

Figure 9.1 A treefall gap allowing sunshine to penetrate the canopy in the sacred Bubi Forest on Bioko Island, Equatorial Guinea. Treefall gaps and other localised natural disturbances benefit regional biodiversity because they provide opportunities for a greater variety of species to eke out an existence. Responses do vary, however, from ecosystem to ecosystems: while fire disturbance maintains most grassland and savannah ecosystems, it has an overall negative impact on tropical forests. Photograph by Luke L. Powell/Biodiversity Initiative, CC BY 4.0.
Human-driven disturbances often occur at larger scales and more frequently than natural perturbations. Consider, for example, the large amount of natural forests that are converted to agricultural land every year, or climate change impacts that are affecting every ecosystem on Earth. Because these disturbances are so widespread and occur with such regularity, they are causing a wholesale destabilisation of the natural environment. Many species and populations are unable to cope with these fast and vast changes and are consequently undergoing sharp declines. The human-driven extinctions that follow are leaving compromised ecosystems more vulnerable to invasions by widespread generalist species and exotic species. What remains is an environment dominated by only a few species unable to offer many of the ecosystem services we depend upon. To prevent further harm, we need to identify the most vulnerable species and ecosystems and develop strategies that can slow or even reverse current extinction rates. But how can we identify the species most likely to go extinctions soon, and how can we determine which actions should be taken to save them? The field of population biology, defined as the study of population dynamics over time and space, provides us the tools to answer many of these questions.
9.1 Monitoring Population Size
The primary aim of population monitoring is to detect changes in the environment, population size, and species distribution over time. Such monitoring efforts frequently focus on a particular area or a population of concern, but it can also target more common but sensitive species, such as butterflies and macroinvertebrates, which can function as indicator species to assess ecosystem condition (Section 4.2.6). The great number of methods (which are all types of surveys) used to monitor populations usually fall into one of three different categories: biodiversity inventories, population censuses, and demographic studies.
9.1.1 Biodiversity inventories
A biodiversity inventory is an attempt to document which species are present in some defined locality. Such an effort can focus on one specific taxa (e.g. a bird survey) or several taxa, on a small area (e.g. a city park) or large area (e.g. a large national park), over a short period of time (e.g. a few hours) or long period of time (e.g. several years, Box 9.1). There are many methods to compile a biodiversity inventory, ranging from uncomplicated to highly organised, performed by a single person or a large team of experts. Some of the most popular methods for biodiversity inventories include site visits by professional naturalists and questionnaires distributed among local people. To tap into the knowledge and eagerness of amateur naturalists, conservation biologists are also increasingly compiling biodiversity inventories using citizen science surveys (see Box 15.3). Rapid biodiversity assessments (RAP) are sometimes used to compile an inventory under tight deadlines to answer urgent questions and inform urgent decisions. A bioblitz is a special type of biodiversity inventory during which experts on a range of taxa come together to record all the living species within a designated area over a brief period (usually over 24 hours).
Box 9.1 The Role of Biodiversity Inventories in the Management of Gorongosa National Park
1 Scientific Services, Gorongosa National Park,
Mozambique.
2 E.O. Wilson Biodiversity Laboratory, Gorongosa National Park,
Mozambique.
stalmans@gorongosa.net and pnaskrec@oeb.harvard.edu
The 4,000 km2 Gorongosa National Park in central Mozambique was proclaimed in 1960 to protect one of the highest densities of large herbivores at the southern end of Africa’s Great Rift Valley (Tinley, 1977). National Parks are often victims of war and political instability and Gorongosa National Park is no exception. It suffered grievously during the protracted period of civil war from the early 1970s to early 1990s. During this time the park lost 90–99% of its elephants, common hippopotamuses (Hippopotamus amphibious, VU), African buffalo (Syncerus caffer, NT), plains zebras, and common wildebeest (Connochaetes taurinus, LC) through poaching by warring parties and hunters from nearby cities and rural communities.
Since then, restoration efforts that started in earnest in 2004 have brought about a spectacular recovery of several affected large mammal populations (Bouley et al., 2018; Stalmans et al., 2019). But conservation management cannot only focus on these flagship species. Considering, amongst others, the impact of climate change and the importance of agriculture (with its associated pests and pollinators) to rural communities, it is vital that conservationists understand the breadth of biodiversity and its relationship to ecosystem functioning. To accomplish this, a programme of systematic biodiversity surveys is currently being undertaken in Gorongosa. Each year, a group of international and national specialists team up with park technicians and rangers to conduct a three-week long bioblitz in a subsection of the park. These surveys also serve as training opportunities to prepare young Mozambican scientists to apply modern biological survey methods and technologies.
By the beginning of 2019, a total of nearly 5,900 species represented by some 44,000 observations have been entered into the park’s biodiversity database. Based on these data, initial projections suggest that Gorongosa protects 37,500–76,500 different species. Vertebrates are likely to number 850–1,000 species, while plants are estimated to number 2,000–3,000 species. Single orders of insects far exceed those numbers; for example, there may be 3,000–5,000 species of wasps, and 4,000–6,000 species of moths of which 15–25% may be new to science. Local ecosystems are also particularly rich. For the surveys around the Bunga inselbergs (Figure 9.A) in 2015, at least 580 species of butterflies and moths were collected, most of them never before recorded from the Park. Forty species of katydids were recorded, with two species of significance. A large population of Debrona cervina, a large arboreal katydid was discovered, until now known only from two type specimens collected in 1890. Also collected was the predaceous katydid Peringueyella macrocephala, Mozambique’s largest katydid, previously known only from a handful of specimens collected between 1850 and 1965. About 100 species of grasshoppers were recorded, including two species new to science. Additionally, about 30 species of mantids were recorded, including Rhomboderella thorectes, a species previously known from the single holotype collected in the early 1900s. It is expected that the full inventory of the park’s biodiversity will span a period of 20 years.

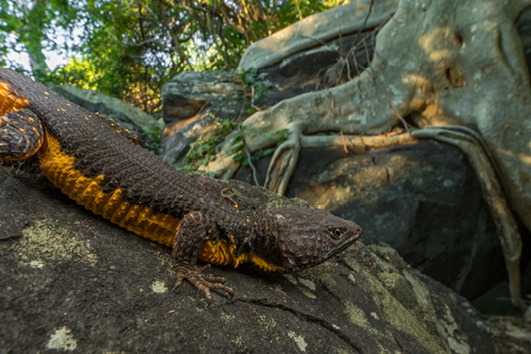
Figure 9.A Surveys in little-explored corners of Africa often yield biological discoveries. (Top) A recently described gecko species new to science, Afroedura gorongosa, discovered in 2015. (Bottom) The Mozambique girdled lizard (Smaug mossambicus) was previously known only from a small population on Mount Gorongosa and a single record in Manica province. Surveys in 2015 found a new population on Bunga inselberg. Photographs by Piotr Naskrecki, CC BY 4.0.
Biodiversity inventories play an important role in the management of Gorongosa and other national parks, especially in long-term conservation planning. Amongst others, baseline data obtained from our surveys will be used in future to measure overall biodiversity responses to large mammal population changes, evolving patterns of land use around the park, and the impact of climate change. Future biodiversity surveys will also target little known areas adjacent to the park to provide information required for corridor planning.
While biodiversity inventories seldom offer the kinds of detailed data required to predict likelihood of a species’ persistence, they have several uses in conservation. First, a biodiversity inventory can be a comparatively inexpensive and straightforward method to broadly monitor an area’s species and populations. Biodiversity inventories conducted over a wide area can also help determine the distribution of a species, while a comparison with follow-up inventories can highlight distribution changes (which often correspond to population changes). This was well illustrated in a study that used repeated citizen scientist surveys to investigate how songbird distributions have changed across South Africa, Lesotho, and eSwatini between 1987 and 2013 (Péron and Altwegg, 2015).
9.1.2 Population censuses
A population census (also called a count) uses a repeatable sampling protocol to estimate the abundance or density of a population or species which, in turn, can tell us whether a population is doing well or not. When a species is easy to detect, relatively sedentary, and the sampling area is small, a comprehensive census of all individuals may be possible. However, comprehensive censuses are generally very difficult, if not impossible, to conduct when implemented on large or highly mobile populations, or over large areas. In these cases, it may be better to restrict the census to a more manageable subsection of the population, by dividing the area of interest into sampling units, and randomly censusing only some of the units. Population estimates that capture only a fraction of the overall population can then serve as an index for broader trends, or it can be used to estimate the total population size through extrapolation, if the researcher knows which fraction of the population or area was counted.
Some popular methods for censusing subsections of wildlife populations are, sampling plots, distance sampling, and mark-recapture surveys. Sampling plots are popular in studies focussing on plants and invertebrates, allowing biologists to systematically count each individual observed in a small area (Figure 9.2). Birds and mammals are often censused using distance sampling, during which all observed individuals on predetermined transects or from points are tallied. The number of individuals observed in the count area can then be extrapolated to obtain population size (or density) estimates for individual (or multiple) species observed across the entire area of interest. Aerial censuses are often used to conduct distance sampling transects over large and open areas, while point counts and walked line-transects are more popular for small areas or closed-canopy ecosystems (White and Edward, 2000). Mark-recapture surveys, mark-resight surveys, and sight-resight surveys are popular for species that are easy to catch, trap, or individually recognised. In this case, captured (and thus counted) individuals would be marked for future identification, after which the total population in an area is estimated by accounting for the proportion of marked and unmarked individuals seen on subsequent visits. The marking of animals can be done with a variety of procedures, including using highly visible tags, paint approved for animal use, or unique marks on the animal itself. One creative study used tourists’ photographs to generate a mark-recapture dataset, which was used to estimate the size of cheetah and African wild dog (Lycaon pictus, EN) populations in South Africa’s Kruger National Park (Marnewick et al., 2014). Like inventories, population censuses can sometimes also lead to unexpected yet important findings: the first comprehensive population survey of sea turtles breeding on Africa’s Atlantic coast recently alerted marine biologists to the fact that Gabon hosts several globally important rookeries (Box 9.2).
Box 9.2 Sea Turtle Conservation along Africa’s Atlantic Coast
Wildlife Conservation Society,
Global Conservation Program,
New York, NY, USA.
aformia@wcs.org
Virtually all the characteristics of sea turtles’ life histories make them difficult to study and conserve. They are long-lived, slow growing, migratory, and almost entirely ocean-dwelling. Although they return to their natal beaches to reproduce, these are usually thousands of kilometres from their developmental and adult foraging grounds. In addition, sea turtle habitat often overlaps with areas of high human use such as developed coastlines and intensive fisheries. Describing population ranges and assessing interaction with human threats is thus critical to their survival.
Over recent decades, we have learnt much about sea turtles along the coastline of Africa (Figure 9.B) thanks to extensive research efforts. For instance, we know that these coasts host globally important populations of green turtles (Chelonia mydas, EN) in Mauritania, Guinea Bissau, Equatorial Guinea and Republic of the Congo; loggerheads (Caretta caretta, VU) on Cabo Verde; hawksbills (Eretmochelys imbricata, CR), on São Tomé and Principe; leatherbacks (Dermochelys coriacea, VU) in Equatorial Guinea and Gabon; and olive ridleys (Lepidochelys olivacea, VU) in Gabon and Angola.


Figure 9.B (Top) One of thousands of leatherback sea turtle females nesting in Gabon every year. Photograph by M.J. Witt, CC BY 4.0. (Bottom) An olive ridley turtle hatchling makes its way to sea on a northern Angolan beach where the local community ensures its protection. Photograph by A. Formia, CC BY 4.0.
One of Africa’s most remarkable sea turtle populations is Gabon’s leatherback rookery, the biggest in the world with as many as 15,000 to 41,000 nesting females (Witt et al., 2009). Gabon also hosts the largest olive ridley rookery in the Atlantic (Metcalfe et al., 2015), and foraging grounds for green and hawksbill turtles. Until the late 1990s, virtually nothing was known about these populations, other than the fact that eggs and adults were frequently collected for human consumption. Since then, a multi-pronged approach has been adopted to describe and protect Gabon’s sea turtles. Intensive coastal monitoring has allowed scientists to assess spatio-temporal trends in nesting frequency and abundance, and levels of nest-site fidelity and reproductive success. Using techniques, such as satellite telemetry, flipper tagging, oceanic modelling, and dispersal simulations, and genetic and isotopic analyses, researchers have been able to map sea turtle behaviour at sea, in Gabon’s coastal waters, and during post-nesting migrations to foraging grounds off South America and South Africa (i.e. Formia et al., 2006, Maxwell et al., 2011, Witt et al., 2011, Pikesley et al., 2018).
Building upon this knowledge, measures have been established to quantify and reduce the impact of threats to Gabon’s sea turtles. In 2002, the Gabonese government created a system of national parks and protected areas encompassing approximately 80% of Gabon’s sea turtle nests; in 2017, a new network of 20 marine protected areas (MPA) was officially created, covering 26% of Gabon’s territorial waters (Parker, 2017). Laws enacted in 2011 prohibit all hunting, capture, and commercialisation of sea turtles. Trained observers on-board industrial fishing vessels quantify sea turtle bycatch from bottom trawling and tuna seiners and reduce mortality by treating and releasing captured turtles. In addition, the Gabonese government now requires that all shrimp trawlers use turtle excluder devices (TED), aluminium grids sewn into the nets allowing sea turtles and other large bycatch to escape, while conserving shrimp catch; similar devices are being developed for fish trawlers. Ongoing efforts are shifting traditional turtle hunting and other destructive practices toward more sustainable fisheries. Turtle-watching ecotourism also represents a growing potential to increase awareness and incentivize conservation efforts.
Nevertheless, African sea turtle conservation remains a formidable challenge. Although the economic context is changing rapidly, impoverished coastal villagers in many countries continue to collect turtles and eggs for local consumption or market sale, and many wealthier urbanites continue to consider them delicacies. These problems are often compounded by corruption, political instability, inadequate law enforcement, and development priorities focused on destructive exploitation. With funding deficits, combating these challenges sometimes seems like a losing battle, but public attitudes are slowly shifting. Even in remote beach villages, the idea that a turtle alive is worth more than dead is no longer such a bizarre concept.
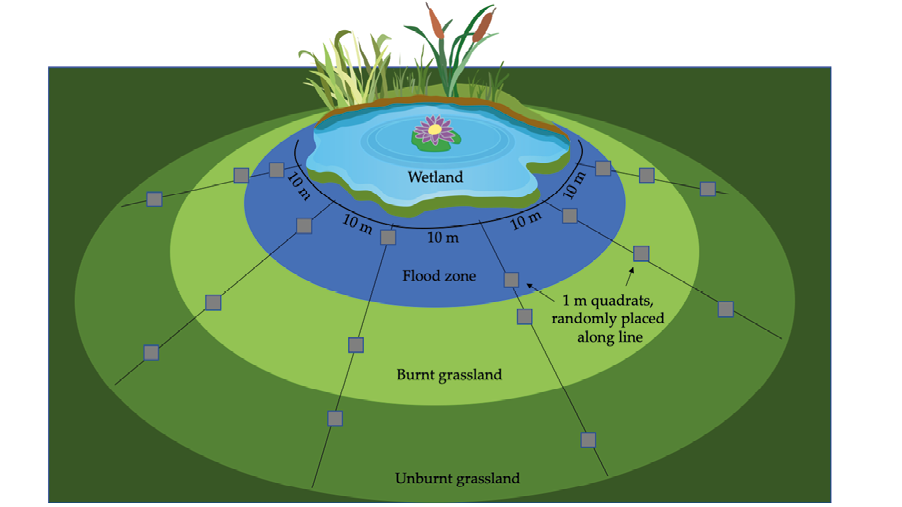

Figure 9.2 (Top) A schematic of a systematic sampling protocol using quadrat frames. Dividing a large area into smaller sampling units makes the survey task much more feasible. The survey can be performed in the field, or photos such as these can be taken for analysis once back at the office. CC BY 4.0. (Bottom) A quadrat frame divided into 10x10 cm squares, set out to monitor the species richness and abundance of plants in a grassland recovering from a fire. Photograph by Yohan Euan, https://commons.wikimedia.org/wiki/file:quadrat_sample.jpg, CC BY-SA 3.0.
9.1.3 Demographic studies
Demographic studies monitor individuals of different ages and sizes over time (Figure 9.3) to obtain a more comprehensive dataset than would be produced by population censuses. Most demographic studies use the same methods that what would be used for a population census; however, in addition to counting and marking, individuals would also be aged, measured for size and body condition, and sexed, when possible. The best demographic studies involve collecting these data from the same individuals over time, which is easiest when working with sedentary species (e.g. plants), populations in an enclosed space (e.g. in a small fenced reserve), animals that are fairly resident and/or habituated to human presence, or individuals carrying biologging devices (Kays et al., 2015). This may not always be possible, in which case biologists may obtain data from different individuals during each field session, to serve as an index for larger population trends.

Figure 9.3 A biologist gathering biometric data from a juvenile central African slender-snouted crocodile (Mecistops leptorhynchus, CR) in the DRC. The crocodile will be tagged with a permanent marker before release so it can be recognised when caught again. Accompanying the photo is an example of mark-recapture survey worksheet to estimate population size. Photograph by Terese Hart, CC BY 4.0.
The data obtained from demographic studies are often used in combination with mathematical modelling to guide and refine conservation strategies. For example, researchers frequently compare the age structure (i.e. the percentage of juveniles, reproductively active adults, and older post-reproductive-age adults) of a declining population to that of a stable population to identify causes of decline, and the population parameters that are most sensitive to disturbances. This information can then be used to predict population sizes at different points in the future, and how those populations may respond to different management scenarios. The aim of many demographic studies is to predict, and identify strategies to reduce, extinction risk (see Section 9.2).
9.1.4 Recent progress in collecting survey data
Conservation activities are regularly impeded by insufficient information. This is especially true in tropical regions of the world, where most threatened species lack demographic data, and some species lack reliable data altogether. Faced with these gaps, biologists have started using several innovative methods to fill data gaps. Prominent examples include using market surveys (e.g. Kümpel et al., 2010, Ingram et al., 2015) and interviews with local people (e.g. Edwards and Plagányi, 2008) to obtain much-needed baseline survey data. It is important to note that such datasets, obtained second-hand rather than directly, can be unreliable and biased, especially if data are collected from harvesters unwilling to report on their own illegal activities. It is thus important to combine potentially unreliable datasets with reliable datasets, or obtain independent verification, before using such data to make important decisions. One such example comes from West Africa, where researchers wanted to quantify extinction risk for the Nigeria-Cameroon chimpanzee (Pan troglodytes ellioti, EN). Here, biologists related unreliable market survey data to two reliable datasets—orphan intake rate at wildlife sanctuaries and the number of young in wild groups—to estimate that the region’s chimpanzees might be extinct within the next 20 years because hunting was two to 13 times higher than the population could sustain (Hughes et al., 2011).
Camera traps, hair snares, and faecal samples all provide non-invasive sampling techniques to obtain baseline data needed for conservation assessments.
Collecting genetic material on elusive and rarely-seen animals with non-invasive techniques such as hair snares and faecal sampling are also becoming increasingly popular means of collecting survey data. Researchers in Gabon did just that, by using genetic material obtained from dung to estimate the population size, gender ratio, age distribution, breeding status, relatedness, and dispersal patterns of the region’s forest elephant (Loxodonta cyclotis) population (Eggert et al., 2013). These non-invasive techniques reduce the need for researchers to be in the field, thereby reducing both the researchers’ exposure to dangerous conditions and disturbances to the populations they are trying to monitor.
Camera traps represent another non-invasive survey technique whose popularity has greatly increased in recent years. These special cameras, often placed at supplemental food or next to wildlife paths, are activated automatically when an animal passes into the area covered by the camera’s motion sensors (Figure 9.4). This photographic record of movement can then be used to obtain biodiversity inventories, population size estimations, or even to compile demographic datasets (Steenweg et al., 2017). Creative researchers at South Africa’s Robben Island even successfully combined camera trapping with human facial recognition technology—more generally associated with law enforcement—to automate monitoring of individual African penguins (Spheniscus demersus, EN) (Sherley et al., 2010).


Figure 9.4 (Left) A nature conservation student sets a camera trap in northern South Africa to monitor leopard (Panthera pardus, VU) and brown hyena (Parahyaena brunnea, NT) populations on a privately protected area. Photograph by Kelly Marnewick, CC BY 4.0. (Right) Congo peafowl (Afropavo congensis, VU)—a highly elusive species—investigating a camera trap in the DRC. Photograph by Lukuru Foundation, CC BY 4.0.
9.2 Estimating Extinction Risk
Biologists often use the positive relationship between population size and likelihood of persistence (Section 8.7) to predict the probability that a population may go extinct at some point in the future. One of the most popular tools for making such predictions is population viability analysis (PVA). A PVA can be thought of as a type of extinction risk assessment; it uses demographic data and mathematical methods to predict at what point in the future a population or species is likely to perish. In addition, by considering a species’ resource requirements and the availability of limiting resources, biologists can use the results of a PVA to identify a species’ most vulnerable life stages, and to estimate how management techniques may influence population size and extinction risk. In this way, PVAs can guide conservation decisions by highlighting the need to, for example, modify harvesting regulations, perform translocations (Section 11.2), or provide and protect a greater amount of suitable habitat. Even the IUCN’s Red List Criteria (Section 8.5) uses PVA as a criterion to help prioritise conservation targets: populations with low extinction risk may not require immediate attention, while those approaching extinction thresholds will gain higher priority.
9.2.1 A word of warning
The purpose of this chapter is to provide a brief introduction on the usefulness of quantitative population biology methods such as PVA in conservation. While the methods for studying population sizes, fluctuations, and demographics are very powerful, they are also highly technical, and require specialist knowledge of mathematical procedures. Erroneous predictions from using incorrect methods, violating assumptions, and/or using inadequate data would run counter to well-intentioned objectives; and so, the increased popularity and use of PVA by insufficiently trained conservation scientists is of serious concern. For many people, the methods highlighted in this chapter are best learned by studying under the supervision of an expert, to better understand each model’s assumptions and the newest developments in the field. For people with advanced mathematical skills who might want to study more on their own, texts such as Quantitative Conservation Biology (Morris and Doak, 2002) and Bayesian Methods for Ecology (McCarthy, 2007) may help. The development of user-friendly software packages, such as VORTEX and RAMAS (reviewed in Brook et al., 2000), have also expanded the PVA user-group in recent years. Nonetheless, when obtaining results—even from seasoned demographic modellers—it is important to remember that we cannot account for all future possibilities. Interpreting the results of a PVA, as any other model predicting the future, requires a great deal of caution and a healthy dose of common sense.
9.2.2 Probability of extinction
Population viability analysis (PVA) uses demographic data and mathematical methods to predict if a population or species is likely to persist or perish.
The main purpose of a PVA is to estimate the viability (or time to extinction) of a species or population from observed population sizes and growth rates. Consider a population with 100 individuals that loses 50% of its individuals each year. A simple model will suggest that this population will lose 50 individuals the first year, 25 individuals the second year, and so on, until no individuals are left in the seventh year. The probability of extinction for this population is thus 100%, and the time to extinction is seven years. But how do we deal with the more realistic complex variations in population sizes we see in nature?
A more realistic PVA begins by constructing a mathematical model representing the population of interest using data obtained from a demographic study, which may include the current age (or size) structure of the population, average birth rates, and average survival rates of each age class. This dataset would be organised in a format suitable for PVA modelling using a database package, and then analysed using the methods of matrix algebra. Because results from this initial model have only one outcome—a population that is either stable or growing/declining at a fixed rate—it is called a deterministic model. Typically, deterministic models are then tailored to include a variety of independent environmental parameters, such as food availability, storm frequency, or invasive competitors. Variability can also be added into the model by allowing some or all the model elements (e.g. survival rate or habitat availability) to vary within their observed ranges of values. Catastrophic events, such as a fire that kills a large proportion of the population, can also be programmed to occur at random points in time. Hundreds or even thousands of simulations of this complex model can then be run to determine changes in population size over time, the probability of population extinction within a certain period, and the median time to extinction. Because of the variability built into this more complex model, each iteration’s output will vary from the next; for that reason, it is called a stochastic model. The choice of models and the parameters included depend on the goals of the analysis and the management options under consideration.
9.2.3 Minimum viable population
When a PVA shows that a population has a relatively high risk of extinction, a logical next step would be to determine what could be done to prevent the extinction from happening. In general, protecting larger populations reduces extinction probability (Figure 9.5). To understand exactly how large is large enough, a PVA can also be used to estimate a minimum viable population (MVP). As the name implies, an MVP is the smallest number of individuals necessary for a population to have a chance of long-term persistence, despite the potential effects of demographic, environmental, and genetic stochasticity, and natural catastrophes faced by small populations (Section 8.7). This is well illustrated in the influential paper by Shaffer (1981), who compared setting MVP targets to planning for floods; engineers cannot rely on the average annual rainfall when designing flood control systems near rivers and wetlands. Instead, they must design systems that can also handle extreme rainfall and flooding events. These extreme events may occur rarely, perhaps once every 50 years, but they will likely occur during the lifetime of a flood control system. Similarly, to maximise the long-term protection of a threatened species, we must take actions that protect them in both average and extreme years characterised by catastrophic events such as cyclones/hurricanes, forest fires, and disease epidemics (Anderson et al., 2017). This is especially true considering future climate change scenarios, where every year may be uncharacteristically harsh, in effect a 50-year event.
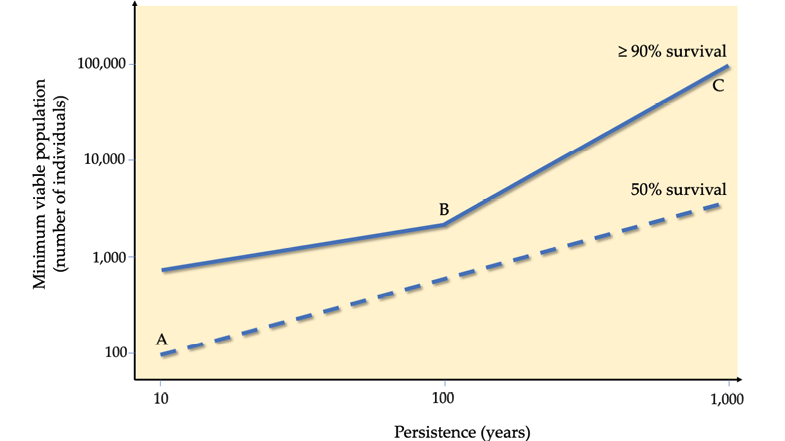
Figure 9.5 A graph (both axes on log scales) derived from a meta-analysis including 1,198 species showing how a larger minimum viable population (MVP) size translates to a higher likelihood of persistence over time. (A) If the goal is for 50% chance of persistence after 10 years, 100 individuals are required; (B) If the goal is for 90% chance of persistence after 100 years, 3,000 individuals are required; (C) If the goal is for 90% chance of persistence after 1,000 years, 100,000 individuals are required. After Traill et al., 2010, CC BY 4.0.
Several studies have attempted to come up with a “universal” MVP value that could ensure that a population of any species has a reasonable chance of persistence. The estimates vary greatly. For example, a universal MVP estimate from the 1980s, the “50/500 rule”, suggested that at least 50 individuals are necessary to prevent inbreeding, and 500 to prevent genetic drift (Frankham et al., 2014). While this 50/500 rule is currently used to guide the IUCN Red List Criteria for small populations (see e.g. Table 8.1, Criteria D), more recent studies suggested that this estimate is much too low. For example, one study that considered over 1,000 species calculated that 1,377 individuals must be protected to ensure the survival of the population and species (Brooke et al., 2006). Another study argued that 4,169 adults needed to be protected (Traill et al., 2007), while a third study identified 7,316 adults as the universal MVP (Reed et al., 2003). The reason why these estimates are highly variable is because MVPs are context specific, with the results varying greatly by species, location, and degree of threat (Flather et al., 2011). For some species, it might be necessary to protect large numbers of individuals—maybe thousands or tens of thousands for invertebrates and annual plants with that can experience large population size fluctuations. For other species, such as those that are long-lived and reproduce regularly, protecting only a few hundred individuals may suffice. Unfortunately, many threatened species have population sizes much smaller than any of these recommended minimums. For example, half of the 23 surveyed elephant populations remaining in West Africa have fewer than 200 individuals (Bouché et al., 2011), a number considered to be vastly inadequate for their long-term survival, especially in the absence of strong conservation management.
While a universal MVP value will probably never be agreed upon, species and location specific MVP estimates have great value for guiding conservation efforts. For example, it can suggest the minimum number of individuals that need to be released to improve chances of reintroduction success (Section 11.2). MVP estimates can also be combined with a species’ home range requirements to determine a minimum dynamic area (MDA), which is the smallest area of suitable habitat required to sustain the MVP. The use of MVP and MDA, and factors influencing it, were well illustrated in several studies on South Africa’s fragmented cheetah (Acinonyx jubatus, VU) population. Here, researchers originally found that translocations every 1–5 years can greatly improve the likelihood of persistence for 20 subpopulations with at least 10 cheetahs each, or for 10 subpopulations with at least 15 cheetahs each (Lindsey et al., 2009). But a follow-up study then showed that these results were context specific, and highly dependent on the presence of other predators that compete for the same prey (Lindsey et al., 2011). With no competitors, a minimum dynamic area of 200 km2 would be sufficient to support 10 cheetahs. However, a reserve of at least 700 km2 would be needed for 15 cheetahs and 15 lions, and even more if other competitor carnivores are present.
Because of the close relationship between population viability and habitat availability, these two factors are often considered together in population and habitat viability assessments (PHVA).
Because of the close relationship between population viability and habitat availability, these two factors are often considered together in population and habitat viability assessments (PHVA, http://www.cpsg.org/our-approach/workshop-processes/phva-workshop-process). Such an assessment was recently performed for Sierra Leone’s western chimpanzees (Pan troglodytes verus, CR), where 53 conservation partners came together to develop a recovery plan for this highly threatened species (Carlsen et al., 2012). As an illustration of how conservation projects can bring people from different walks of life together, the participants for this PHVA came from universities, government, NGOs, and the private sector, and included Paramount Chiefs, representatives from the UN and Sierra Leone’s government ministries, and well as experts in tourism, communications, population modelling, and wildlife rehabilitation.
9.2.4 Effective population size
One of the most important considerations when estimating MVPs is deciding which individuals to include in the calculations. Because population viability depends greatly on a population’s ability to produce young to increase in size (or at least balance out mortality), it makes sense that reproductive status is important in MVP estimations. For that reason, biologists often calculate MVPs using the effective population size (Ne), an estimate of how many individuals or pairs in a population are actively breeding. Consider, for example, a school of 1,000 dolphins; it might have 990 immature individuals and only 10 mature dolphins (five males and five females) that are actively breeding. Even though the full population consists of 1,000 dolphins, the effective population size is only 10—just the mature breeding dolphins.
A population’s effective size is often much smaller than the total population size because not all individuals are capable of breeding at any one time.
It is worth noting that the effective population size may sometimes be even smaller than the number of individuals capable of breeding at any one time. Factors that cause such a scenario include unequal sex ratios, variation in reproductive output, or an inability to find mates. Health status may also play a role; for example, many long-lived seabird species will forego breeding in years where adults did not attain a necessarily healthy body condition, or years when food is scarce (Crawford et al., 2008). Such reduced effective population sizes can lead to drastic population declines, especially when unsuitable conditions persist over consecutive years.
It is also important to remember that the individuals included in effective population size are not the only ones deserving conservation attention. For example, while young animals may not immediately contribute to population growth and stability, they remain a conservation priority for their potential to contribute to population viability in future. Protecting non-reproductive individuals is also important to avoid having cooperative breeders such as African wild dogs (Lycaon pictus, EN) succumb to Allee effects (Section 8.7.2). Individuals that forego reproduction because of poor body condition (e.g. malnourished individuals) can easily become reproductive, and contribute to population viability, if their stressors are mitigated. Lastly, for many species (e.g. many plants, fungi, bacteria, and protists), many (sometimes all) individuals may be dormant for long periods in the soil as seeds, spores, tubers, or other structures. While these dormant individuals may not be part of the effective breeding population, they still contribute to population viability in the long term.
9.2.5 Maximum sustainable yield
A population’s maximum sustainable yield provide an estimate of the greatest number of individuals that can be harvested without detriment to the population.
An important but under-utilised benefit of PVAs is the ability to help conservation managers estimate sustainable harvest rates for wildlife populations at risk of overharvesting (Milner-Gulland and Rowcliffe, 2007). Many threatened species can withstand some level of harvesting, so long as harvest rates are lower than recruitment rates. To estimate the sustainable level of harvesting, biologists may use PVA to estimate a population’s maximum sustainable yield—the greatest number of individuals that can be harvested without detriment to the population (Box 9.3). When estimating maximum sustainable yields for overharvested taxa, it is important to consider not only the total population size (or effective population size), but also harvesting biases produced by harvester preferences and techniques. For example, when estimating hunting quotas, hunter preferring larger animals (Lindsey et al., 2013; Barthold et al., 2016) and animal behaviour (Caro et al., 2009) can significantly influence model output. Also, in fisheries management, it is important to consider the outsized role older and larger fish play in recruitment rates, or the indirect damage fishing does the environment or to juvenile individuals (De Leo and Micheli, 2015). Lastly, it is important to consider how harvesting right at maximum sustainable yield levels may leave those populations less buffered to future disturbances (Cumming and Cumming, 2015)—it is thus advisable to maintain harvest quotas well below maximum levels.
Box 9.3 Sustainably Harvesting Fruit Bats Through Better Understanding of Life Histories
Molecular Epidemiology and Public Health Laboratory,
Hopkirk Research Institute, Massey University,
Palmerston North, New Zealand.
d.t.s.hayman@massey.ac.nz
“Full-time hunters are employed to shoot them […] Nothing is known about the natural factors that encourage or repress population growth in the straw-coloured fruit bat, or on what age category these factors have maximum effects. […] No laws, customs or taboos protect the straw-coloured fruit bat from exploitation […].
Funmilayo, 1978
Funmilayo’s comments from the 1970s still ring true about the problems currently facing straw-coloured fruit bats (Eidolon helvum, NT) throughout their African distribution range. The species is hunted widely in West and Central Africa (Figure 9.C), with scientists estimating that over 128,000 and up to 306,000 individuals are killed annually in Ghana (Kamins et al., 2011) and Côte D’Ivoire (Niamien et al., 2015). In Ghana, the population “is hunted far beyond maximum sustainable yield”, concluded an initial study that predicted maximum sustainable yield based on population sizes and estimated intrinsic rate of increase (Kamins et al., 2011). This overhunting has been going on for a long time. Notes from a 1909 field trip to DRC reported them hunted in the “hundreds” (Allen et al., 1917).


Figure 9.C (Top) Smoked straw-coloured fruit bats, an important source of protein in many parts of Africa, for sale at a local market in Ghana. (Bottom) Straw-coloured fruit bats at their daytime roost. Photographs by D. Hayman, CC BY 4.0.
Despite these reports of intensive harvesting, straw-coloured fruit bats remain abundant with colonies comprised of several million individuals often reported. The species is also highly mobile, migratory, and panmictic, breeding freely across its continental distribution (Peel et al., 2017). These life history traits make it difficult to determine how hunting is impacting the population because presence and size of colonies are highly variable in space and time (Hayman and Peel, 2016).
What can the natural history of the species tell us about their possible vulnerability to the pressures inherent of being hunted? Straw-coloured fruit bats exhibit classic life history traits of long-lived species. These bats invest time and energy into single, well-developed pups that they nurse and carry, as Funmilayo noted, “until they are capable of independent existence, which gives [the pup] a high chance of survival”. This investment in individual young and single annual breeding events means that straw-coloured fruit bats are susceptible to over-harvesting.
Good information on birth and death rates are required to accurately assess the impact of harvesting. Hayman et al. (2012) estimated birth rate and survival probability parameters in a single colony of up to 1 million straw-coloured fruit bats that roost in trees in Accra, Ghana, demonstrating the feasibility of obtaining such information. Histological examination of tooth growth layers allowed age estimation and life-table analyses to estimate an annual survival probability for juveniles of 43% and adults of 83%. Mark-recapture data using radio-collar telemetry and multi-state models to address confounding emigration estimated lower annual adult survival probability, c. 63%. True survival probabilities likely exist between these estimates, as follow up studies from four further locations suggest (Hayman and Peel, 2016), because permanent emigration may underestimate capture–recapture estimates and population decline may bias life table estimates. Birth rates for the species are high (0.96 young per female per year). Improved estimation of these key parameters will allow for critical analyses of harvest sustainability of straw-coloured fruit bat populations in future.
9.2.6 Sensitivity analysis
A particularly useful feature of PVA—and models in general—is that model parameters can be individually evaluated to better understand the implications of different management strategies. This is usually accomplished with a sensitivity analysis, a method that determines which parameter or combination of parameters has the biggest influence on population viability. Obviously, parameters that greatly influence population viability should become the focus of conservation efforts, whereas parameters that have a minimal effect can be given less attention. Some of the most popular model parameters to investigate are demographic parameters by age class, which can identify which life stages are most sensitive to conservation management. Such a sensitivity analysis might reveal that slight changes in adult mortality rates greatly affect population viability, whereas relatively large changes in juvenile recruitment rates have a minimal impact. Crouse et al. (1987) obtained such a result in their classic study on loggerhead turtles (Caretta caretta VU) living off the USA’s Atlantic coast. At the time, great effort was invested in improving hatching success and ensuring that hatchlings to reach the sea. However, Crouse’s study showed that, even if 100% egg and hatchling success was achieved, sea turtles will remain threatened unless adult survival were also improved. Results from this study subsequently played a significant role in initiating global efforts to reduce sea turtle bycatch during fisheries operations (see e.g. Fennessy and Isaksen, 2007; Ayinla et al., 2011).
9.3 Challenges to PVA Implementation
9.3.1 Lack of adequate data
Population biologists often require several years of survey data to distinguish long-term population trends from “model noise”—short-term population fluctuations caused by weather and other unpredictable events (Figure 9.6). For that reason, general guidelines suggest that at a minimum, six (Morris and Doak, 2002) to 10 (McCarthy et al., 2003) years’ worth of population data are required before a PVA is attempted.
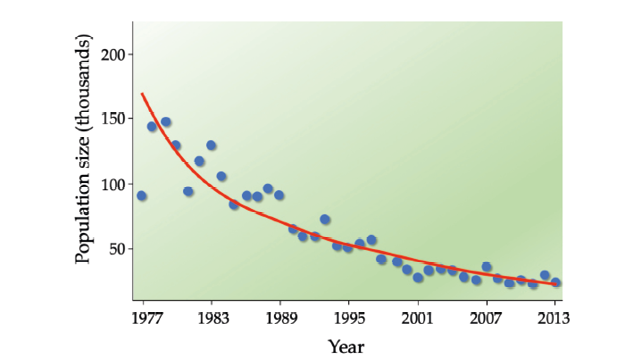
Figure 9.6 It often takes several years of data to distinguish long-term population trends from the “noise” caused by short-term fluctuations. In this example, it appears as if Kenya’s topi (Damaliscus lunatus jimela, VU) population size is relatively stable, and sometimes even increasing, between 1977 and 1989. However, the 82% decline is unmistakable when long-term trends are considered. After Ogutu et al., 2016, CC BY 4.0.
In recent years, considerable effort has been invested in collating, summarising, and making available demographic datasets. One example is the Demographic Species Knowledge Index (Conde et al., 2019) meant to summarise demographic data obtained from ex situ conservation facilities (Section 11.5). Nevertheless, most African species continue to lack multi-year datasets, while many threatened species lack reliable survey data altogether. Because the enormous task of filling these data gaps is impractical, there is a need to be strategic as to which populations to consider for PVA purposes. For example, it does not make sense to conduct a PVA on each species in a threatened ecosystem when a few carefully selected indicator species will suffice to monitor ecosystem health (McGeoch et al., 2002). Other priorities for PVA efforts include (1) species harvested by humans, (2) species most sensitive to ecosystem changes, (3) species with the greatest uncertainty regarding viability, and (4) species that are the focus of current management efforts (Wilson et al. 2015).
But even in the absence of reliable and complete datasets, PVAs can still be useful. For example, sensitivity analysis can inform future data collection efforts, particularly to fill gaps that lead to high levels of uncertainty, or to verify data accuracy for particularly sensitive parameters.
9.3.2 Data reliability
While strategically filling data gaps should be a priority, it should not come at the expense of data quality and reliability. Many—perhaps most—population monitoring programmes are poorly designed (Buckland and Johnston, 2017), leading to biased data, poor survey precision, and misleading results. Poorly designed surveys not only waste valuable time and resources, but the erroneous results also seriously hamper conservation efforts.
To overcome these shortcomings, there are five criteria that a well-designed monitoring programme should satisfy (Buckland and Johnston, 2017). First, survey sites should represent the region or species of interest. Second, a sufficiently large number of monitoring sites should be chosen. Third, monitoring programmes should be set up that every target species—whether common or rare—is adequately counted. Fourth, species selected for monitoring should represent the community of interest, rather than charismatic species that are easily detected. Fifth, multiple surveys need to be conducted over time to detect long-term population trends. Given resource constraints, some compromises in survey design may at times be required. It may also be worth considering the use of citizen scientists and new technologies such as camera traps (Section 9.1.4) to improve data collection efficiency and to provide back-up evidence of reported species for follow-up expert review, if needed.
9.3.3 Model reliability
While PVAs can provide reasonably accurate predictions when based on reliable data (Brook et al., 2000; McCarthy et al., 2003), many conservationists continue to be sceptical of PVA results and their ability to predict future population changes over time (Crone et al., 2013). Part of the reason is our inability to accurately account for unanticipated future events, such as unusual weather events or the arrival of a new invasive species. There are also mechanistic challenges to PVA modelling, including their sensitivity to model assumptions and slight changes in model parameters i.e. slight changes in model input generate vastly different results. For this reason, some biologists have started to discourage the use of PVAs in conservation management, especially when faced with inadequate data (Ellner et al., 2002).
While this scepticism is important and model interrogation should always be welcomed (both aspects usually lead to model improvements), PVA will continue to play a crucial role in conservation in the foreseeable future. It is however important for biologists using PVA to be familiar with the challenges associated with model reliability, as well as the assumptions and limitations of each PVA model. It always helps to begin any PVA model with a clear understanding of the ecology of the target population, the threats it faces, and its demographic characteristics, which in turn enables the modellers to better evaluate model results.
9.4 Summary
- Protecting a threatened species requires a firm grasp of its population biology. Long-term monitoring using biodiversity inventories, population censuses, and demographic studies can reveal temporal changes in population size and distribution and help to distinguish short-term fluctuations from long-term decline.
- Biologists are increasingly relying on innovative methods to track wildlife populations and demographics. Among the most popular are market surveys, hair snares and faecal sampling, while photos taken by tourists and camera traps have also been used to obtain population-level data.
- Population viability analysis (PVA) uses demographic, genetic, and environmental data to predict changes in population sizes and extinction risk over time. Sensitivity analysis can be used to guide conservation action by estimating how different management actions will affect a population’s extinction probability.
- Minimum viable population estimates can be used to determine how many individuals are needed to reduce the threat of extinction, while maximum sustainable harvest estimates can be used to set harvest limits on species threatened by overharvesting.
- Many surveys are poorly designed, leading to biased data, poor survey precision, and misleading results, which hamper our ability to halt biodiversity losses. To overcome these challenges, surveys should be representative, sufficiently large, and conducted repeatedly over time.
9.5 Topics for Discussion
- Read the manuscript by Pfab and Witkowski, (2000), which is a PVA study that is relatively easy to understand. Can you identify some strengths and weaknesses of this PVA? Which assumptions did this study make? What parameters were used? Are there any other model parameters you think could have been useful?
- For this exercise, you are going to construct a simple PVA for a threatened frog species on a sheet of paper. This frog formerly occupied an expansive lowland forest, which over time was disturbed and degraded. A recent survey was able to find only ten frogs (five males and five females), all in one small, isolated forest patch that can accommodate up to 20 frogs. In the spring, males and females form mating pairs; each pair typically produce zero, one, two, three, or four, offspring that survive to breeding age the following year (to create this demographic dataset, flip four coins for each mated pair; the number of heads is the number of offspring). The sex of the offspring is assigned at random (flip a coin for each young animal, with heads for males and tails for females. Individuals not mated because of uneven sex ratios do not breed. After the breeding season, all the adult frogs die. (A) Run five different population simulations for five generations each, and chart population size over time. What percentage of populations would go extinct within the 10 generations? (B) Perform a sensitivity analysis by making the frogs’ living conditions more severe. For example, lower the number of frogs found during the survey to six, or impose 50% mortality on offspring every year due to introduced rats. (C) Perform another sensitivity analysis by making the frogs’ living conditions more accommodating. For example, examine the impact of supplying extra food to the frogs, which would allow more offspring to be produced each year. Examine the results of all your different models to determine which factor is most important to address to ensure the frog species does not go extinct.
9.6 Suggested Readings
Anderson, S.C., T.A. Branch, A.B. Cooper, et al. 2017. Black-swan events in animal populations. Proceedings of the National Academy of Sciences 114: 3252–57. https://doi.org/10.1073/pnas.1611525114 Ignoring extreme weather events may severely underestimate extinction risk.
Buckland, S.T., and A. Johnston. 2017. Monitoring the biodiversity of regions: Key principles and possible pitfalls. Biological Conservation 214: 23–34. https://doi.org/10.1016/j.biocon.2017.07.034 Five principles for reliable surveys.
Danielsen, F., N.D. Burgess, P.M. Jensen, et al. 2010. Environmental monitoring: The scale and speed of implementation varies according to the degree of peoples’ involvement. Journal of Applied Ecology 47: 1166–68. https://doi.org/10.1111/j.1365-2664.2010.01874.x Involving the local community in environmental monitoring increases the speed of conservation actions.
Guschanski, K., L. Vigilant, A. McNeilage, et al. 2009. Counting elusive animals: Comparing field and genetic census of the entire mountain gorilla population of Bwindi Impenetrable National Park, Uganda. Biological Conservation 142: 290–300. https://doi.org/10.1016/j.biocon.2008.10.024 Genetic techniques are providing new opportunities for studying populations.
Jewell, A. 2013. Effect of monitoring technique on quality of conservation science. Conservation Biology 27: 501–08. https://doi.org/10.1111/cobi.12066 The methods that researchers use to tag and monitor species can affect and sometimes even harm the species being studied.
Mascia, M.B., S. Pailler, M.L. Thieme, et al. 2014. Commonalities and complementarities among approaches to conservation monitoring and evaluation. Biological Conservation 169: 258–67. https://doi.org/10.1016/j.biocon.2013.11.017 Describes different objectives in monitoring, with a goal of developing standard procedures for evaluating projects.
Sebastián-González, E., J.A. Sánchez-Zapata, F. Botella, et al. 2011. Linking cost efficiency evaluation with population viability analysis to prioritize wetland bird conservation actions. Biological Conservation 144: 2354–61. http://doi.org/10.1016/j.biocon.2011.06.015 Different management approaches are evaluated for their cost effectiveness on bird populations in Spain.
One of the following two texts:
Bibby, C., M. Jones, and S. Marsden. 1998. Expedition Field Techniques: Bird Surveys (London: Royal Geographic Society). http://www.conservationleadershipprogramme.org/media/2014/09/Bird_Surveying_Manual.pdf Methods for conducting biological surveys. Written on birds, but applicable to other taxa.
White, L., and A. Edwards. 2000. Conservation Research in the African Rain Forests: A Technical Handbook (New York: WCS). http://apes.eva.mpg.de/eng/pdf/documentation/WhiteEdwards2000 Methods for obtaining data on animals and their environment. Written for forest work, but also applicable in other ecosystems.
Bibliography
Allen, J.A., H. Lang, and J.P. Chapin. 1917. The American Museum Congo Expedition Collection of Bats (New York: Order of the Trustees, American Museum of Natural History). http://digitallibrary.amnh.org/handle/2246/1068
Anderson, S.C., T.A. Branch, A.B. Cooper, et al. 2017. Black-swan events in animal populations. Proceedings of the National Academy of Sciences 114: 3252–57. https://doi.org/10.1073/pnas.1611525114
Ayinla, O.A., A.B. Williams, D.A. Bolaji, et al. 2011. Development of turtle excluder device (TED) and its adoption in Nigeria (Lagos: Nigerian Institute for Oceanography and Marine Research). http://hdl.handle.net/1834/5337
Barthold, J.A., A.J. Loveridge, D.W. Macdonald, et al. 2016. Bayesian estimates of male and female African lion mortality for future use in population management. Journal of Applied Ecology 53: 295–304. https://doi.org/10.1111/1365-2664.12594
Bongers, F., L. Poorter, W.D. Hawthorne, et al. 2009. The intermediate disturbance hypothesis applies to tropical forests, but disturbance contributes little to tree diversity. Ecology Letters 12: 798–805. https://doi.org/10.1111/j.1461-0248.2009.01329.x
Bouché, P., I. Douglas-Hamilton, G. Wittemyer, et al. 2011. Will elephants soon disappear from West African savannahs? PLoS ONE 6: e20619. https://doi.org/10.1371/journal.pone.0020619
Bouley P., M. Poulos, R. Branco, et al. 2018. Post-war recovery of the African lion in response to large-scale ecosystem restoration. Biological Conservation 227: 233–42. https://doi.org/10.1016/j.biocon.2018.08.024
Brook B.W., J.J. O’Grady, A.P. Chapman, et al. 2000. Predictive accuracy of population viability analysis in conservation biology. Nature 329: 512–19. https://doi.org/10.1038/35006050
Brook, B., M. Burgman, and R. Frankham. 2000. Differences and congruencies between PVA packages: The importance of sex ratio for predictions of extinction risk. Conservation Ecology 4: 6.
Brook, B.W., L.W. Traill, and C.J.A. Bradshaw. 2006. Minimum viable population sizes and global extinction risk are unrelated. Ecology Letters 9: 375–82. https://doi.org/10.1111/j.1461-0248.2006.00883.x
Buckland, S.T., and A. Johnston. 2017. Monitoring the biodiversity of regions: Key principles and possible pitfalls. Biological Conservation 214: 23–34. https://doi.org/10.1016/j.biocon.2017.07.034
Carlsen, F., K. Leus, K. Traylor-Holzer, et al. 2012. Western chimpanzee population and habitat viability assessment for Sierra Leone: Final report. IUCN/SSC CBSG—Europe (Copenhagen: CBSG Europe). http://www.cpsg.org/sites/cbsg.org/files/documents/Sierra%20Leone%20Chimpanzee%20PHVA%20Final%20Report.pdf
Caro, T.M., C.R. Young, A.E. Cauldwell, et al. 2009. Animal breeding systems and big game hunting: Models and application. Biological Conservation 142: 909–29. https://doi.org/10.1016/j.biocon.2008.12.018
Caughley, G. 1977. Analysis of Vertebrate Populations (New York: Wiley).
Conde, D.A., J. Staerk, F. Colchero, et al. 2019. Data gaps and opportunities for comparative and conservation biology. Proceedings of the National Academy of Sciences 116: 9658–64. https://doi.org/10.1073/pnas.1816367116
Crawford, R.J.M., L.G. Underhill, J.C. Coetzee, et al. 2008. Influences of the abundance and distribution of prey on African penguins Spheniscus demersus off western South Africa. African Journal of Marine Science 30: 167–75. https://doi.org/10.2989/AJMS.2008.30.1.17.467
Crone, E.E., M.M. Ellis, W.F. Morris, et al. 2013. Ability of matrix models to explain the past and predict the future of plant populations. Conservation Biology 27: 968–78. https://doi.org/10.1111/cobi.12049
Crouse, D.T., L.B. Crowder, and H. Caswell. 1987. A stage‐based population model for loggerhead sea turtles and implications for conservation. Ecology 68: 1412–23. https://doi.org/10.2307/1939225
Cumming, D.H.M., and G.S. Cumming. 2015. One Health: An ecological and conservation perspective. In: One Health: The Theory and Practice of Integrated Health Approaches, ed. by J. Zinsstag, et al. (Wallingford: CAB International).
De Leo, G.A., and F. Micheli. 2015. The good, the bad and the ugly of marine reserves for fishery yields. Philosophical Transactions of the Royal Society B 370: 20140276. https://doi.org/10.1098/rstb.2014.0276
Eggert, L.S., R. Buij, M.E. Lee, et al. 2014. Using genetic profiles of African forest elephants to infer population structure, movements, and habitat use in a conservation and development landscape in Gabon. Conservation Biology 28: 107–18. https://doi.org/10.1111/cobi.12161
Ellner, S.P., J. Fieberg, D. Ludwig, et al. 2002. Precision of population viability analysis. Conservation Biology 16: 258–61. https://doi.org/10.1046/j.1523-1739.2002.00553.x
Fennessy, S.T., and B. Isaksen. 2007. Can bycatch reduction devices be implemented successfully on prawn trawlers in the Western Indian Ocean? African Journal of Marine Science 29: 453–63. https://doi.org/10.2989/AJMS.2007.29.3.12.342
Flather, C.H., G.D. Hayward, S.R. Beissinger, et al. 2011. Minimum viable populations: Is there a ‘magic number’ for conservation practitioners? Trends in Ecology and Ecolution 26: 307–16. https://doi.org/10.1016/j.tree.2011.03.001
Formia, A., B.J. Godley, J.F. Dontaine, et al. 2006. Mitochondrial DNA diversity and phylogeography in West and Central African green turtles (Chelonia mydas). Conservation Genetics 7: 353–69. https://doi.org/10.1007/s10592-005-9047-z
Frankham, R., C.J.A. Bradshaw, and B.W. Brook. 2014. Genetics in conservation management: Revised recommendations for the 50/500 rules, Red List criteria and population viability analyses. Biological Conservation 170: 56–63. https://doi.org/10.1016/j.biocon.2013.12.036
Funmilayo, O. 1978. Fruit bats for meat: are too many taken? Oryx 14: 377–78. https://doi.org/10.1017/S0030605300016008
Hayman, D.T.S., and A.J. Peel. 2016. Can survival analyses detect hunting pressure in a highly connected species? Lessons from straw-coloured fruit bats. Biological Conservation 200: 131–39. https://doi.org/10.1016/j.biocon.2016.06.003
Hayman, D.T.S., R. McCrea, O. Restif, et al. 2012. Demography of straw-colored fruit bats in Ghana. Journal of Mammalogy 93: 1393–404. https://doi.org/10.1644/11-MAMM-A-270.1
Hughes, N., N. Rosen, N. Gretsky, et al. 2011. Will the Nigeria-Cameroon chimpanzee go extinct? Models derived from intake rates of ape sanctuaries. In: Primates of Gashaka, ed. by V. Sommer and C. Ross (New York: Springer). http://doi.org/10.1007/978-1-4419-7403-7
Ingram, D.J., L. Coad, B. Collen, et al. 2015. Indicators for wild animal offtake: Methods and case study for African mammals and birds. Ecology and Society 20: 40. http://doi.org/10.5751/ES-07823-200340
Kamins, A.O., O. Restif, Y. Ntiamoa-Baidu, et al. 2011. Uncovering the fruit bat bushmeat commodity chain and the true extent of fruit bat hunting in Ghana, West Africa. Biological Conservation 144: 3000–08. https://doi.org/10.1016/j.biocon.2011.09.003
Kays, R., M.C. Crofoot, W. Jetz, et al. 2015. Terrestrial animal tracking as an eye on life and planet. Science 348: aaa2478. http://doi.org/10.1126/science.aaa2478
Kümpel, N.F., E.J. Milner-Gulland, G. Cowlishaw, et al. 2010. Assessing sustainability at multiple scales in a rotational bushmeat hunting system. Conservation Biology 24: 861–71. https://doi.org/10.1111/j.1523-1739.2010.01505.x
Lindsey, P., C.J. Tambling, R. Brummer, et al. 2011. Minimum prey and area requirements of the vulnerable cheetah Acinonyx jubatus: Implications for reintroduction and management of the species in South Africa. Oryx 45: 587–99. https://doi.org/10.1017/S003060531000150X
Lindsey, P., K. Marnewick, H. Davies-Mostert, et al. 2009. Cheetah (Acinonyx jubatus) population habitat viability assessment workshop report (Johannesburg: IUCN CBSG and EWT). http://www.cbsg.org/sites/cbsg.org/files/documents/South%20African%20Cheetah%20PHVA%202009.pdf
Lindsey, P.A., G.A. Balme, P. Funston, et al. 2013. The trophy hunting of African lions: Scale, current management practices and factors undermining sustainability. PLoS ONE 8: e73808. https://doi.org/10.1371/journal.pone.0073808
Marnewick, K., S.M. Ferreira, S. Grange, et al. 2014. Evaluating the status of and African wild dogs Lycaon pictus and cheetahs Acinonyx jubatus through tourist-based photographic surveys in the Kruger National Park. PloS ONE 9: e86265. https://doi.org/10.1371/journal.pone.0086265
Maxwell, S.M., G.A. Breed, B.A. Nickel, et al. 2011. Using satellite tracking to optimize protection of long-lived marine species: Olive ridley sea turtle conservation in Central Africa. PloS ONE 6: e19905. https://doi.org/10.1371/journal.pone.0019905
McCarthy, M.A. 2007. Bayesian Methods for Ecology (Cambridge: Cambridge University Press). https://doi.org/10.1017/CBO9780511802454
McCarthy, M.A., S.J. Andelman, and H.P. Possingham. 2003. Reliability of relative predictions in population viability analysis. Conservation Biology 17: 982–89. https://doi.org/10.1046/j.1523-1739.2003.01570.x
McGeoch, M.A., B.J. van Rensburg, and A. Botes. 2002. The verification and application of bioindicators: A case study of dung beetles in a savanna ecosystem. Journal of Applied Ecology 39: 661–72. https://doi.org/10.1046/j.1365-2664.2002.00743.x
Metcalfe, K., P.D. Agamboué, E. Augowet, et al. 2015. Going the extra mile: Ground-based monitoring of olive ridley turtles reveals Gabon hosts the largest rookery in the Atlantic. Biological Conservation 190: 14–22. https://doi.org/10.1016/j.biocon.2015.05.008
Milner-Gulland, E.J., and M.J. Rowcliffe. 2007. Conservation and Sustainable Use: A Handbook of Techniques (Oxford: Oxford University Press).
Morris, W.F., and D.F. Doak. 2002. Quantitative Conservation Biology (Sunderland: Sinauer).
Niamien, M., J. Coffi, B. Kadjo, et al. 2015. Initial data on poaching of Eidolon helvum (Kerr, 1792) near-threatened species in Côte D’ivoire, West Africa. European Journal of Scientific Research 35: 219–27.
Ogutu, J.O., H.-P. Piepho, M.Y. Said, et al. 2016. Extreme wildlife declines and concurrent increase in livestock numbers in Kenya: What are the causes? PLoS ONE 11: e0163249. https://doi.org/10.1371/journal.pone.0163249
Parker, L. 2017. New ocean reserve, largest in Africa, protects whales and turtles. National Geographic. http://on.natgeo.com/2samx3a
Peel, A.J., J.L.N. Wood, K.S. Baker, et al. 2017. How does Africa’s most hunted bat vary across the continent? Population traits of the straw-coloured fruit bat (Eidolon helvum) and its interactions with humans. Acta Chiropterologica 19: 77–92. https://doi.org/10.3161/15081109ACC2017.19.1.006
Péron, G., and R. Altwegg. 2015. Twenty-five years of change in southern African passerine diversity: Nonclimatic factors of change. Global Change Biology 21: 3347–55. https://doi.org/10.1111/gcb.12909
Pfab, M.F., and E.T.F. Witkowski. 2000. A simple population viability analysis of the critically endangered Euphorbia clivicola R.A. Dyer under four management scenarios. Biological Conservation 96: 263–70. http://doi.org/10.1016/S0006-3207(00)00088-4
Pikesley S.K., P.D. Agamboue, J.P. Bayet, et al. 2018. A novel approach to estimate the distribution, density and at-sea risks of a centrally-placed mobile marine vertebrate. Biological Conservation 221:246256. https://doi.org/10.1016/j.biocon.2018.03.011
Reed, D.H., J.J. O’Grady, B.W. Brook, et al. 2003. Estimates of minimum viable population sizes for vertebrates and factors influencing those estimates. Biological Conservation 113: 23–34. https://doi.org/10.1016/S0006-3207(02)00346-4
Shaffer, M.L. 1981. Minimum population sizes for species conservation. BioScience 31: 131–34. https://doi.org/10.2307/1308256
Sherley, R.B., T. Burghardt, P.J. Barham, et al. 2010. Spotting the difference: Towards fully-automated population monitoring of African penguins Spheniscus demersus. Endangered Species Research 11: 101–11. https://doi.org/10.3354/esr00267
Stalmans M., T.J. Massad, M.J.S. Peel, et al. 2019. War-induced collapse and asymmetric recovery of large-mammal populations in Gorongosa National Park, Mozambique. PLoS ONE 14: e0212864. https://doi.org/10.1371/journal.pone.0212864
Steenweg, R., M. Hebblewhite, R. Kays, et al. 2017. Scaling‐up camera traps: Monitoring the planet’s biodiversity with networks of remote sensors. Frontiers in Ecology and the Environment 15: 26–34. https://doi.org/10.1002/fee.1448
Tinley, K.L. 1977. Framework of the Gorongosa ecosystem. Ph.D. thesis (Pretoria: University of Pretoria). http://hdl.handle.net/2263/24526
Traill, L.W., B.W. Brook, R.R. Frankham, et al. 2010. Pragmatic population viability targets in a rapidly changing world. Biological Conservation 143: 28–34. https://doi.org/10.1016/j.biocon.2009.09.001
Traill, L.W., C.J.A. Bradshaw, and B.W. Brook. 2007. Minimum viable population size: A meta-analysis of 30 years of published estimates. Biological Conservation 139: 159–66. https://doi.org/10.1016/j.biocon.2007.06.011
White, L., and A. Edwards. 2000. Conservation Research in the African Rain Forests: A Technical Handbook (New York: WCS). http://apes.eva.mpg.de/eng/pdf/documentation/WhiteEdwards2000.pdf
Wilson, H.B., J.R. Rhodes, and H.P. Possingham. 2015. Two additional principles for determining which species to monitor. Ecology 96: 3016–22. https://doi.org/10.1890/14-1511.1
Witt, M.J., B. Baert, A.C. Broderick, et al. 2009. Aerial surveying of the world’s largest leatherback turtle rookery: A more effective methodology for large-scale monitoring. Biological Conservation 142: 1719–27. https://doi.org/10.1016/j.biocon.2009.03.009
Witt, M.J., E.B. Augowet, A.C. Broderick, et al. 2011. Tracking leatherback turtles from the world’s largest rookery: Assessing threats across the South Atlantic. Proceedings of the Royal Society B 278: 2338–47. https://doi.org/10.1098/rspb.2010.2467