
4.1: Energy Flow through Ecosystems
- Page ID
- 81319

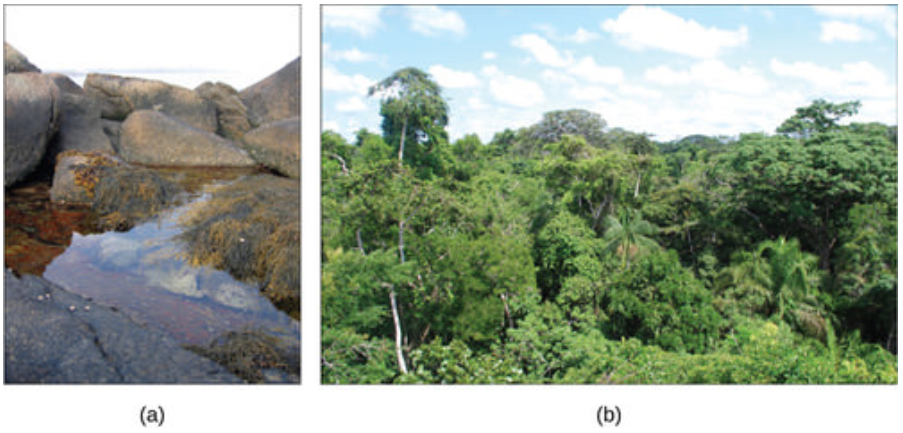
An ecosystem is a community of organisms and their abiotic (non-living) environment. Ecosystems can be small, such as the tide pools found near the rocky shores of many oceans, or large, such as those found in the tropical rainforest of the Amazon in Brazil (Figure \(\PageIndex{1}\)).
There are three broad categories of ecosystems based on their general environment: freshwater, marine, and terrestrial. Within these three categories are individual ecosystem types based on the environmental habitat and organisms present.
Freshwater ecosystems are the least common, occurring on only 1.8 percent of Earth’s surface. These systems comprise lakes, rivers, streams, and springs; they are quite diverse and support a variety of animals, plants, fungi, protists and prokaryotes.
Marine ecosystems are the most common, comprising 75 percent of Earth’s surface and consisting of three basic types: shallow ocean, deep ocean water, and deep ocean bottom. Shallow ocean ecosystems include extremely biodiverse coral reef ecosystems. Small photosynthetic organisms suspended in ocean waters, collectively known as phytoplankton, perform 40 percent of all photosynthesis on Earth. Deep ocean bottom ecosystems contain a wide variety of marine organisms. These ecosystems are so deep that light is unable to reach them.
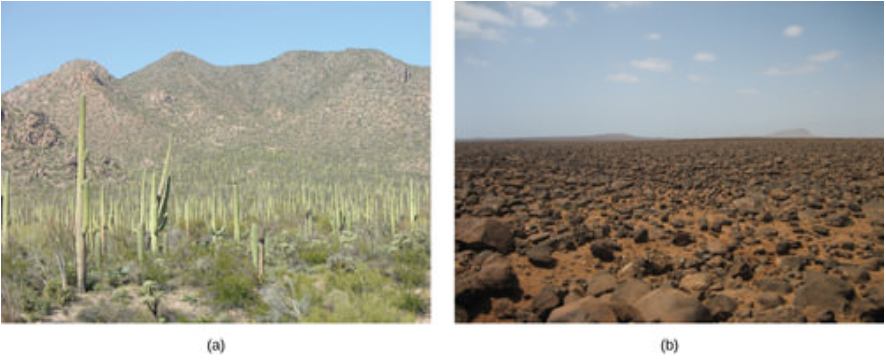
Terrestrial ecosystems, also known for their diversity, are grouped into large categories called biomes. A biome is a large-scale community of organisms, primarily defined on land by the dominant plant types that exist in geographic regions of the planet with similar climatic conditions. Examples of biomes include tropical rainforests, savannas, deserts, grasslands, temperate forests, and tundras. Grouping these ecosystems into just a few biome categories obscures the great diversity of the individual ecosystems within them. For example, the saguaro cacti (Carnegiea gigantean) and other plant life in the Sonoran Desert, in the United States, are relatively diverse compared with the desolate rocky desert of Boa Vista, an island off the coast of Western Africa (Figure \(\PageIndex{2}\)).
Food Webs
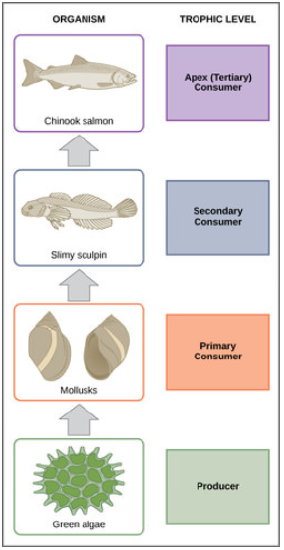
You may be familiar with food chains from prior learning experiences (Figure \(\PageIndex{3}\)). However, food chains are not an accurate way of representing how natural feeding relationships actually work.
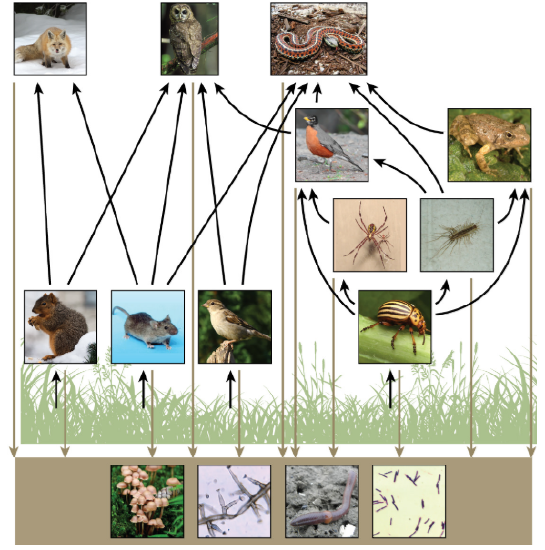
Instead, energy flow through ecosystems are best represented by food webs, a concept that accounts for the multiple trophic (feeding) interactions between each species (Figure \(\PageIndex{4}\) below). Even when all organisms are grouped into appropriate trophic levels, some of these organisms can feed at more than one trophic level. In addition, species feed on and are eaten by more than one species. A food web is a holistic model—which includes all the interactions between different species and their complex interconnected relationships with each other and with the environment—and is a more accurate and descriptive model for ecosystems.
The levels in the food web are producers, primary consumers, higher-level consumers, and finally decomposers. These levels are used to describe ecosystem structure and dynamics. Each organism in a food web occupies a specific trophic level (energy level) at a given moment in time, depending on what it is eating.
In many ecosystems, the base, or foundation, of the food web consists of photosynthetic organisms (plants or phytoplankton), which are called producers. In other systems, the producers may be chemoautotrophs if there is no sunlight available, as at the bottom of the ocean or in caves. The organisms that consume the producers are called primary consumers. Secondary consumers are usually carnivores that eat the primary consumers. Tertiary consumers are carnivores that eat other carnivores. Higher-level consumers feed on the next lower trophic levels, and so on, up to the organisms at the top of the food web.
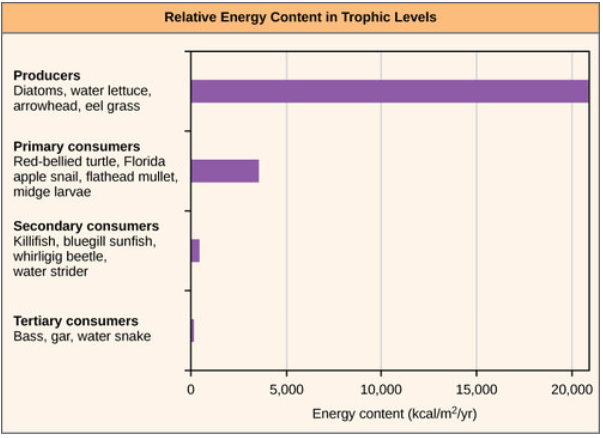
One major factor that limits the number of steps in a food web is energy. Energy is lost at each trophic level and between trophic levels as heat and in the transfer to decomposers (Figure \(\PageIndex{5}\) below). Thus, after a limited number of trophic energy transfers, the amount of energy remaining in the food chain may not be great enough to support viable populations at higher trophic levels.
Two general types of food webs are often shown interacting within a single ecosystem. A grazing food web has plants or other photosynthetic organisms at its base, followed by herbivores and various carnivores. A detrital food web consists of a base of organisms that feed on decaying organic matter (dead organisms), including decomposers (which break down dead and decaying organisms) and detritivores(which consume organic detritus). These organisms are usually bacteria, fungi, and invertebrate animals that recycle organic material back into the biotic part of the ecosystem as they themselves are consumed by other organisms.
How Organisms Acquire Energy in a Food Web
All living things require energy in one form or another. At the cellular level, energy is used in most metabolic pathways (usually in the form of ATP), especially those responsible for building large molecules from smaller compounds. Living organisms would not be able to assemble complex organic molecules (proteins, lipids, nucleic acids, and carbohydrates) without a constant energy input.
Food-web diagrams illustrate how energy flows directionally through ecosystems. They can also indicate how efficiently organisms acquire energy, use it, and how much remains for use by other organisms of the food web. Energy is acquired by living things in two ways: autotrophs harness light or chemical energy and heterotrophs acquire energy through the consumption and digestion of other living or previously living organisms.
Photosynthetic and chemosynthetic organisms are autotrophs, which are organisms capable of synthesizing their own food (more specifically, capable of using inorganic carbon as a carbon source). Photosynthetic autotrophs (photoautotrophs) use sunlight as an energy source, and chemosynthetic autotrophs (chemoautotrophs) use inorganic molecules as an energy source. Autotrophs are critical for ecosystems because they occupy the trophic level containing producers. Without these organisms, energy would not be available to other living organisms, and life would not be possible.
Photoautotrophs, such as plants, algae, and photosynthetic bacteria, are the energy source for a majority of the world’s ecosystems. Photoautotrophs harness the Sun’s solar energy by converting it to chemical energy. The rate at which photosynthetic producers incorporate energy from the Sun is called gross primary productivity. However, not all of the energy incorporated by producers is available to the other organisms in the food web because producers must also grow and reproduce, which consumes energy. Net primary productivity is the energy that remains in the producers after accounting for these organisms’ metabolism and heat loss. The net productivity is then available to the primary consumers at the next trophic level.
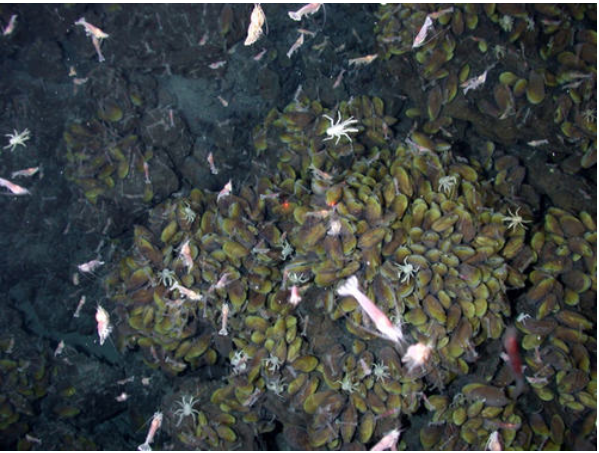
Figure \(\PageIndex{6}\). Swimming shrimp, a few squat lobsters, and hundreds of vent mussels are seen at a hydrothermal vent at the bottom of the ocean. As no sunlight penetrates to this depth, the ecosystem is supported by chemoautotrophic bacteria and organic material that sinks from the ocean’s surface. This picture was taken in 2006 at the submerged NW Eifuku volcano off the coast of Japan by the National Oceanic and Atmospheric Administration (NOAA). The summit of this highly active volcano lies 1535 m below the surface.
Chemoautotrophs are primarily bacteria and archaea that are found in rare ecosystems where sunlight is not available, such as those associated with dark caves or hydrothermal vents at the bottom of the ocean (Figure \(\PageIndex{6}\)). Many chemoautotrophs in hydrothermal vents use hydrogen sulfide (H2S), which is released from the vents, as a source of chemical energy. This allows them to synthesize complex organic molecules, such as glucose, for their own energy and, in turn, supplies energy to the rest of the ecosystem.
One of the most important consequences of ecosystem dynamics in terms of human impact is biomagnification. Biomagnification is the increasing concentration of persistent, toxic substances in organisms at each successive trophic level. These are substances that are lipid soluble and are stored in the fat reserves of each organism. Many substances have been shown to biomagnify, including classical studies with the pesticide dichlorodiphenyltrichloroethane (DDT), which were described in the 1960s bestseller Silent Spring by Rachel Carson. DDT was a commonly used pesticide before its dangers to apex consumers, such as the bald eagle, became known. DDT and other toxins are taken in by producers and passed on to successive levels of consumers at increasingly higher rates. As bald eagles feed on contaminated fish, their DDT levels rise. It was discovered that DDT caused the eggshells of birds to become fragile, which contributed to the bald eagle being listed as an endangered species under U.S. law. The use of DDT was banned in the United States in the 1970s.
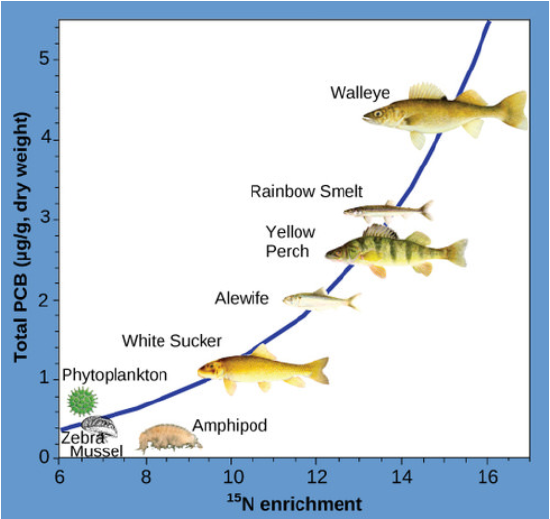
Another substances that biomagnifies is polychlorinated biphenyl (PCB), which was used as coolant liquids in the United States until its use was banned in 1979. PCB was best studied in aquatic ecosystems where predatory fish species accumulated very high concentrations of the toxin that is otherwise exists at low concentrations in the environment. As illustrated in a study performed by the NOAA in the Saginaw Bay of Lake Huron of the North American Great Lakes (Figure \(\PageIndex{7}\) below), PCB concentrations increased from the producers of the ecosystem (phytoplankton) through the different trophic levels of fish species. The apex consumer, the walleye, has more than four times the amount of PCBs compared to phytoplankton. Also, research found that birds that eat these fish may have PCB levels that are at least ten times higher than those found in the lake fish.
Other concerns have been raised by the biomagnification of heavy metals, such as mercury and cadmium, in certain types of seafood. The United States Environmental Protection Agency recommends that pregnant women and young children should not consume any swordfish, shark, king mackerel, or tilefish because of their high mercury content. These individuals are advised to eat fish low in mercury: salmon, shrimp, pollock, and catfish. Biomagnification is a good example of how ecosystem dynamics can affect our everyday lives, even influencing the food we eat.
Suggested Supplementary Materials
Canales, M. et al. 2018. 6 Things that Make Like on Earth Possible [Infographic]. National Geographic. March.
Academy Award-winning Passion Pictures and HHMI Tangled Bank Studios present one of the most important but untold science stories of our time—a tale with profound implications for the fate of life on our planet. Beginning in the 1960s, a small band of young scientists headed out into the wilderness, driven by an insatiable curiosity about how nature works. Immersed in some of the most remote and spectacular places on Earth—from the majestic Serengeti to the Amazon jungle; from the Arctic Ocean to Pacific tide pools—they discovered a single set of rules that govern all life. Now in the twilight of their eminent careers, these five unsung heroes of modern ecology share the stories of their adventures, reveal how their pioneering work flipped our view of nature on its head, and give us a chance to reimagine the world as it could and should be.
Contributors and Attributions
- Energy Flow through Ecosystems by OpenStax is licensed under CC BY 3.0. Modified from the original by Matthew R. Fisher.