
4.5: Laboratory Activities and Assignment
- Page ID
- 53563

\( \newcommand{\vecs}[1]{\overset { \scriptstyle \rightharpoonup} {\mathbf{#1}} } \)
\( \newcommand{\vecd}[1]{\overset{-\!-\!\rightharpoonup}{\vphantom{a}\smash {#1}}} \)
\( \newcommand{\dsum}{\displaystyle\sum\limits} \)
\( \newcommand{\dint}{\displaystyle\int\limits} \)
\( \newcommand{\dlim}{\displaystyle\lim\limits} \)
\( \newcommand{\id}{\mathrm{id}}\) \( \newcommand{\Span}{\mathrm{span}}\)
( \newcommand{\kernel}{\mathrm{null}\,}\) \( \newcommand{\range}{\mathrm{range}\,}\)
\( \newcommand{\RealPart}{\mathrm{Re}}\) \( \newcommand{\ImaginaryPart}{\mathrm{Im}}\)
\( \newcommand{\Argument}{\mathrm{Arg}}\) \( \newcommand{\norm}[1]{\| #1 \|}\)
\( \newcommand{\inner}[2]{\langle #1, #2 \rangle}\)
\( \newcommand{\Span}{\mathrm{span}}\)
\( \newcommand{\id}{\mathrm{id}}\)
\( \newcommand{\Span}{\mathrm{span}}\)
\( \newcommand{\kernel}{\mathrm{null}\,}\)
\( \newcommand{\range}{\mathrm{range}\,}\)
\( \newcommand{\RealPart}{\mathrm{Re}}\)
\( \newcommand{\ImaginaryPart}{\mathrm{Im}}\)
\( \newcommand{\Argument}{\mathrm{Arg}}\)
\( \newcommand{\norm}[1]{\| #1 \|}\)
\( \newcommand{\inner}[2]{\langle #1, #2 \rangle}\)
\( \newcommand{\Span}{\mathrm{span}}\) \( \newcommand{\AA}{\unicode[.8,0]{x212B}}\)
\( \newcommand{\vectorA}[1]{\vec{#1}} % arrow\)
\( \newcommand{\vectorAt}[1]{\vec{\text{#1}}} % arrow\)
\( \newcommand{\vectorB}[1]{\overset { \scriptstyle \rightharpoonup} {\mathbf{#1}} } \)
\( \newcommand{\vectorC}[1]{\textbf{#1}} \)
\( \newcommand{\vectorD}[1]{\overrightarrow{#1}} \)
\( \newcommand{\vectorDt}[1]{\overrightarrow{\text{#1}}} \)
\( \newcommand{\vectE}[1]{\overset{-\!-\!\rightharpoonup}{\vphantom{a}\smash{\mathbf {#1}}}} \)
\( \newcommand{\vecs}[1]{\overset { \scriptstyle \rightharpoonup} {\mathbf{#1}} } \)
\(\newcommand{\longvect}{\overrightarrow}\)
\( \newcommand{\vecd}[1]{\overset{-\!-\!\rightharpoonup}{\vphantom{a}\smash {#1}}} \)
\(\newcommand{\avec}{\mathbf a}\) \(\newcommand{\bvec}{\mathbf b}\) \(\newcommand{\cvec}{\mathbf c}\) \(\newcommand{\dvec}{\mathbf d}\) \(\newcommand{\dtil}{\widetilde{\mathbf d}}\) \(\newcommand{\evec}{\mathbf e}\) \(\newcommand{\fvec}{\mathbf f}\) \(\newcommand{\nvec}{\mathbf n}\) \(\newcommand{\pvec}{\mathbf p}\) \(\newcommand{\qvec}{\mathbf q}\) \(\newcommand{\svec}{\mathbf s}\) \(\newcommand{\tvec}{\mathbf t}\) \(\newcommand{\uvec}{\mathbf u}\) \(\newcommand{\vvec}{\mathbf v}\) \(\newcommand{\wvec}{\mathbf w}\) \(\newcommand{\xvec}{\mathbf x}\) \(\newcommand{\yvec}{\mathbf y}\) \(\newcommand{\zvec}{\mathbf z}\) \(\newcommand{\rvec}{\mathbf r}\) \(\newcommand{\mvec}{\mathbf m}\) \(\newcommand{\zerovec}{\mathbf 0}\) \(\newcommand{\onevec}{\mathbf 1}\) \(\newcommand{\real}{\mathbb R}\) \(\newcommand{\twovec}[2]{\left[\begin{array}{r}#1 \\ #2 \end{array}\right]}\) \(\newcommand{\ctwovec}[2]{\left[\begin{array}{c}#1 \\ #2 \end{array}\right]}\) \(\newcommand{\threevec}[3]{\left[\begin{array}{r}#1 \\ #2 \\ #3 \end{array}\right]}\) \(\newcommand{\cthreevec}[3]{\left[\begin{array}{c}#1 \\ #2 \\ #3 \end{array}\right]}\) \(\newcommand{\fourvec}[4]{\left[\begin{array}{r}#1 \\ #2 \\ #3 \\ #4 \end{array}\right]}\) \(\newcommand{\cfourvec}[4]{\left[\begin{array}{c}#1 \\ #2 \\ #3 \\ #4 \end{array}\right]}\) \(\newcommand{\fivevec}[5]{\left[\begin{array}{r}#1 \\ #2 \\ #3 \\ #4 \\ #5 \\ \end{array}\right]}\) \(\newcommand{\cfivevec}[5]{\left[\begin{array}{c}#1 \\ #2 \\ #3 \\ #4 \\ #5 \\ \end{array}\right]}\) \(\newcommand{\mattwo}[4]{\left[\begin{array}{rr}#1 \amp #2 \\ #3 \amp #4 \\ \end{array}\right]}\) \(\newcommand{\laspan}[1]{\text{Span}\{#1\}}\) \(\newcommand{\bcal}{\cal B}\) \(\newcommand{\ccal}{\cal C}\) \(\newcommand{\scal}{\cal S}\) \(\newcommand{\wcal}{\cal W}\) \(\newcommand{\ecal}{\cal E}\) \(\newcommand{\coords}[2]{\left\{#1\right\}_{#2}}\) \(\newcommand{\gray}[1]{\color{gray}{#1}}\) \(\newcommand{\lgray}[1]{\color{lightgray}{#1}}\) \(\newcommand{\rank}{\operatorname{rank}}\) \(\newcommand{\row}{\text{Row}}\) \(\newcommand{\col}{\text{Col}}\) \(\renewcommand{\row}{\text{Row}}\) \(\newcommand{\nul}{\text{Nul}}\) \(\newcommand{\var}{\text{Var}}\) \(\newcommand{\corr}{\text{corr}}\) \(\newcommand{\len}[1]{\left|#1\right|}\) \(\newcommand{\bbar}{\overline{\bvec}}\) \(\newcommand{\bhat}{\widehat{\bvec}}\) \(\newcommand{\bperp}{\bvec^\perp}\) \(\newcommand{\xhat}{\widehat{\xvec}}\) \(\newcommand{\vhat}{\widehat{\vvec}}\) \(\newcommand{\uhat}{\widehat{\uvec}}\) \(\newcommand{\what}{\widehat{\wvec}}\) \(\newcommand{\Sighat}{\widehat{\Sigma}}\) \(\newcommand{\lt}{<}\) \(\newcommand{\gt}{>}\) \(\newcommand{\amp}{&}\) \(\definecolor{fillinmathshade}{gray}{0.9}\)Laboratory Activities and Assignment
Introduction
In these laboratory activities, you will be examining real cells that have been frozen in time in the midst of undergoing the various phases of the cell cycle. To better examine the many cell cycle stages that occur with real cells, we use cells that are undergoing a high amount of cell division. One great source of rapidly dividing animal cells is in early embryonic development. A blastula is a ball of cells in an early embryonic phase and is continuing to undergo rapid cell divisions. After egg and sperm meet, the fertilized ovum rapidly begins to divide and will go through this blastula stage. Since we are interested in studying cell division in humans (a type animal), and it would be unethical to examine human blastula, fish blastula are commonly used.

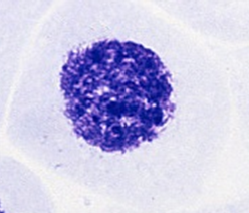
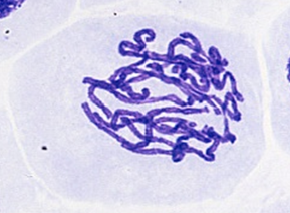
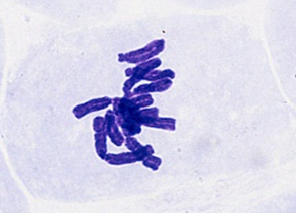
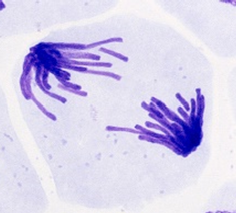
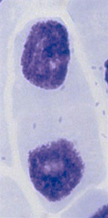
Real cells can look quite different than the illustrated versions of cells in their cell cycle stages. To assist with recognizing these stages, examine the table above showing images of real animal cells. A description of features that can be used to identify cells in each stage is also provided. Note that these microscope slides are prepared using stains that stain the DNA (chromosomes/chromatids) a color that makes it more obvious such as purple, blue, or pink. The images above have the DNA stained dark purple.
|
Interphase |
Prophase |
Metaphase |
Anaphase |
Telophase |
|---|---|---|---|---|
|
|
|
|
|
|
|
|
|
|
|
Quantify Cells in Each Cell Cycle Phase in a Fish Blastula
Note: It is recommended students complete the Collaborative Study Activity for this chapter before beginning this section. This activity will better prepare students to identify the appearance of fish cells in each phase of the cell cycle.
- Obtain a "fish blastula" or "fish mitosis" slide and setup a microscope.
- Focus on a single blastula at low power and increase magnification incrementally, focusing at each power along the way. Do not skip objectives without re-centering and re-focusing the sample.
- Carefully examine the blastula at 400x total magnification.
- Count the number of cells in the entire blastula that are in interphase and record in the table below in the individual counts column.
- Count the number of cells in the entire blastula that are in prophase and record in the table below in the individual counts column.
- Count the number of cells in the entire blastula that are in metaphase and record in the table below in the individual counts column.
- Count the number of cells in the entire blastula that are in anaphase and record in the table below in the individual counts column.
- Count the number of cells in the entire blastula that are in telophase and record in the table below in the individual counts column.
- Share your data with your instructor so they can compile class data.
Analyze Fish Blastula Data to Estimate Relative Durations of Each Phase of the Cell Cycle
In the table below, record individual and class data indicating the number and percentages of cells in each phase of the cell cycle in fish blastula.
|
Individual Counts |
Class Counts |
|||
|---|---|---|---|---|
|
# Cells |
% Cells |
Class # Cells |
Class % Cells |
|
|
Interphase |
||||
|
Prophase |
||||
|
Metaphase |
||||
|
Anaphase |
||||
|
Telophase |
||||
|
Total |
||||
Calculate the percentage of cells in each phase of the cell cycle:
% cells = (cells in that stage ÷ total number of cells counted) x 100
- Create a stacked bar graph presenting class % cells during the cell cycle for fish blastula cells. Use a ruler or a graphing software to make the graph neat and professional-looking. If using a graphing software, you could alternatively create a pie chart. Include in the graph the following:
- Labels for the x-axis and y-axis:
- Y-axis numbered corresponding the percentage of cells observed. The bottom of the y-axis is 0% and the top line of the y-axis is 100%. Each line up the y-axis is a specific increment (as determined by you) increasing up the y-axis.
- Y-axis title to tell what the numbers mean: Percentage of cells in each stage.
- X-axis label to tell what the bar shows (Fish Blastula).
- Each of the two bars stretch from 0% to 100% but are divided into the stages of the cell cycle using different colors based on the % of cells in each stage. A key is needed to tell what each color shows. Bar sections should be colored in NEATLY so the graph looks professional.
- Title for the graph.
2. Examine your graph. The percentage of cells observed in a specific stage the cell cycle is indicative of the length of time a cell requires for each stage (the greater the % cells, the longer the phase lasts during the cell cycle; the fewer the % cells, the shorter that phase is in the cycle cycle). Using your data, discuss the length of time each of the phases of the cell cycle lasts. Which is the longest phase? Which phase is the shortest? How do all the phases compare with each other?
Additional Questions
1. Use the letters to match with the descriptions as appropriate. Some choices may be used more than once and some may not be used at all.
|
A. mitosis B. interphase C. prophase D. homologous chromosomes E. telophase F. anaphase G. cytokinesis H. sister chromatids I. metaphase J. S phase |
______ A phase when chromosomes line up in the center of the cell. ______ A phase when the nuclear envelope begins to dissolve. ______ A phase between cell divisions. ______ A phase when chromosomes separate from one another. ______ Nuclear division. ______ A phase when DNA replication occurs. ______ A phase when the DNA decondenses. ______ Type of chromosomes that separate during mitosis. ______ Division of the cytoplasm to produce 2 separate cells. ______ A phase where the cell grows and organelles replicate. ______ A phase where DNA condenses. ______ A process that produces sister chromatids. ______ A phase when the nuclear envelope reforms. |
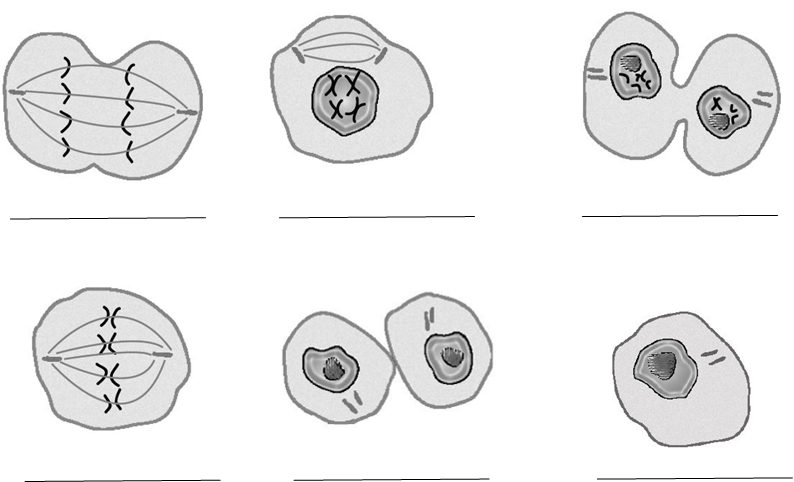
2. Label the images of stages of the cell cycle using the choices below:
- interphase
- prophase
- metaphase
- anaphase
- telophase
- cytokinesis
Attributions
Introduction
- "Mitosis (261 01) Pressed; root meristem of Vicia faba" by Doc. RNDr. Josef Reischig, CSc. is licensed under CC BY-SA 3.0
- "Mitosis (261 02) Pressed; root meristem of Vicia faba (cells in prophase)" by Doc. RNDr. Josef Reischig, CSc. is licensed under CC BY-SA 3.0
- "Mitosis (261 03) Pressed; root meristem of Vicia faba (cells in prophase, metaphase)" by Doc. RNDr. Josef Reischig, CSc. is licensed under CC BY-SA 3.0
- "Mitosis (261 08) Pressed; root meristem of Vicia faba (cells in telophase)" by Doc. RNDr. Josef Reischig, CSc. is licensed under CC BY-SA 3.0
- "Mitosis (261 10) Pressed; root meristem of Vicia faba (cells in anaphase, prophase)" by Doc. RNDr. Josef Reischig, CSc. is licensed under CC BY-SA 3.0
- "PSM V84 D534 Facts and factors of development fig10" by Edwing Grant Conklin is in the Public Domain
Analyze Fish Blastula Data to Estimate Relative Lengths of Each Phase of the Cell Cycle
- "Graph paper inch Letter" by László Németh is in the Public Domain, CC0
Additional Questions
- "Anatomy and Physiology I Lab" by Victoria Vidal is licensed under CC BY 4.0
Updated 2025.