
9: Global Climate Change
- Page ID
- 175884

\( \newcommand{\vecs}[1]{\overset { \scriptstyle \rightharpoonup} {\mathbf{#1}} } \)
\( \newcommand{\vecd}[1]{\overset{-\!-\!\rightharpoonup}{\vphantom{a}\smash {#1}}} \)
\( \newcommand{\dsum}{\displaystyle\sum\limits} \)
\( \newcommand{\dint}{\displaystyle\int\limits} \)
\( \newcommand{\dlim}{\displaystyle\lim\limits} \)
\( \newcommand{\id}{\mathrm{id}}\) \( \newcommand{\Span}{\mathrm{span}}\)
( \newcommand{\kernel}{\mathrm{null}\,}\) \( \newcommand{\range}{\mathrm{range}\,}\)
\( \newcommand{\RealPart}{\mathrm{Re}}\) \( \newcommand{\ImaginaryPart}{\mathrm{Im}}\)
\( \newcommand{\Argument}{\mathrm{Arg}}\) \( \newcommand{\norm}[1]{\| #1 \|}\)
\( \newcommand{\inner}[2]{\langle #1, #2 \rangle}\)
\( \newcommand{\Span}{\mathrm{span}}\)
\( \newcommand{\id}{\mathrm{id}}\)
\( \newcommand{\Span}{\mathrm{span}}\)
\( \newcommand{\kernel}{\mathrm{null}\,}\)
\( \newcommand{\range}{\mathrm{range}\,}\)
\( \newcommand{\RealPart}{\mathrm{Re}}\)
\( \newcommand{\ImaginaryPart}{\mathrm{Im}}\)
\( \newcommand{\Argument}{\mathrm{Arg}}\)
\( \newcommand{\norm}[1]{\| #1 \|}\)
\( \newcommand{\inner}[2]{\langle #1, #2 \rangle}\)
\( \newcommand{\Span}{\mathrm{span}}\) \( \newcommand{\AA}{\unicode[.8,0]{x212B}}\)
\( \newcommand{\vectorA}[1]{\vec{#1}} % arrow\)
\( \newcommand{\vectorAt}[1]{\vec{\text{#1}}} % arrow\)
\( \newcommand{\vectorB}[1]{\overset { \scriptstyle \rightharpoonup} {\mathbf{#1}} } \)
\( \newcommand{\vectorC}[1]{\textbf{#1}} \)
\( \newcommand{\vectorD}[1]{\overrightarrow{#1}} \)
\( \newcommand{\vectorDt}[1]{\overrightarrow{\text{#1}}} \)
\( \newcommand{\vectE}[1]{\overset{-\!-\!\rightharpoonup}{\vphantom{a}\smash{\mathbf {#1}}}} \)
\( \newcommand{\vecs}[1]{\overset { \scriptstyle \rightharpoonup} {\mathbf{#1}} } \)
\(\newcommand{\longvect}{\overrightarrow}\)
\( \newcommand{\vecd}[1]{\overset{-\!-\!\rightharpoonup}{\vphantom{a}\smash {#1}}} \)
\(\newcommand{\avec}{\mathbf a}\) \(\newcommand{\bvec}{\mathbf b}\) \(\newcommand{\cvec}{\mathbf c}\) \(\newcommand{\dvec}{\mathbf d}\) \(\newcommand{\dtil}{\widetilde{\mathbf d}}\) \(\newcommand{\evec}{\mathbf e}\) \(\newcommand{\fvec}{\mathbf f}\) \(\newcommand{\nvec}{\mathbf n}\) \(\newcommand{\pvec}{\mathbf p}\) \(\newcommand{\qvec}{\mathbf q}\) \(\newcommand{\svec}{\mathbf s}\) \(\newcommand{\tvec}{\mathbf t}\) \(\newcommand{\uvec}{\mathbf u}\) \(\newcommand{\vvec}{\mathbf v}\) \(\newcommand{\wvec}{\mathbf w}\) \(\newcommand{\xvec}{\mathbf x}\) \(\newcommand{\yvec}{\mathbf y}\) \(\newcommand{\zvec}{\mathbf z}\) \(\newcommand{\rvec}{\mathbf r}\) \(\newcommand{\mvec}{\mathbf m}\) \(\newcommand{\zerovec}{\mathbf 0}\) \(\newcommand{\onevec}{\mathbf 1}\) \(\newcommand{\real}{\mathbb R}\) \(\newcommand{\twovec}[2]{\left[\begin{array}{r}#1 \\ #2 \end{array}\right]}\) \(\newcommand{\ctwovec}[2]{\left[\begin{array}{c}#1 \\ #2 \end{array}\right]}\) \(\newcommand{\threevec}[3]{\left[\begin{array}{r}#1 \\ #2 \\ #3 \end{array}\right]}\) \(\newcommand{\cthreevec}[3]{\left[\begin{array}{c}#1 \\ #2 \\ #3 \end{array}\right]}\) \(\newcommand{\fourvec}[4]{\left[\begin{array}{r}#1 \\ #2 \\ #3 \\ #4 \end{array}\right]}\) \(\newcommand{\cfourvec}[4]{\left[\begin{array}{c}#1 \\ #2 \\ #3 \\ #4 \end{array}\right]}\) \(\newcommand{\fivevec}[5]{\left[\begin{array}{r}#1 \\ #2 \\ #3 \\ #4 \\ #5 \\ \end{array}\right]}\) \(\newcommand{\cfivevec}[5]{\left[\begin{array}{c}#1 \\ #2 \\ #3 \\ #4 \\ #5 \\ \end{array}\right]}\) \(\newcommand{\mattwo}[4]{\left[\begin{array}{rr}#1 \amp #2 \\ #3 \amp #4 \\ \end{array}\right]}\) \(\newcommand{\laspan}[1]{\text{Span}\{#1\}}\) \(\newcommand{\bcal}{\cal B}\) \(\newcommand{\ccal}{\cal C}\) \(\newcommand{\scal}{\cal S}\) \(\newcommand{\wcal}{\cal W}\) \(\newcommand{\ecal}{\cal E}\) \(\newcommand{\coords}[2]{\left\{#1\right\}_{#2}}\) \(\newcommand{\gray}[1]{\color{gray}{#1}}\) \(\newcommand{\lgray}[1]{\color{lightgray}{#1}}\) \(\newcommand{\rank}{\operatorname{rank}}\) \(\newcommand{\row}{\text{Row}}\) \(\newcommand{\col}{\text{Col}}\) \(\renewcommand{\row}{\text{Row}}\) \(\newcommand{\nul}{\text{Nul}}\) \(\newcommand{\var}{\text{Var}}\) \(\newcommand{\corr}{\text{corr}}\) \(\newcommand{\len}[1]{\left|#1\right|}\) \(\newcommand{\bbar}{\overline{\bvec}}\) \(\newcommand{\bhat}{\widehat{\bvec}}\) \(\newcommand{\bperp}{\bvec^\perp}\) \(\newcommand{\xhat}{\widehat{\xvec}}\) \(\newcommand{\vhat}{\widehat{\vvec}}\) \(\newcommand{\uhat}{\widehat{\uvec}}\) \(\newcommand{\what}{\widehat{\wvec}}\) \(\newcommand{\Sighat}{\widehat{\Sigma}}\) \(\newcommand{\lt}{<}\) \(\newcommand{\gt}{>}\) \(\newcommand{\amp}{&}\) \(\definecolor{fillinmathshade}{gray}{0.9}\)Introduction
The iconic Grand Canal of Venice, Italy, doesn’t need high quality instruments to note effects of climate change. The Grand Canal (figure \(\PageIndex{a}\)) was built in a way that the water levels are directly correlated with the sea level. As such, the steps leading into the canal have become rulers for sea level changes over the hundreds of years of their existence. The last step leading into the canal directly reflected the sea level at the time of creation and currently, the water level is 3 feet above this. In the last quarter century, sea levels have been rising much faster than previously measured. This puts Venice in a difficult position moving into a future where scientists predict the sea level to continue to rise, estimating that the city will be underwater by 2100, along with many other coastal cities. Unfortunately, rising seas are only one of the many predicted outcomes of global climate change.
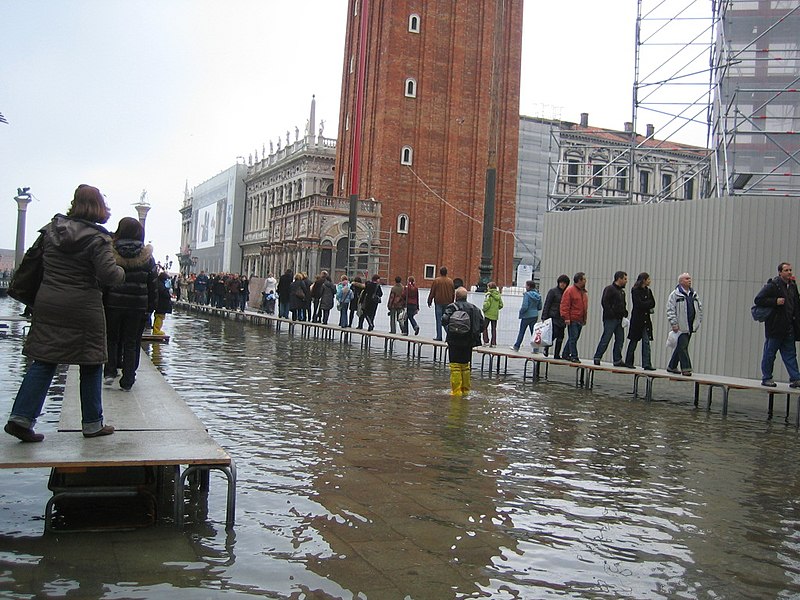

Figure \(\PageIndex{a}\): Flooding in Venice, Italy. Image by WorldIslandInfo.com in Wikimedia Commons (CC-BY2.0).Closer to home, sea level rise predictions for san diego are expected to be from 3.6 feet (1.09 m) - 7 feet (2.13 m). Using the NOAA sea level rise and viewer, 1.8 m mid-range estimate for San Diego has been mapped onto the coastline (figure \(\PageIndex{b}\)). Figure \(\PageIndex{b}\): Screenshot of mid-range sea-level rise estimate for San Diego by 2100. Source: National Oceanic and Atmospheric Administration Sea level Rise Viewer. https://coast.noaa.gov/slr/#/layer/s...tion/NOS_Minor
Climate change refers to any significant change in the measures of climate lasting for an extended period of time. In other words, climate change includes major changes in temperature, precipitation, or wind patterns, among other effects, that occur over several decades or longer. Global Warming refers to the recent and ongoing rise in global average temperature near Earth’s surface. Global Warming is a phenomenon due to anthropogenic climate change (also called Global Climate Change). This differs from regular climate change in that it has been caused by humans. It is caused mostly by increasing concentrations of greenhouse gases in the atmosphere. Global warming is causing climate patterns to change. However, global warming itself represents only one aspect of climate change.
A common misconception about global climate change is that a specific weather event occurring in a particular region (for example, a very cool week in June in central Indiana) is evidence of global climate change. However, a cold week in June is a weather-related event and not a climate-related one. These misconceptions often arise because of confusion over the terms climate and weather.
Climate refers to the long-term, predictable atmospheric conditions of a specific area. The climate of a biome is characterized by having consistent temperature and annual rainfall ranges. Climate does not address the amount of rain that fell on one particular day in a biome or the colder-than-average temperatures that occurred on one day. In contrast, weather refers to the conditions of the atmosphere during a short period of time. Weather forecasts are usually made for 48-hour cycles. Long-range weather forecasts are available but can be unreliable.
To better understand the difference between climate and weather, imagine that you are planning an outdoor event in January in San Diego. You would be thinking about climate when you plan the event in the winter rather than the summer because you have long-term knowledge that any given Saturday in the months of May to August would be a better choice for an outdoor event in San Diego than any given Saturday in January. However, you cannot determine the specific day that the event should be held on because it is difficult to accurately predict the weather on a specific day. Climate can be considered the “average” weather.
- 9.1: Weather and Climate- What’s the Difference?
- This page explains the difference between "weather" and "climate." Weather refers to immediate atmospheric conditions such as temperature and precipitation, while climate is the long-term average of those weather patterns, including extremes. Daily choices may be influenced by weather, whereas climate affects broader purchasing decisions, as seen in tropical regions where winter clothing is unnecessary.
- 9.2: Radiation
- This page covers the concept of radiation in atmospheric science, emphasizing its understanding as electromagnetic waves characterized by electric and magnetic fields. It details how different wavelengths correspond to various radiation types, such as radio waves and x-rays.
- 9.3: The Greenhouse Effect
- This page discusses the Greenhouse Effect, highlighting the balance of solar energy affecting Earth's temperature. It details how human activities, especially fossil fuel use, are increasing greenhouse gases (GHGs) and intensifying global warming, which cannot be solely attributed to natural causes. The page explains the function of GHGs in trapping heat, comparing them to a blanket, and underscores their critical role in sustaining life on Earth.
- 9.4: Effects of Anthropogenic Climate Change
- This page covers the critical issues surrounding global warming and climate change, emphasizing human-induced greenhouse gas emissions, particularly CO2 and methane. It highlights the urgent need for significant emissions reductions to limit warming and discusses the severe consequences of inaction, such as extreme weather and ecological disruptions. The importance of achieving net-zero by the early 2050s is stressed, along with the challenges in translating climate knowledge into action.
- 9.5: Data Dive- Flooding in Venice Italy
- This page discusses the significant flooding issues in Venice, driven by natural events, human factors, and exacerbated by climate change and rising sea levels. It highlights the monitoring of flood occurrences exceeding 110cm over ten-year intervals, showing a notable increase in flooding frequency. The implications for Venice and lessons for other coastal cities dealing with similar challenges are also explored.
Attributions
Modified by Erin Rempala from the following sources:
- City of San Diego. (n.d.). Sea level rise. Climate Resilient SD. San Diego.gov [www.sandiego.gov]
- National Oceanic and Atmospheric Administration. (n.d.). Sea Level Rise Viewer. NOAA Office for Coastal Management. NOAA.gov [coast.noaa.gov]
Modified by Melissa Ha and Rachel Schleiger from the following sources:
- Climate and the Effects of Global Climate Change from General Biology by OpenStax (licensed under CC-BY(opens in new window))
- Climate Change from Environmental Biology by Matthew R. Fisher (licensed under CC-BY(opens in new window))