
9: Microbial Growth
- Page ID
- 10667

\( \newcommand{\vecs}[1]{\overset { \scriptstyle \rightharpoonup} {\mathbf{#1}} } \)
\( \newcommand{\vecd}[1]{\overset{-\!-\!\rightharpoonup}{\vphantom{a}\smash {#1}}} \)
\( \newcommand{\dsum}{\displaystyle\sum\limits} \)
\( \newcommand{\dint}{\displaystyle\int\limits} \)
\( \newcommand{\dlim}{\displaystyle\lim\limits} \)
\( \newcommand{\id}{\mathrm{id}}\) \( \newcommand{\Span}{\mathrm{span}}\)
( \newcommand{\kernel}{\mathrm{null}\,}\) \( \newcommand{\range}{\mathrm{range}\,}\)
\( \newcommand{\RealPart}{\mathrm{Re}}\) \( \newcommand{\ImaginaryPart}{\mathrm{Im}}\)
\( \newcommand{\Argument}{\mathrm{Arg}}\) \( \newcommand{\norm}[1]{\| #1 \|}\)
\( \newcommand{\inner}[2]{\langle #1, #2 \rangle}\)
\( \newcommand{\Span}{\mathrm{span}}\)
\( \newcommand{\id}{\mathrm{id}}\)
\( \newcommand{\Span}{\mathrm{span}}\)
\( \newcommand{\kernel}{\mathrm{null}\,}\)
\( \newcommand{\range}{\mathrm{range}\,}\)
\( \newcommand{\RealPart}{\mathrm{Re}}\)
\( \newcommand{\ImaginaryPart}{\mathrm{Im}}\)
\( \newcommand{\Argument}{\mathrm{Arg}}\)
\( \newcommand{\norm}[1]{\| #1 \|}\)
\( \newcommand{\inner}[2]{\langle #1, #2 \rangle}\)
\( \newcommand{\Span}{\mathrm{span}}\) \( \newcommand{\AA}{\unicode[.8,0]{x212B}}\)
\( \newcommand{\vectorA}[1]{\vec{#1}} % arrow\)
\( \newcommand{\vectorAt}[1]{\vec{\text{#1}}} % arrow\)
\( \newcommand{\vectorB}[1]{\overset { \scriptstyle \rightharpoonup} {\mathbf{#1}} } \)
\( \newcommand{\vectorC}[1]{\textbf{#1}} \)
\( \newcommand{\vectorD}[1]{\overrightarrow{#1}} \)
\( \newcommand{\vectorDt}[1]{\overrightarrow{\text{#1}}} \)
\( \newcommand{\vectE}[1]{\overset{-\!-\!\rightharpoonup}{\vphantom{a}\smash{\mathbf {#1}}}} \)
\( \newcommand{\vecs}[1]{\overset { \scriptstyle \rightharpoonup} {\mathbf{#1}} } \)
\(\newcommand{\longvect}{\overrightarrow}\)
\( \newcommand{\vecd}[1]{\overset{-\!-\!\rightharpoonup}{\vphantom{a}\smash {#1}}} \)
\(\newcommand{\avec}{\mathbf a}\) \(\newcommand{\bvec}{\mathbf b}\) \(\newcommand{\cvec}{\mathbf c}\) \(\newcommand{\dvec}{\mathbf d}\) \(\newcommand{\dtil}{\widetilde{\mathbf d}}\) \(\newcommand{\evec}{\mathbf e}\) \(\newcommand{\fvec}{\mathbf f}\) \(\newcommand{\nvec}{\mathbf n}\) \(\newcommand{\pvec}{\mathbf p}\) \(\newcommand{\qvec}{\mathbf q}\) \(\newcommand{\svec}{\mathbf s}\) \(\newcommand{\tvec}{\mathbf t}\) \(\newcommand{\uvec}{\mathbf u}\) \(\newcommand{\vvec}{\mathbf v}\) \(\newcommand{\wvec}{\mathbf w}\) \(\newcommand{\xvec}{\mathbf x}\) \(\newcommand{\yvec}{\mathbf y}\) \(\newcommand{\zvec}{\mathbf z}\) \(\newcommand{\rvec}{\mathbf r}\) \(\newcommand{\mvec}{\mathbf m}\) \(\newcommand{\zerovec}{\mathbf 0}\) \(\newcommand{\onevec}{\mathbf 1}\) \(\newcommand{\real}{\mathbb R}\) \(\newcommand{\twovec}[2]{\left[\begin{array}{r}#1 \\ #2 \end{array}\right]}\) \(\newcommand{\ctwovec}[2]{\left[\begin{array}{c}#1 \\ #2 \end{array}\right]}\) \(\newcommand{\threevec}[3]{\left[\begin{array}{r}#1 \\ #2 \\ #3 \end{array}\right]}\) \(\newcommand{\cthreevec}[3]{\left[\begin{array}{c}#1 \\ #2 \\ #3 \end{array}\right]}\) \(\newcommand{\fourvec}[4]{\left[\begin{array}{r}#1 \\ #2 \\ #3 \\ #4 \end{array}\right]}\) \(\newcommand{\cfourvec}[4]{\left[\begin{array}{c}#1 \\ #2 \\ #3 \\ #4 \end{array}\right]}\) \(\newcommand{\fivevec}[5]{\left[\begin{array}{r}#1 \\ #2 \\ #3 \\ #4 \\ #5 \\ \end{array}\right]}\) \(\newcommand{\cfivevec}[5]{\left[\begin{array}{c}#1 \\ #2 \\ #3 \\ #4 \\ #5 \\ \end{array}\right]}\) \(\newcommand{\mattwo}[4]{\left[\begin{array}{rr}#1 \amp #2 \\ #3 \amp #4 \\ \end{array}\right]}\) \(\newcommand{\laspan}[1]{\text{Span}\{#1\}}\) \(\newcommand{\bcal}{\cal B}\) \(\newcommand{\ccal}{\cal C}\) \(\newcommand{\scal}{\cal S}\) \(\newcommand{\wcal}{\cal W}\) \(\newcommand{\ecal}{\cal E}\) \(\newcommand{\coords}[2]{\left\{#1\right\}_{#2}}\) \(\newcommand{\gray}[1]{\color{gray}{#1}}\) \(\newcommand{\lgray}[1]{\color{lightgray}{#1}}\) \(\newcommand{\rank}{\operatorname{rank}}\) \(\newcommand{\row}{\text{Row}}\) \(\newcommand{\col}{\text{Col}}\) \(\renewcommand{\row}{\text{Row}}\) \(\newcommand{\nul}{\text{Nul}}\) \(\newcommand{\var}{\text{Var}}\) \(\newcommand{\corr}{\text{corr}}\) \(\newcommand{\len}[1]{\left|#1\right|}\) \(\newcommand{\bbar}{\overline{\bvec}}\) \(\newcommand{\bhat}{\widehat{\bvec}}\) \(\newcommand{\bperp}{\bvec^\perp}\) \(\newcommand{\xhat}{\widehat{\xvec}}\) \(\newcommand{\vhat}{\widehat{\vvec}}\) \(\newcommand{\uhat}{\widehat{\uvec}}\) \(\newcommand{\what}{\widehat{\wvec}}\) \(\newcommand{\Sighat}{\widehat{\Sigma}}\) \(\newcommand{\lt}{<}\) \(\newcommand{\gt}{>}\) \(\newcommand{\amp}{&}\) \(\definecolor{fillinmathshade}{gray}{0.9}\)Provided with the right conditions (food, correct temperature, etc) microbes can grow very quickly. Depending on the situation, this could be a good thing for humans (yeast growing in wort to make beer) or a bad thing (bacteria growing in your throat causing strep throat). It’s important to have knowledge of their growth, so we can predict or control their growth under particular conditions. While growth for muticelluar organisms is typically measured in terms of the increase in size of a single organism, microbial growth is measured by the increase in population, either by measuring the increase in cell number or the increase in overall mass.
Bacterial Division
Bacteria and archaea reproduce asexually only, while eukartyotic microbes can engage in either sexual or asexual reproduction. Bacteria and archaea most commonly engage in a process known as binary fission, where a single cell splits into two equally sized cells. Other, less common processes can include multiple fission, budding, and the production of spores.
The process begins with cell elongation, which requires careful enlargement of the cell membrane and the cell wall, in addition to an increase in cell volume. The cell starts to replicate its DNA, in preparation for having two copies of its chromosome, one for each newly formed cell. The protein FtsZ is essential for the formation of a septum, which initially manifests as a ring in the middle of the elongated cell. After the nucleoids are segregated to each end of the elongated cell, septum formation is completed, dividing the elongated cell into two equally sized daughter cells. The entire process or cell cyclecan take as little as 20 minutes for an active culture of E. coli bacteria.
Growth Curve
Since bacteria are easy to grow in the lab, their growth has been studied extensively. It has been determined that in a closed system or batch culture (no food added, no wastes removed) bacteria will grow in a predictable pattern, resulting in a growth curve composed of four distinct phases of growth: the lag phase, the exponential or log phase, the stationary phase, and the death or decline phase. Additionally, this growth curve can yield generation time for a particular organism – the amount of time it takes for the population to double.
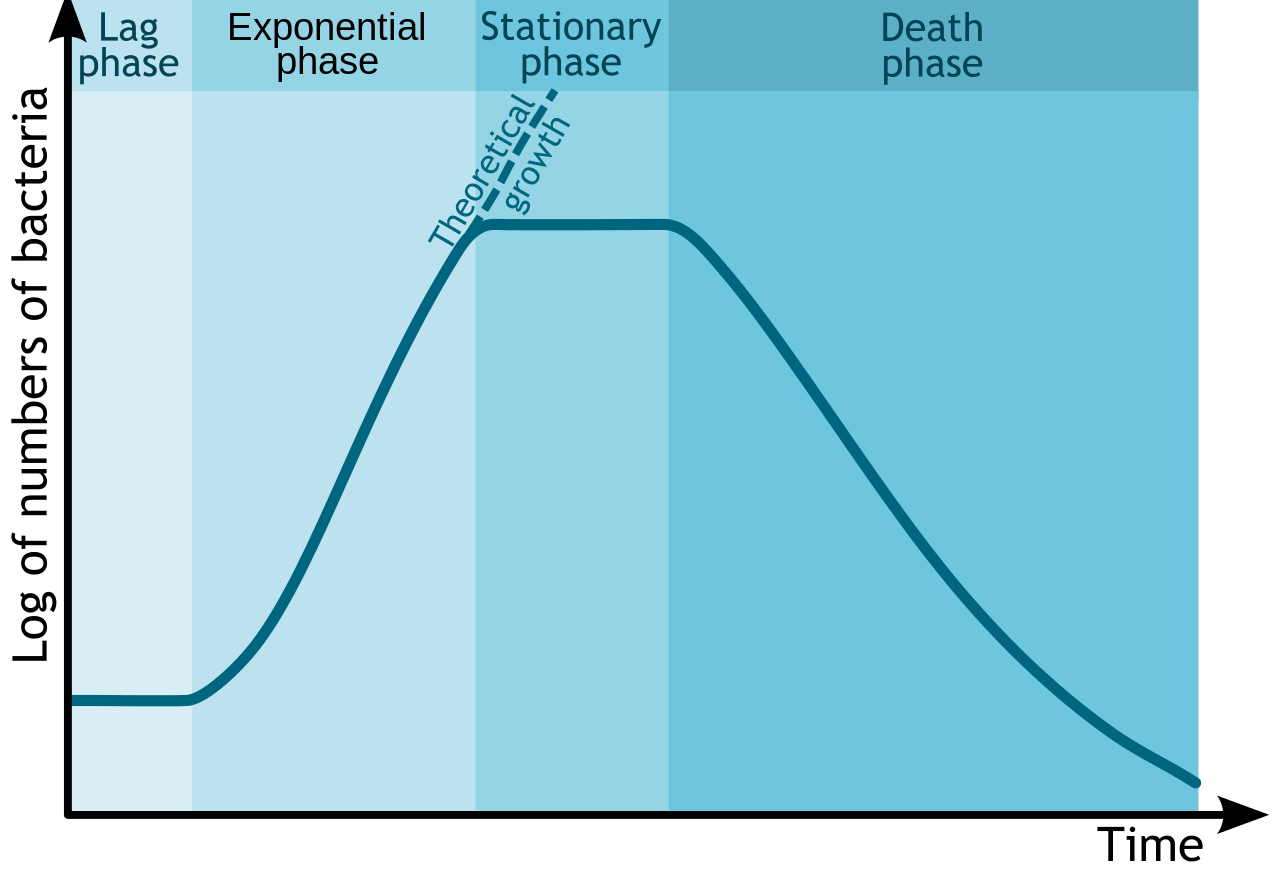
Bacterial Growth Curve. By Michał Komorniczak. If you use on your website or in your publication my images (either original or modified), you are requested to give me details: Michał Komorniczak (Poland) or Michal Komorniczak (Poland). For more information, write to my e-mail address: m.komorniczak.pl@gmail.com [CC BY-SA 3.0], via Wikimedia Commons
The details associated with each growth curve (number of cells, length of each phase, rapidness of growth or death, overall amount of time) will vary from organism to organism or even with different conditions for the same organism. But the pattern of four distinct phases of growth will typically remain.
Lag phase
The lag phase is an adaptation period, where the bacteria are adjusting to their new conditions. The length of the lag phase can vary considerably, based on how different the conditions are from the conditions that the bacteria came from, as well as the condition of the bacterial cells themselves. Actively growing cells transferred from one type of media into the same type of media, with the same environmental conditions, will have the shortest lag period. Damaged cells will have a long lag period, since they must repair themselves before they can engage in reproduction.
Typically cells in the lag period are synthesizing RNA, enzymes, and essential metabolites that might be missing from their new environment (such as growth factors or macromolecules), as well as adjusting to environmental changes such as changes in temperature, pH, or oxygen availability. They can also be undertaking any necessary repair of injured cells.
Exponential or Log phase
Once cells have accumulated all that they need for growth, they proceed into cell division. The exponential or log phase of growth is marked by predictable doublings of the population, where 1 cell become 2 cells, becomes 4, becomes 8 etc. Conditions that are optimal for the cells will result in very rapid growth (and a steeper slope on the growth curve), while less than ideal conditions will result in slower growth. Cells in the exponential phase of growth are the healthiest and most uniform, which explains why most experiments utilize cells from this phase.
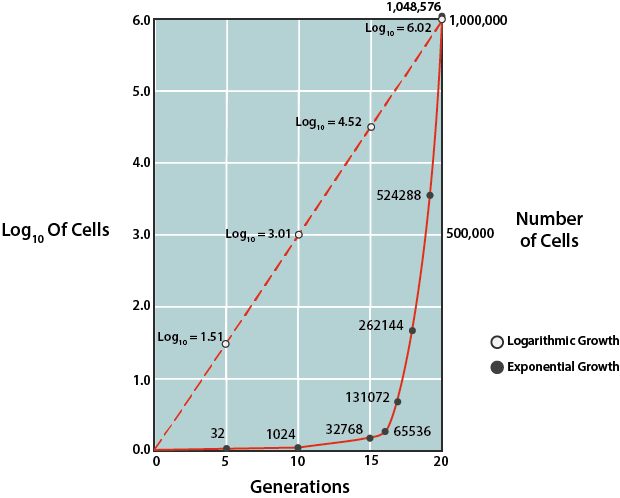
Bacterial Growth Rates.
Due to the predictability of growth in this phase, this phase can be used to mathematically calculate the time it takes for the bacterial population to double in number, known as the generation time (g). This information is used by microbiologists in basic research, as well as in industry. In order to determine generation time, the natural logarithm of cell number can be plotted against time (where the units can vary, depending upon speed of growth for the particular population), using a semilogarithmic graph to generate a line with a predictable slope.
The slope of the line is equal to 0.301/g. Alternatively one can rely on the fixed relationship between the initial number of cells at the start of the exponential phase and the number of cells after some period of time, which can be expressed by:
\[N = N_02^{n}\]
where \(N\) is the final cell concentration, \(N_0\) is the initial cell concentration, and \(n\) is the number of generations that occurred between the specified period of time.
Generation time (g) can be represented by t/n, with t being the specified period of time in minutes, hours, days, or months. Thus, if one knows the cell concentration at the start of the exponential phase of growth and the cell concentration after some period of time of exponential growth, the number of generations can be calculated. Then, using the amount of time that growth was allowed to proceed (t), one can calculate g.
Stationary Phase
All good things must come to an end (otherwise bacteria would equal the mass of the Earth in 7 days!). At some point the bacterial population runs out of an essential nutrient/chemical or its growth is inhibited by its own waste products (it is a closed container, remember?) or lack of physical space, causing the cells to enter into the stationary phase. At this point the number of new cells being produced is equal to the number of cells dying off or growth has entirely ceased, resulting in a flattening out of growth on the growth curve.
Physiologically the cells become quite different at this stage, as they try to adapt to their new starvation conditions. The few new cells that are produced are smaller in size, with bacilli becoming almost spherical in shape. Their plasma membrane becomes less fluid and permeable, with more hydrophobic molecules on the surface that promote cell adhesion and aggregation. The nucleoid condenses and the DNA becomes bound with DNA-binding proteins from starved cells (DPS), to protect the DNA from damage. The changes are designed to allow the cell to survive for a longer period of time in adverse conditions, while waiting for more optimal conditions (such as an infusion of nutrients) to occur. These same strategies are used by cells in oligotrophic or low-nutrient environments. It has been hypothesized that cells in the natural world (i.e. outside of the laboratory) typically exist for long periods of time in oligotrophic environments, with only sporadic infusions of nutrients that return them to exponential growth for very brief periods of time.
During the stationary phase cells are also prone to producing secondary metabolites, or metabolites produced after active growth, such as antibiotics. Cells that are capable of making an endospore will activate the necessary genes during this stage, in order to initiate the sporulation process.
Death or Decline phase
In the last phase of the growth curve, the death or decline phase, the number of viable cells decreases in a predictable (or exponential) fashion. The steepness of the slope corresponds to how fast cells are losing viability. It is thought that the culture conditions have deteriorated to a point where the cells are irreparably harmed, since cells collected from this phase fail to show growth when transferred to fresh medium. It is important to note that if the turbidity of a culture is being measured as a way to determine cell density, measurements might not decrease during this phase, since cells could still be intact.
It has been suggested that the cells thought to be dead might be revived under specific conditions, a condition described as viable but nonculturable (VBNC). This state might be of importance for pathogens, where they enter a state of very low metabolism and lack of cellular division, only to resume growth at a later time, when conditions improve.
It has also been shown that 100% cell death is unlikely, for any cell population, as the cells mutate to adapt to their environmental conditions, however harsh. Often there is a tailing effect observed, where a small population of the cells cannot be killed off. In addition, these cells might benefit from their death of their fellow cells, which provide nutrients to the environment as they lyse and release their cellular contents.
Key Words
binary fission, multiple fission, budding, spores, cell cycle, closed system, batch culture, growth curve, lag phase, exponential or log phase, generation time (g), N, N0, n, t, stationary phase, DNA-binding proteins from starved cells (DPS), oligotrophic, secondary metabolites, death or decline phase, viable but nonculturable (VBNC).
Essential Questions/Objectives
- How is growth measured in microbial populations?
- How do eukaryotes and bacteria/archaea differ in their reproductive methods?
- What are the steps of binary fission? What is happening at each step?
- Know what the growth curve of an organism grown in a closed system looks like. Know the various stages and what is occurring at each stage, physiologically. What can influence lag phase? What are the 2 differing explanations for cell loss in the death or senescence phase?
- Understand generation time and how can it be determined on a log number of cells vs. time graph. Know the advantage of plotting the log number of cells vs. time instead of the number of cells vs. time. What factors affect the generation time of an organism?
- Practice problem: Six Staphylococcus aureus are inoculated into a cream pie by the hands of a pastry chef. The generation time of S. aureus in cream pie at room temperature is 30 minutes. a) How many S. aureus are in the pie after 4 hours at RT? b) After 24 hours?
Exploratory Questions (OPTIONAL)
- In what situation would the VBNC occurrence benefit cells? How could this pose a public health threat?