
11.8: Data Dive- Island Fox Populations
- Page ID
- 46709

\( \newcommand{\vecs}[1]{\overset { \scriptstyle \rightharpoonup} {\mathbf{#1}} } \)
\( \newcommand{\vecd}[1]{\overset{-\!-\!\rightharpoonup}{\vphantom{a}\smash {#1}}} \)
\( \newcommand{\dsum}{\displaystyle\sum\limits} \)
\( \newcommand{\dint}{\displaystyle\int\limits} \)
\( \newcommand{\dlim}{\displaystyle\lim\limits} \)
\( \newcommand{\id}{\mathrm{id}}\) \( \newcommand{\Span}{\mathrm{span}}\)
( \newcommand{\kernel}{\mathrm{null}\,}\) \( \newcommand{\range}{\mathrm{range}\,}\)
\( \newcommand{\RealPart}{\mathrm{Re}}\) \( \newcommand{\ImaginaryPart}{\mathrm{Im}}\)
\( \newcommand{\Argument}{\mathrm{Arg}}\) \( \newcommand{\norm}[1]{\| #1 \|}\)
\( \newcommand{\inner}[2]{\langle #1, #2 \rangle}\)
\( \newcommand{\Span}{\mathrm{span}}\)
\( \newcommand{\id}{\mathrm{id}}\)
\( \newcommand{\Span}{\mathrm{span}}\)
\( \newcommand{\kernel}{\mathrm{null}\,}\)
\( \newcommand{\range}{\mathrm{range}\,}\)
\( \newcommand{\RealPart}{\mathrm{Re}}\)
\( \newcommand{\ImaginaryPart}{\mathrm{Im}}\)
\( \newcommand{\Argument}{\mathrm{Arg}}\)
\( \newcommand{\norm}[1]{\| #1 \|}\)
\( \newcommand{\inner}[2]{\langle #1, #2 \rangle}\)
\( \newcommand{\Span}{\mathrm{span}}\) \( \newcommand{\AA}{\unicode[.8,0]{x212B}}\)
\( \newcommand{\vectorA}[1]{\vec{#1}} % arrow\)
\( \newcommand{\vectorAt}[1]{\vec{\text{#1}}} % arrow\)
\( \newcommand{\vectorB}[1]{\overset { \scriptstyle \rightharpoonup} {\mathbf{#1}} } \)
\( \newcommand{\vectorC}[1]{\textbf{#1}} \)
\( \newcommand{\vectorD}[1]{\overrightarrow{#1}} \)
\( \newcommand{\vectorDt}[1]{\overrightarrow{\text{#1}}} \)
\( \newcommand{\vectE}[1]{\overset{-\!-\!\rightharpoonup}{\vphantom{a}\smash{\mathbf {#1}}}} \)
\( \newcommand{\vecs}[1]{\overset { \scriptstyle \rightharpoonup} {\mathbf{#1}} } \)
\(\newcommand{\longvect}{\overrightarrow}\)
\( \newcommand{\vecd}[1]{\overset{-\!-\!\rightharpoonup}{\vphantom{a}\smash {#1}}} \)
\(\newcommand{\avec}{\mathbf a}\) \(\newcommand{\bvec}{\mathbf b}\) \(\newcommand{\cvec}{\mathbf c}\) \(\newcommand{\dvec}{\mathbf d}\) \(\newcommand{\dtil}{\widetilde{\mathbf d}}\) \(\newcommand{\evec}{\mathbf e}\) \(\newcommand{\fvec}{\mathbf f}\) \(\newcommand{\nvec}{\mathbf n}\) \(\newcommand{\pvec}{\mathbf p}\) \(\newcommand{\qvec}{\mathbf q}\) \(\newcommand{\svec}{\mathbf s}\) \(\newcommand{\tvec}{\mathbf t}\) \(\newcommand{\uvec}{\mathbf u}\) \(\newcommand{\vvec}{\mathbf v}\) \(\newcommand{\wvec}{\mathbf w}\) \(\newcommand{\xvec}{\mathbf x}\) \(\newcommand{\yvec}{\mathbf y}\) \(\newcommand{\zvec}{\mathbf z}\) \(\newcommand{\rvec}{\mathbf r}\) \(\newcommand{\mvec}{\mathbf m}\) \(\newcommand{\zerovec}{\mathbf 0}\) \(\newcommand{\onevec}{\mathbf 1}\) \(\newcommand{\real}{\mathbb R}\) \(\newcommand{\twovec}[2]{\left[\begin{array}{r}#1 \\ #2 \end{array}\right]}\) \(\newcommand{\ctwovec}[2]{\left[\begin{array}{c}#1 \\ #2 \end{array}\right]}\) \(\newcommand{\threevec}[3]{\left[\begin{array}{r}#1 \\ #2 \\ #3 \end{array}\right]}\) \(\newcommand{\cthreevec}[3]{\left[\begin{array}{c}#1 \\ #2 \\ #3 \end{array}\right]}\) \(\newcommand{\fourvec}[4]{\left[\begin{array}{r}#1 \\ #2 \\ #3 \\ #4 \end{array}\right]}\) \(\newcommand{\cfourvec}[4]{\left[\begin{array}{c}#1 \\ #2 \\ #3 \\ #4 \end{array}\right]}\) \(\newcommand{\fivevec}[5]{\left[\begin{array}{r}#1 \\ #2 \\ #3 \\ #4 \\ #5 \\ \end{array}\right]}\) \(\newcommand{\cfivevec}[5]{\left[\begin{array}{c}#1 \\ #2 \\ #3 \\ #4 \\ #5 \\ \end{array}\right]}\) \(\newcommand{\mattwo}[4]{\left[\begin{array}{rr}#1 \amp #2 \\ #3 \amp #4 \\ \end{array}\right]}\) \(\newcommand{\laspan}[1]{\text{Span}\{#1\}}\) \(\newcommand{\bcal}{\cal B}\) \(\newcommand{\ccal}{\cal C}\) \(\newcommand{\scal}{\cal S}\) \(\newcommand{\wcal}{\cal W}\) \(\newcommand{\ecal}{\cal E}\) \(\newcommand{\coords}[2]{\left\{#1\right\}_{#2}}\) \(\newcommand{\gray}[1]{\color{gray}{#1}}\) \(\newcommand{\lgray}[1]{\color{lightgray}{#1}}\) \(\newcommand{\rank}{\operatorname{rank}}\) \(\newcommand{\row}{\text{Row}}\) \(\newcommand{\col}{\text{Col}}\) \(\renewcommand{\row}{\text{Row}}\) \(\newcommand{\nul}{\text{Nul}}\) \(\newcommand{\var}{\text{Var}}\) \(\newcommand{\corr}{\text{corr}}\) \(\newcommand{\len}[1]{\left|#1\right|}\) \(\newcommand{\bbar}{\overline{\bvec}}\) \(\newcommand{\bhat}{\widehat{\bvec}}\) \(\newcommand{\bperp}{\bvec^\perp}\) \(\newcommand{\xhat}{\widehat{\xvec}}\) \(\newcommand{\vhat}{\widehat{\vvec}}\) \(\newcommand{\uhat}{\widehat{\uvec}}\) \(\newcommand{\what}{\widehat{\wvec}}\) \(\newcommand{\Sighat}{\widehat{\Sigma}}\) \(\newcommand{\lt}{<}\) \(\newcommand{\gt}{>}\) \(\newcommand{\amp}{&}\) \(\definecolor{fillinmathshade}{gray}{0.9}\)Overview
The Island Fox Conservation Working Group and Friends of the Island Fox nonprofit organization work hard to continually fund research and conservation projects to ensure the continued survival of the island fox. In addition, they also have educational outreach programs about the island fox as an endangered species to get public support. Every June the Island Fox Conservation Working Group meets to go over updates and plan for the future. In the 2019 meeting they discussed population trends across the six island fox subspecies and determine what those populations mean for the subspecies trajectory moving into the future. The results of this meeting can be seen in the graph and table below:
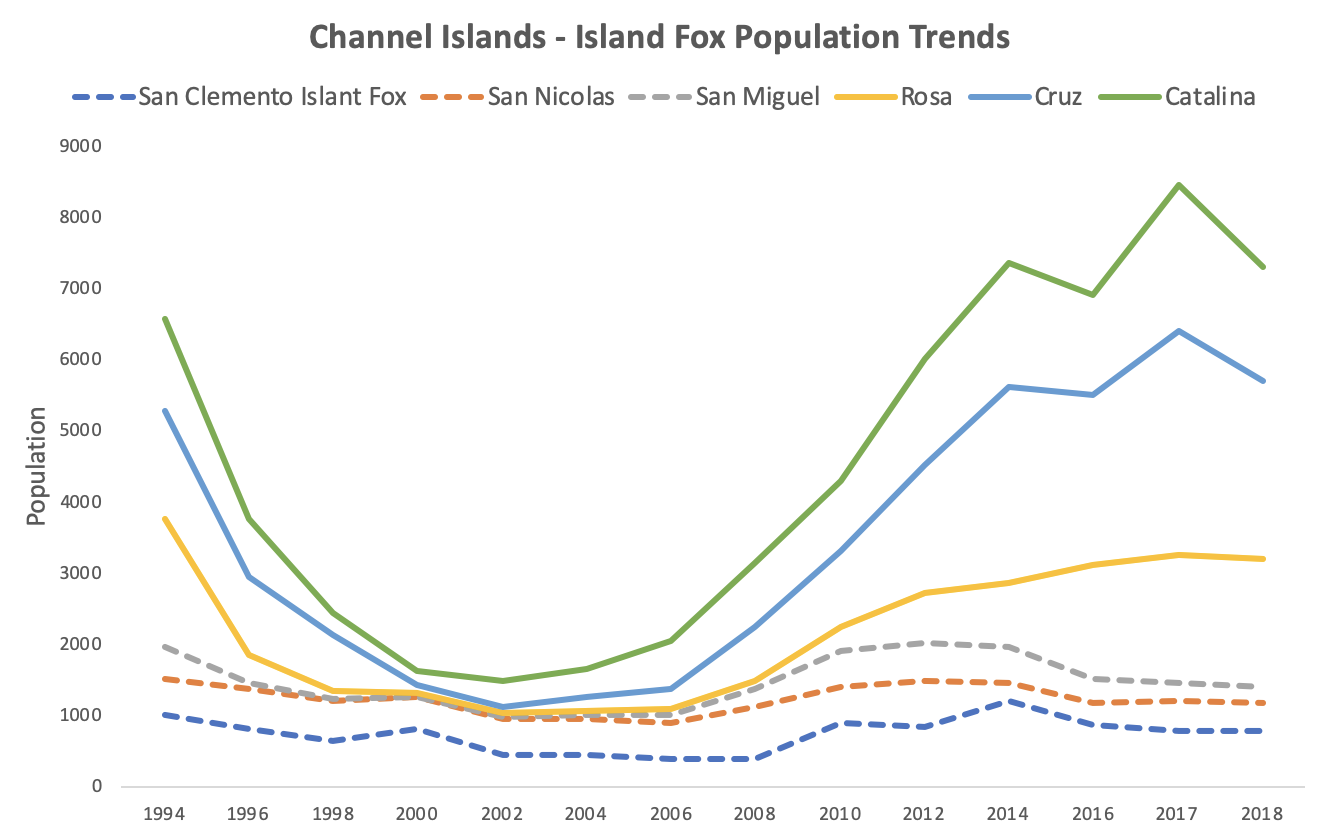
Table \(\PageIndex{a}\): The 2019 designated statuses for the subspecies of island fox based on fox population and island size. Graph by Rachel Schleiger (CC-BY-NC) modified from data in 2019 Island Fox Status Update.
| Island | Island Size | Fox Population | Status |
|---|---|---|---|
| San Miguel | Small | 171 | Concerned |
| San Nicolas | Small | 400 | Improved |
| Santa Rosa | Large | 1862 | Stable |
| Santa Cruz | Large | 2462 | Stable |
| Santa Catalina | Large | 1571 | Stable |
| San Clemento | Small | 778 | Stable |
Questions
- What is the independent (explanatory) variable and the dependent (response) variable?
- What question(s) are the authors trying to answer with this graph and table?
- Which subspecies of island fox do you think is the most stable? Why?
- Which year(s) were bad (meaning population estimates were very low) for most of the island fox subspecies?
- As noted in the graph, populations are estimated for each subspecies annually. Why do you think an annual estimation was chosen in the conservation plan instead of a longer time interval?
Raw Data From Above Graph(s)
Table \(\PageIndex{b}\): Raw data for population trends for subspecies of island fox (solid lines = large island subspecies, dashed lines = small island subspecies). Graph by Rachel Schleiger (CC-BY-NC) modified from data in 2019 Island Fox Status Update.
| Year | San Clemento | San Nicolas | San Miguel | Santa Rosa | Santa Cruz | Santa Catalina |
|---|---|---|---|---|---|---|
| 1994 | 1000 | 520 | 450 | 1800 | 1500 | 1300 |
| 1996 | 810 | 550 | 100 | 400 | 1100 | 800 |
| 1998 | 650 | 550 | 40 | 100 | 800 | 300 |
| 2000 | 800 | 450 | 20 | 50 | 100 | 200 |
| 2002 | 450 | 500 | 25 | 60 | 90 | 350 |
| 2004 | 450 | 500 | 50 | 70 | 200 | 375 |
| 2006 | 400 | 506 | 100 | 80 | 300 | 650 |
| 2008 | 400 | 725 | 260 | 100 | 750 | 900 |
| 2010 | 900 | 500 | 500 | 350 | 1050 | 1000 |
| 2012 | 850 | 640 | 525 | 700 | 1800 | 1500 |
| 2014 | 1200 | 263 | 510 | 900 | 2750 | 1750 |
| 2016 | 860 | 329 | 329 | 1600 | 2400 | 1400 |
| 2017 | 775 | 255 | 255 | 1800 | 3150 | 2050 |
| 2018 | 790 | 400 | 200 | 1800 | 2500 | 1600 |
Attribution
Rachel Schleiger (CC-BY-NC)