17.4: Consequences of Nuclear Energy
- Page ID
- 32238
\( \newcommand{\vecs}[1]{\overset { \scriptstyle \rightharpoonup} {\mathbf{#1}} } \)
\( \newcommand{\vecd}[1]{\overset{-\!-\!\rightharpoonup}{\vphantom{a}\smash {#1}}} \)
\( \newcommand{\dsum}{\displaystyle\sum\limits} \)
\( \newcommand{\dint}{\displaystyle\int\limits} \)
\( \newcommand{\dlim}{\displaystyle\lim\limits} \)
\( \newcommand{\id}{\mathrm{id}}\) \( \newcommand{\Span}{\mathrm{span}}\)
( \newcommand{\kernel}{\mathrm{null}\,}\) \( \newcommand{\range}{\mathrm{range}\,}\)
\( \newcommand{\RealPart}{\mathrm{Re}}\) \( \newcommand{\ImaginaryPart}{\mathrm{Im}}\)
\( \newcommand{\Argument}{\mathrm{Arg}}\) \( \newcommand{\norm}[1]{\| #1 \|}\)
\( \newcommand{\inner}[2]{\langle #1, #2 \rangle}\)
\( \newcommand{\Span}{\mathrm{span}}\)
\( \newcommand{\id}{\mathrm{id}}\)
\( \newcommand{\Span}{\mathrm{span}}\)
\( \newcommand{\kernel}{\mathrm{null}\,}\)
\( \newcommand{\range}{\mathrm{range}\,}\)
\( \newcommand{\RealPart}{\mathrm{Re}}\)
\( \newcommand{\ImaginaryPart}{\mathrm{Im}}\)
\( \newcommand{\Argument}{\mathrm{Arg}}\)
\( \newcommand{\norm}[1]{\| #1 \|}\)
\( \newcommand{\inner}[2]{\langle #1, #2 \rangle}\)
\( \newcommand{\Span}{\mathrm{span}}\) \( \newcommand{\AA}{\unicode[.8,0]{x212B}}\)
\( \newcommand{\vectorA}[1]{\vec{#1}} % arrow\)
\( \newcommand{\vectorAt}[1]{\vec{\text{#1}}} % arrow\)
\( \newcommand{\vectorB}[1]{\overset { \scriptstyle \rightharpoonup} {\mathbf{#1}} } \)
\( \newcommand{\vectorC}[1]{\textbf{#1}} \)
\( \newcommand{\vectorD}[1]{\overrightarrow{#1}} \)
\( \newcommand{\vectorDt}[1]{\overrightarrow{\text{#1}}} \)
\( \newcommand{\vectE}[1]{\overset{-\!-\!\rightharpoonup}{\vphantom{a}\smash{\mathbf {#1}}}} \)
\( \newcommand{\vecs}[1]{\overset { \scriptstyle \rightharpoonup} {\mathbf{#1}} } \)
\(\newcommand{\longvect}{\overrightarrow}\)
\( \newcommand{\vecd}[1]{\overset{-\!-\!\rightharpoonup}{\vphantom{a}\smash {#1}}} \)
\(\newcommand{\avec}{\mathbf a}\) \(\newcommand{\bvec}{\mathbf b}\) \(\newcommand{\cvec}{\mathbf c}\) \(\newcommand{\dvec}{\mathbf d}\) \(\newcommand{\dtil}{\widetilde{\mathbf d}}\) \(\newcommand{\evec}{\mathbf e}\) \(\newcommand{\fvec}{\mathbf f}\) \(\newcommand{\nvec}{\mathbf n}\) \(\newcommand{\pvec}{\mathbf p}\) \(\newcommand{\qvec}{\mathbf q}\) \(\newcommand{\svec}{\mathbf s}\) \(\newcommand{\tvec}{\mathbf t}\) \(\newcommand{\uvec}{\mathbf u}\) \(\newcommand{\vvec}{\mathbf v}\) \(\newcommand{\wvec}{\mathbf w}\) \(\newcommand{\xvec}{\mathbf x}\) \(\newcommand{\yvec}{\mathbf y}\) \(\newcommand{\zvec}{\mathbf z}\) \(\newcommand{\rvec}{\mathbf r}\) \(\newcommand{\mvec}{\mathbf m}\) \(\newcommand{\zerovec}{\mathbf 0}\) \(\newcommand{\onevec}{\mathbf 1}\) \(\newcommand{\real}{\mathbb R}\) \(\newcommand{\twovec}[2]{\left[\begin{array}{r}#1 \\ #2 \end{array}\right]}\) \(\newcommand{\ctwovec}[2]{\left[\begin{array}{c}#1 \\ #2 \end{array}\right]}\) \(\newcommand{\threevec}[3]{\left[\begin{array}{r}#1 \\ #2 \\ #3 \end{array}\right]}\) \(\newcommand{\cthreevec}[3]{\left[\begin{array}{c}#1 \\ #2 \\ #3 \end{array}\right]}\) \(\newcommand{\fourvec}[4]{\left[\begin{array}{r}#1 \\ #2 \\ #3 \\ #4 \end{array}\right]}\) \(\newcommand{\cfourvec}[4]{\left[\begin{array}{c}#1 \\ #2 \\ #3 \\ #4 \end{array}\right]}\) \(\newcommand{\fivevec}[5]{\left[\begin{array}{r}#1 \\ #2 \\ #3 \\ #4 \\ #5 \\ \end{array}\right]}\) \(\newcommand{\cfivevec}[5]{\left[\begin{array}{c}#1 \\ #2 \\ #3 \\ #4 \\ #5 \\ \end{array}\right]}\) \(\newcommand{\mattwo}[4]{\left[\begin{array}{rr}#1 \amp #2 \\ #3 \amp #4 \\ \end{array}\right]}\) \(\newcommand{\laspan}[1]{\text{Span}\{#1\}}\) \(\newcommand{\bcal}{\cal B}\) \(\newcommand{\ccal}{\cal C}\) \(\newcommand{\scal}{\cal S}\) \(\newcommand{\wcal}{\cal W}\) \(\newcommand{\ecal}{\cal E}\) \(\newcommand{\coords}[2]{\left\{#1\right\}_{#2}}\) \(\newcommand{\gray}[1]{\color{gray}{#1}}\) \(\newcommand{\lgray}[1]{\color{lightgray}{#1}}\) \(\newcommand{\rank}{\operatorname{rank}}\) \(\newcommand{\row}{\text{Row}}\) \(\newcommand{\col}{\text{Col}}\) \(\renewcommand{\row}{\text{Row}}\) \(\newcommand{\nul}{\text{Nul}}\) \(\newcommand{\var}{\text{Var}}\) \(\newcommand{\corr}{\text{corr}}\) \(\newcommand{\len}[1]{\left|#1\right|}\) \(\newcommand{\bbar}{\overline{\bvec}}\) \(\newcommand{\bhat}{\widehat{\bvec}}\) \(\newcommand{\bperp}{\bvec^\perp}\) \(\newcommand{\xhat}{\widehat{\xvec}}\) \(\newcommand{\vhat}{\widehat{\vvec}}\) \(\newcommand{\uhat}{\widehat{\uvec}}\) \(\newcommand{\what}{\widehat{\wvec}}\) \(\newcommand{\Sighat}{\widehat{\Sigma}}\) \(\newcommand{\lt}{<}\) \(\newcommand{\gt}{>}\) \(\newcommand{\amp}{&}\) \(\definecolor{fillinmathshade}{gray}{0.9}\)The use of nuclear energy presents an interesting dilemma. On the one hand, nuclear electricity produces no carbon emissions, a major sustainable advantage in a world facing climate change. On the other hand, there is environmental risk of storing spent fuel for thousands or hundreds of thousands of years, societal risk of nuclear proliferation, and the impact of accidental releases of radiation from operating reactors. Thoughtful scientists, policy makers, and citizens must weigh these advantages and disadvantages.
Advantages of Nuclear Energy
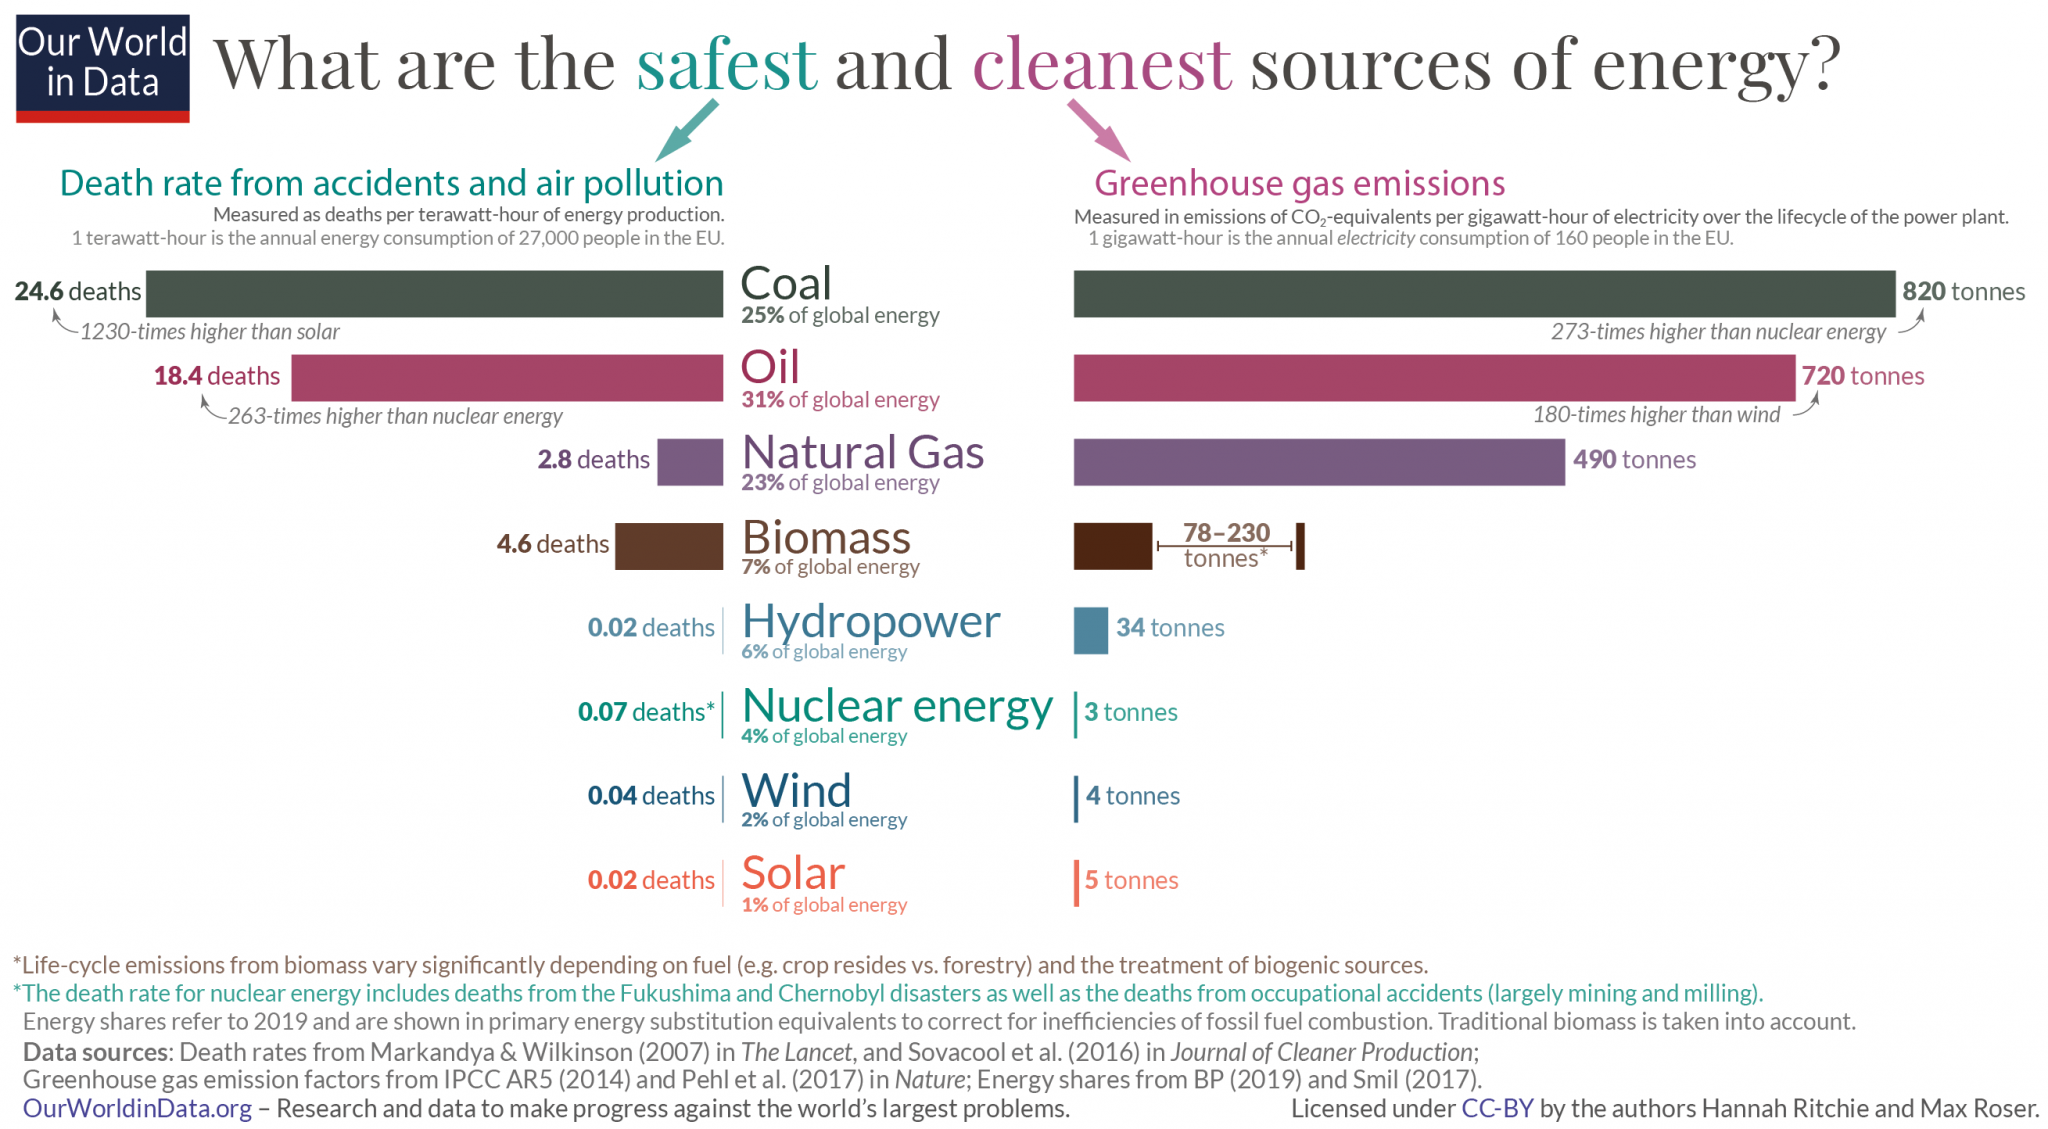
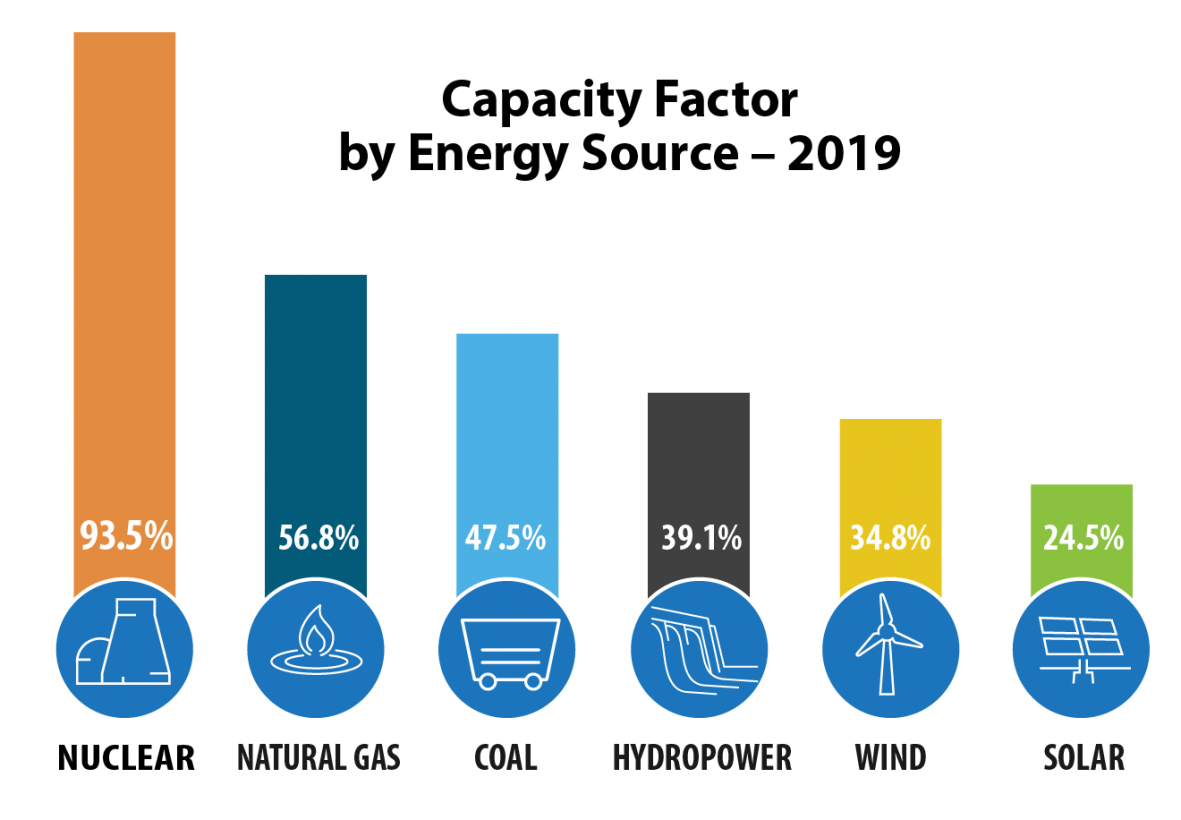
In contrast to fossil fuels, generating electricity from nuclear energy does not pollute the air or significantly contribute to climate change (figure \(\PageIndex{a}\)). As we continue to deplete global reserves of fossil fuels, supplies of nuclear fuel are abundant. It is estimated that uranium supplies will last over 200 years, and there is potential to use other radioactive isotopes as well. Furthermore, nuclear power plants are more reliable than any other source, with a capacity factor of 93.5% (figure \(\PageIndex{b}\)). Capacity is the amount of electricity a generator can produce when it’s running at full blast, and the capacity factor is a measure of how often a plant is running at maximum power. (A power plant with a capacity factor of 100% means that it's producing power all of the time.)
Negative Impacts of Nuclear Energy
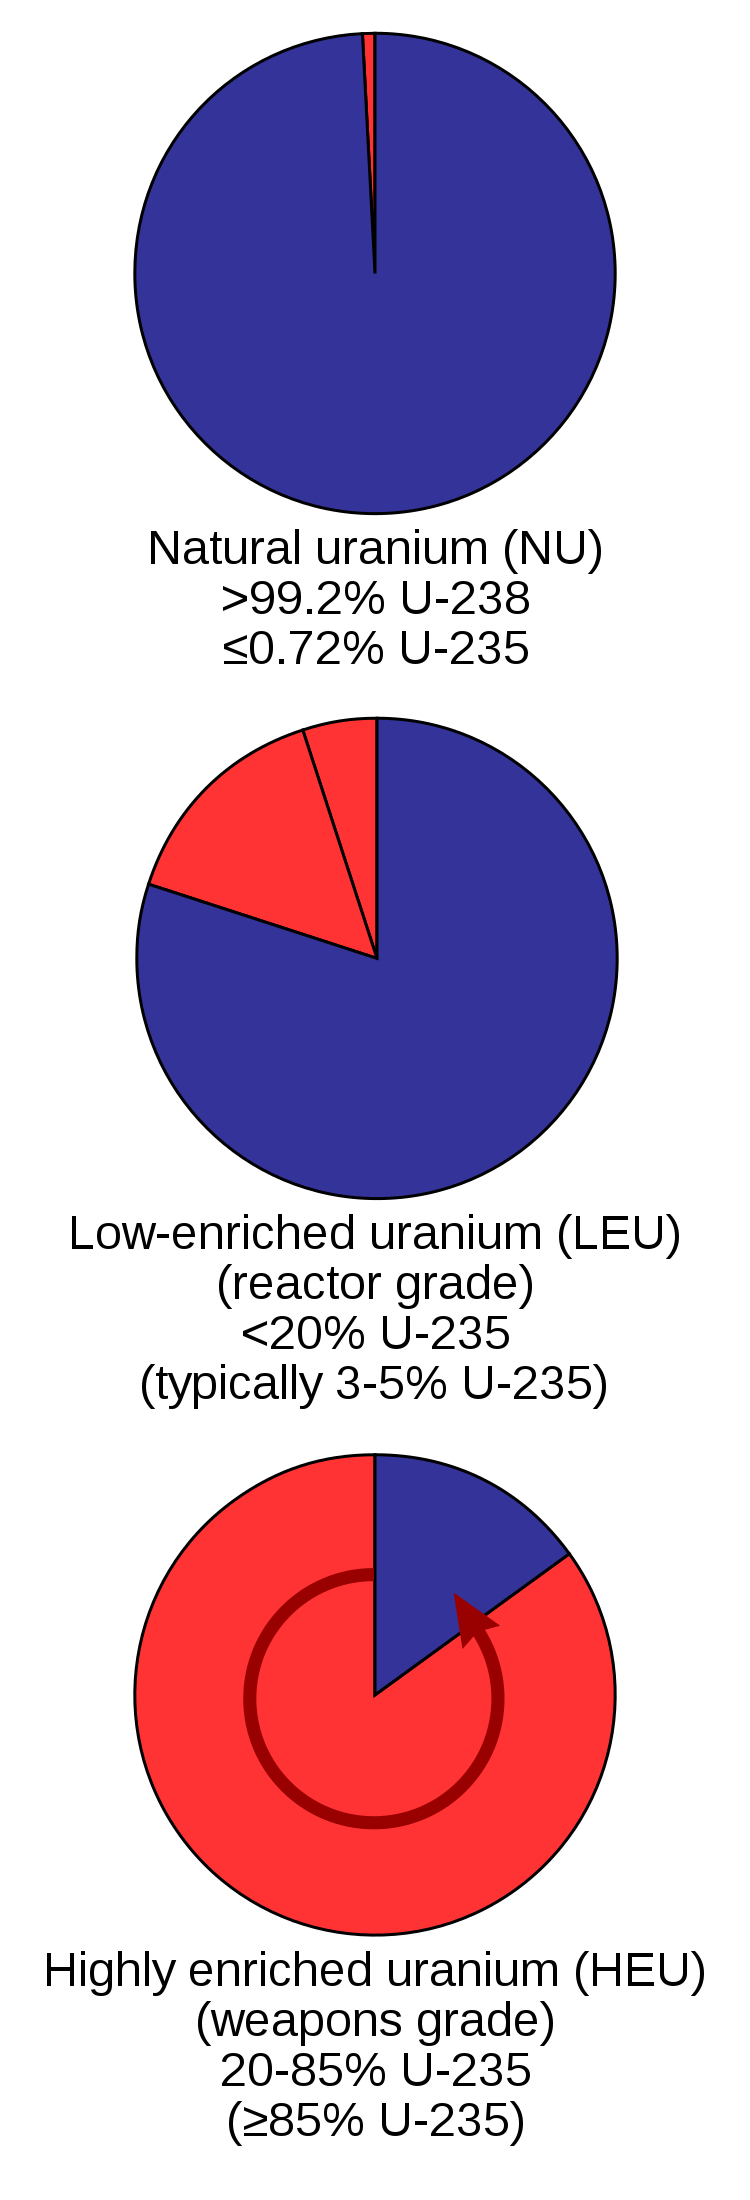
Despite its benefits, nuclear power has downsides. It requires more water than any other energy source. Water used for cooling is released back into the environment, and while it does not contain radioactive materials or other harmful chemicals, it is warmer than before. This is called thermal pollution, and it can harm aquatic life, which are adapted to cooler temperatures. Surface mining for uranium ore degrades habitat and releases toxins from underground (similar to surface mining for coal). Nuclear power plants are expensive to build and maintain, and they require large amounts of metal and concrete. Enriched uranium for nuclear fuel if in the wrong hands can be used to make nuclear weapons (figure \(\PageIndex{c}\)). While nuclear accidents are rare, they can cause great harm, and their impacts are long-lasting. Furthermore, the problem of safely disposing spent nuclear fuel remains unresolved. The latter two concerns are discussed in more detail below.
Nuclear Waste
The main environmental challenge for nuclear power is the wastes including high-level radioactive waste, low-level radioactive waste, and uranium mill tailings. These materials have long radioactive half-lives and thus remain a threat to human health for thousands of years.
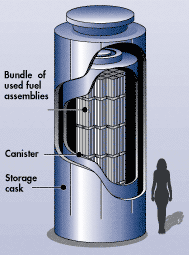
High-level radioactive waste (HLRW) consists of used nuclear reactor fuel (spent nuclear fuel rods). These contain the products of nuclear fission, which are radioactive themselves. This HLRW is temporarily stored in a pool at the nuclear power plant or a dry cask, steel cylinders within another container, made of steel or concrete (figure \(\PageIndex{d}\)). Dry casks contain inert (nonreactive) gas and may be located at the power plant, a decommissioned power plant, or a separate storage site. High-level radioactive waste may only be moved to a dry cask after one year of cooling in a pool. The U.S. has no long-term storage for HLRW, and spent fuel thus remains interim storage.
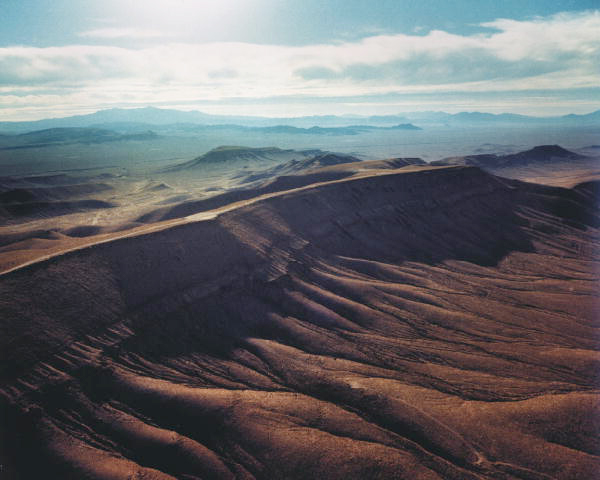
Yucca Mountain in Nevada was proposed as a long-term geologic storage site, where HLRW could be buried for hundreds of thousands of years. The storage facility was constructed, but it has not been used due to opposition from local residents and concern about the safety of transporting HLNW (figure \(\PageIndex{e}\))
Some countries reprocess (recycle) spent nuclear fuel, but no recycling or reprocessing facility or a federal waste repository is currently licensed in the United States. Reprocessing separates the useable fraction of spent fuel and recycles it through the reactor, using a greater fraction of its energy content for electricity production, and sends the remaining high-level waste to permanent geologic storage.
The primary motivation for reprocessing is greater use of fuel resources, extracting about 25 percent more energy than the once through cycle. A secondary motivation for recycling is a significant reduction of the permanent geologic storage space (to 20% or less of what would otherwise be needed) and time (from hundreds of thousands of years to thousands of years). While these advantages seem natural and appealing from a sustainability perspective, they are complicated by the risk of theft of nuclear material from the reprocessing cycle for use in illicit weapons production or other non-sustainable ends. At present, France, the United Kingdom, Russia, Japan, and China engage in some form of reprocessing; the United States, Sweden, and Finland do not reprocess.
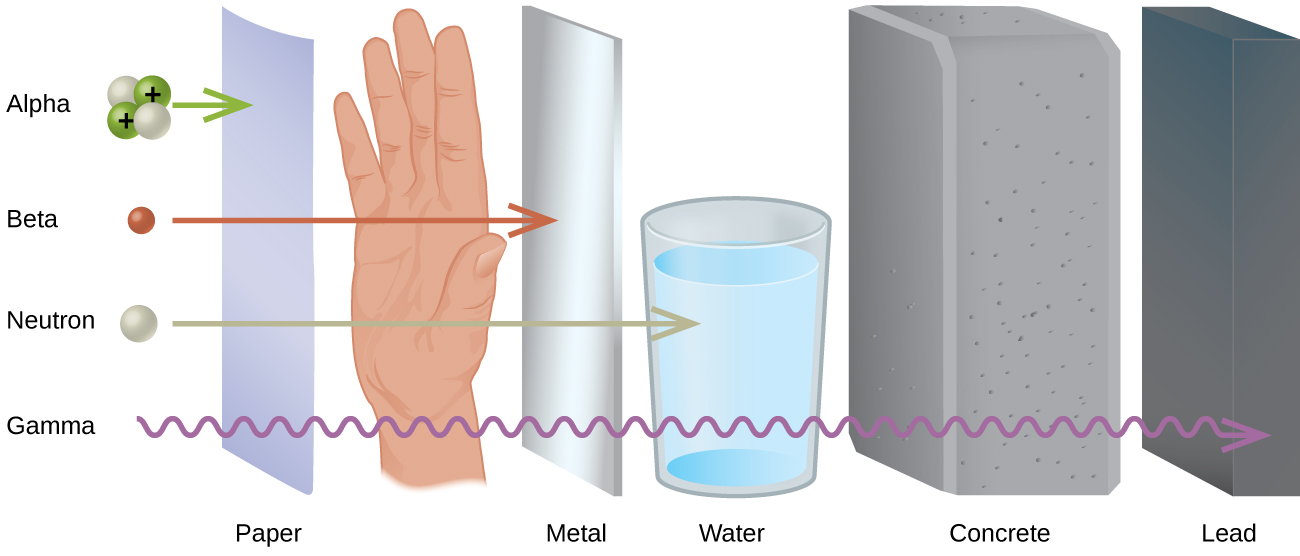
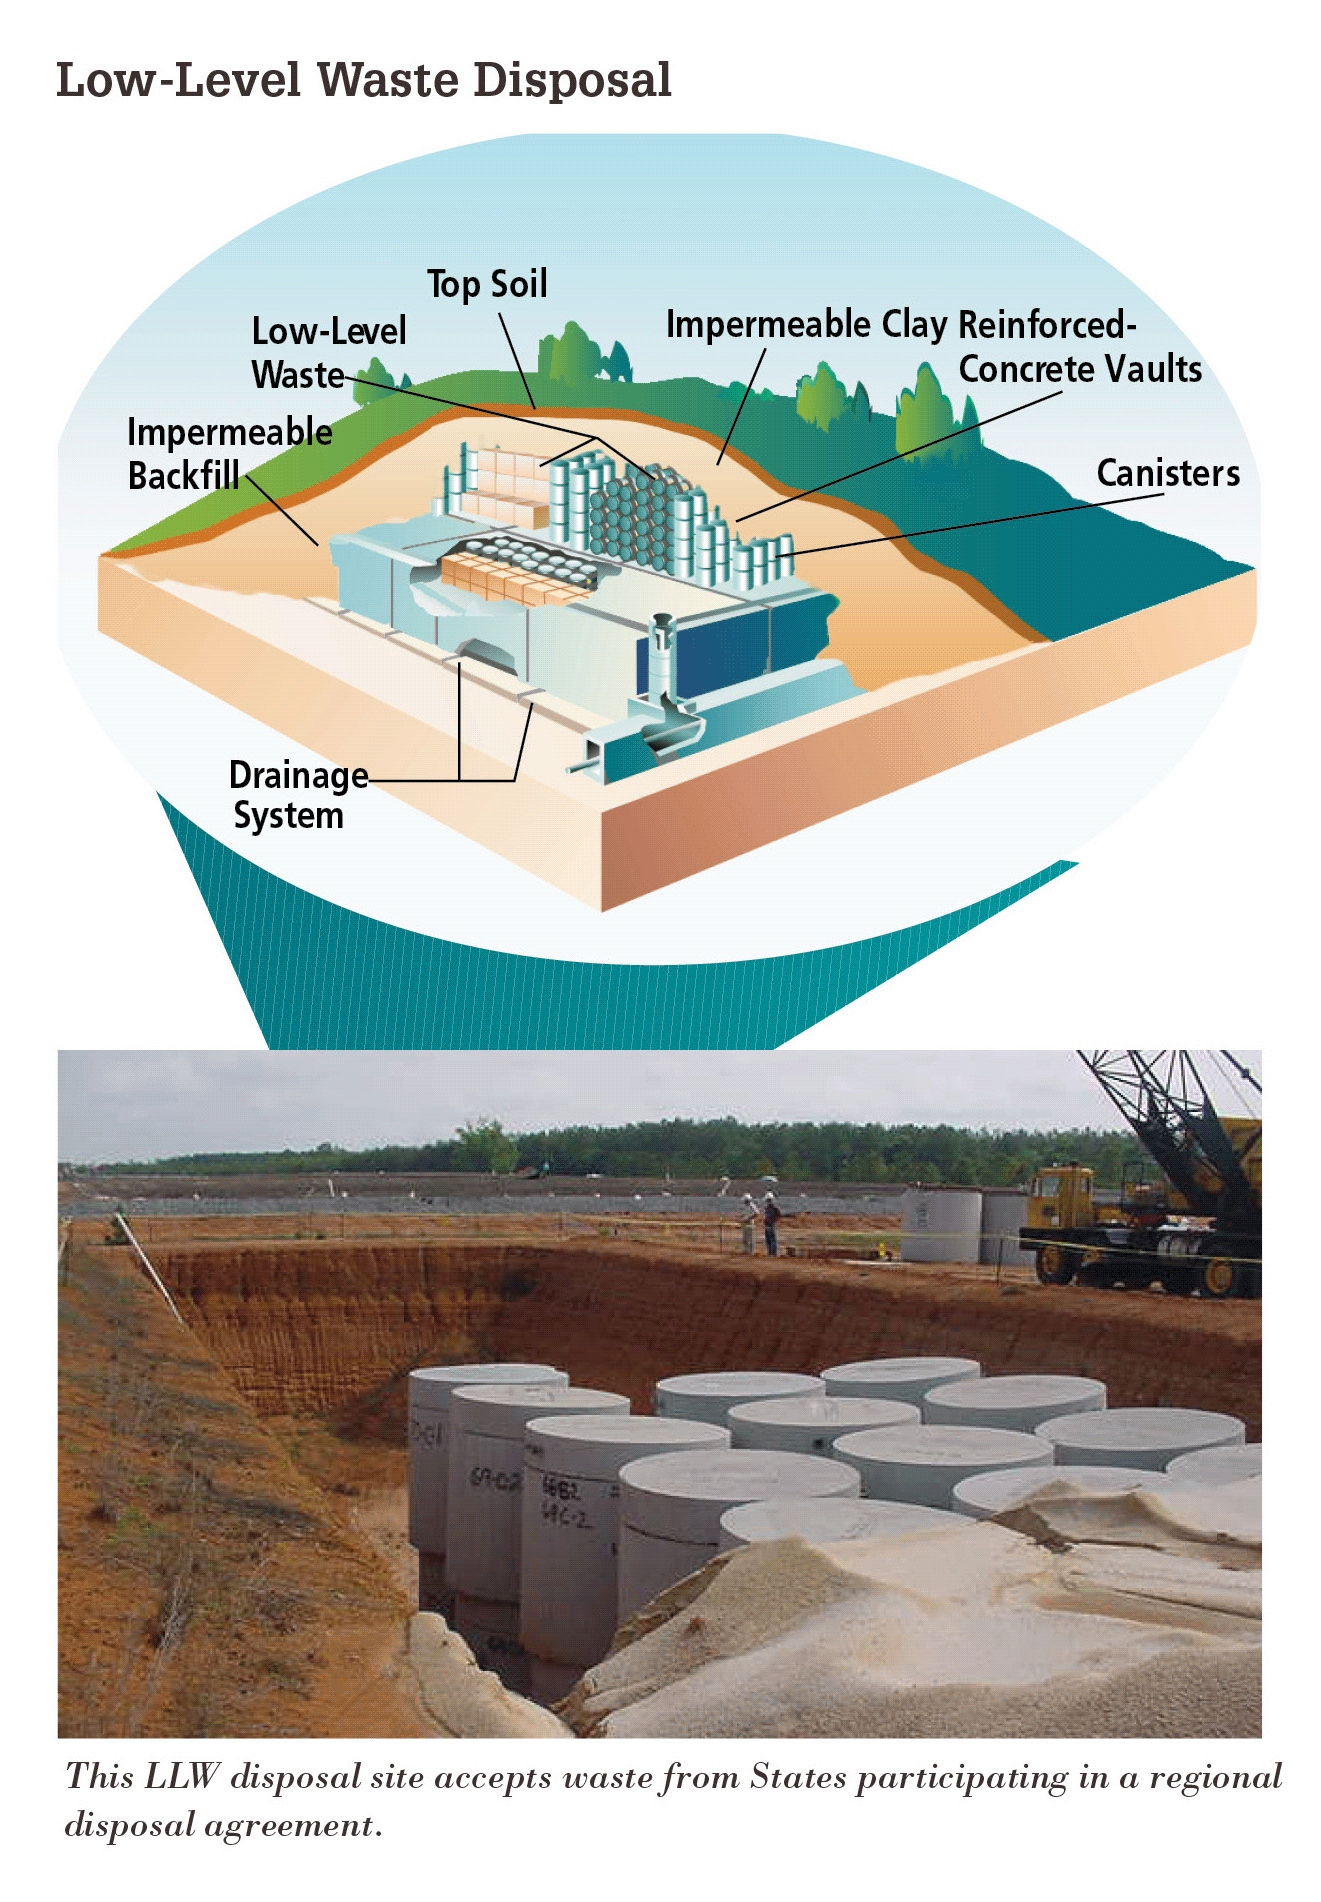
Low-level radioactive waste (LLRW) refers to items that were exposed to radiation includes clothing, filters, and gloves. These can be contained with concrete or lead (through which radiation cannot pass; figure \(\PageIndex{f}\)). Low-level waste is typically stored at the nuclear power plant, either until it has decayed away and can be disposed of as ordinary trash, or until amounts are large enough for shipment to one of the five LLRW disposal sites in the U.S. (figure \(\PageIndex{g}\)).
Enrichment of uranium produces depleted uranium hexafluoride (DUF6), or uranium mill tailings, as a byproduct, which does not have high enough concentrations of 235U to use as nuclear fuel but is still hazardous. Tailings represent the greatest percentage of nuclear waste by volume, and there are more than 200 million tons of radioactive mill-tailings in the United States. Tailings contain several radioactive elements including radium, which decays to produce radon, a radioactive gas. They are stored in impoundments, lined pits in the ground that are flooded with water, in remote areas. Deconversion involves chemically treating the tailings to reduce their hazards so that they can be stored as LLRW.
Nuclear Disasters
There are many other regulatory precautions governing permitting, construction, operation, and decommissioning of nuclear power plants due to risks from an uncontrolled nuclear reaction. The potential for contamination of air, water and food is high should an uncontrolled reaction occur. Even when planning for worst-case scenarios, there are always risks of unexpected events. The nuclear accidents at Three Mile Island, Chernobyl (see the Chapter Hook), and Fukushima raised concerns about the safety of nuclear power.
The Three Mile Island accident occurred in Pennsylvania in 1979. It was a partial meltdown that resulted from an electrical failure and errors in operation. There were no direct deaths. Studies investigated the possibility of exposure to radiation from the accident indirectly causing deaths through increased rates of cancer or other disease, but there has not been evidence of this. In contrast, the 1986 meltdown at Chernobyl Nuclear Power Plant in what is now the Ukraine was responsible for 50 direct deaths. This disaster occurred from a test of the emergency systems gone wrong. Estimates of indirect deaths from radiation exposure range from 4,000 to 60,000.
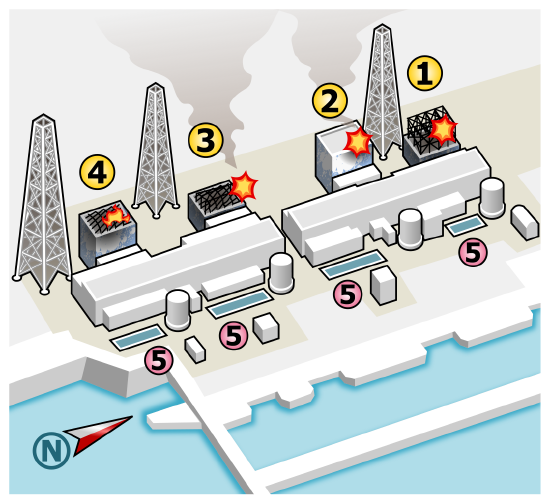
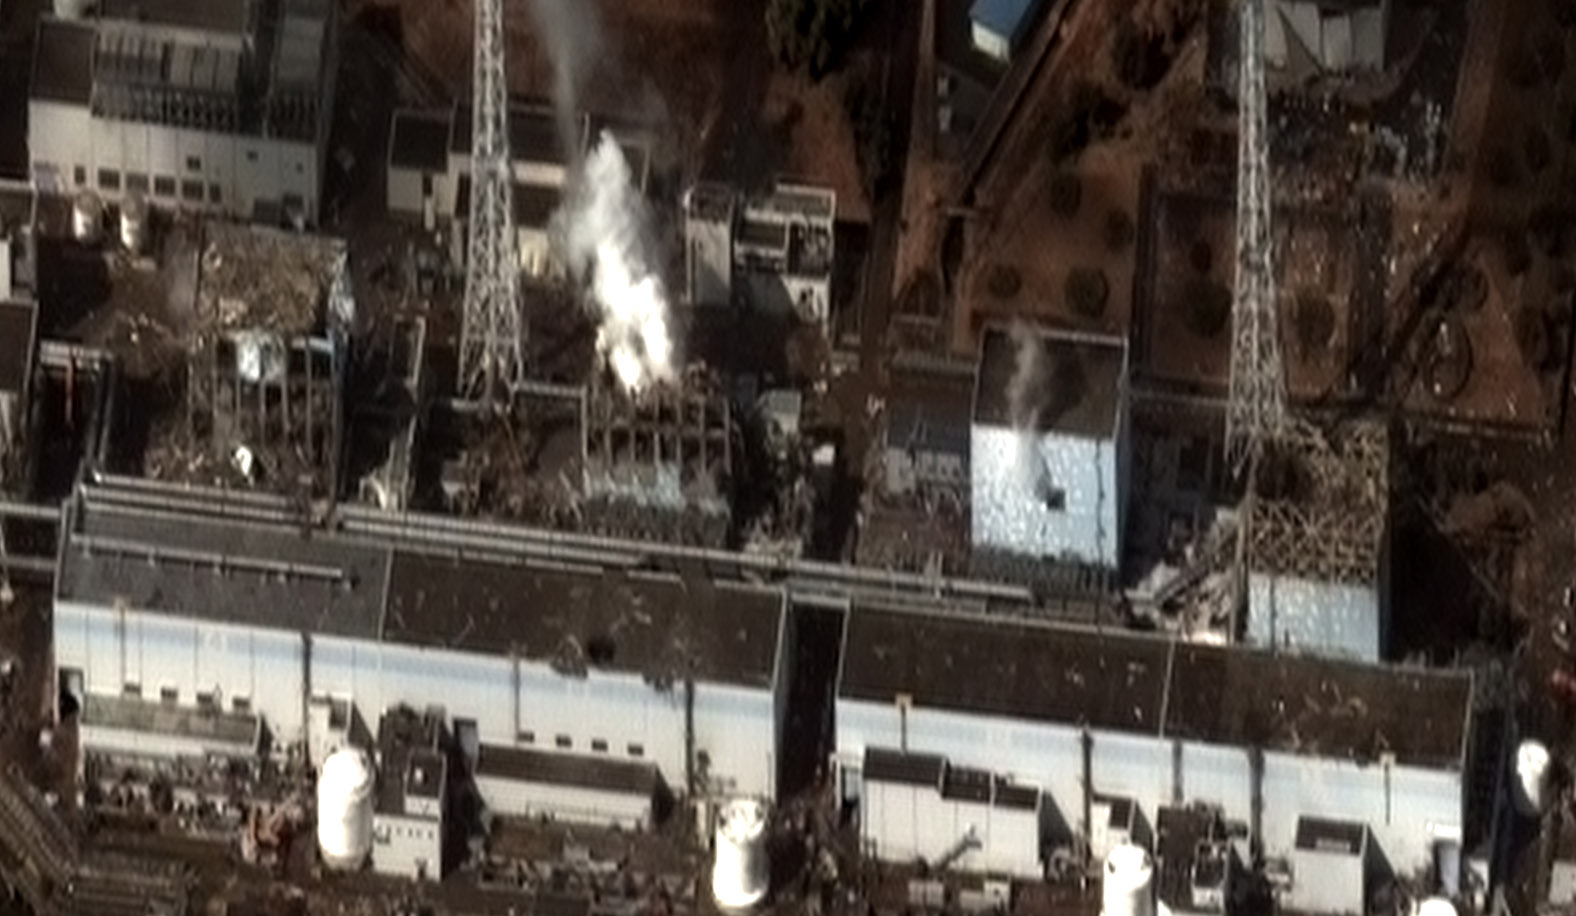
The global discussion regarding nuclear energy has been strongly impacted by March 2011 earthquake and subsequent tsunami that hit Japan resulted in reactor meltdowns at the Fukushima Daiichi Nuclear Power Station causing massive damage to the surrounding area. The disaster disabled the cooling system for a nuclear energy complex, ultimately causing a partial meltdown of some of the reactor cores and release of significant radiation. The design of the reactors (boiling water reactors) made it more difficult to vent the system without releasing radiation. Cooling the radioactive fuel generated a large volume of contaminated water, and the disaster costed at least $300 billion dollars. While there were no immediate deaths, one person later died from cancer attributed to radiation exposure. Thousands died as a result of stress associated with the evacuation, and about 20% of the over 160,000 evacuees had not yet returned home as of 2019.
Interactive Element
This three-minute segment, What Recovery Looks Like In Japan Almost A Decade After Fukushima Nuclear Disaster, provides on update on evacuees from the Fukushima nuclear disaster.
Attribution
Modified by Melissa Ha from the following sources:
- Non-Renewable Energy Sources from Environmental Biology by Matthew R. Fisher (licensed under CC-BY)
- Nuclear Energy, Environmental Challenges in Energy, Carbon Dioxide, Air, Water and Land Use, and Systems of Waste Management from Sustainability: A Comprehensive Foundation by Tom Theis and Jonathan Tomkin, Editors. Textbook content produced by Tom Theis and Jonathan (CC-BY). Download for free at CNX.
- Non-renewable Energy Sources from AP Environmental Science by University of California College Prep (CC-BY). Download for free at CNX.
- Stages of the Nuclear Fuel Cycle and Low-Level Waste. 2020. U.S. NRC. Accessed 01-16-2021 (public domain).
- What is Generation Capacity? 2020. Mike Mueller. Office of Nuclear Energy. U.S. Department of Energy. Accessed 01-16-2021 (public domain)


