
30.6: Genome-wide Association Studies
- Page ID
- 41198
In the 1990s, researchers proposed a methodology called genome-wide association to systematically correlate markers with traits. These studies sample large pools of cases and controls, measure their genotypes at on the order of one million markers, and try to correlate variation (SNPs, CNVs, indels) in their genotypes with their variation in phenotype, tracking disease through the population, instead of pedigrees.
Events Enabling Genome-wide Association Studies
Genome-wide association studies (GWASs) are possible due to three advances.
First, advances in our understanding of the genome and the creation of genomic resources have allowed us to better understand and catalogue variation in the genome. From this data, we have realized the key biological insight that humans are one of the least genetically diverse species. On the order of tens of millions of SNPs are shared between different human subpopulations. For any particular region of the genome, we observe only a limited number of haplotypes (allele combinations which are inherited together). This is due to the fact that as a species, we are relatively new, and mutations have not caught up with our rapid growth. Because of this high redundancy, we only need to measure a fraction of all the variants in the human genome in order to capture them all with LD. We can then adapt the algorithms for inferring inheritance patterns in linkage analysis to impute genotypes for the markers which we did not genotype. Furthermore, genome resources allow us to carefully choose markers to measure and to make predictions based on markers which show statistically significant association. We now have the reference sequence of the human genome (allowing for alignments, genotype and SNP calling) and HapMap, a comprehensive catalog of SNPs in humans. We also have genome-wide annotations of genes and regulatory elements.
Second, advances in genotyping technology such as microarrays and high-throughput sequencing have given us the opportunity to compare the genomes of those affected with various phenotypes to controls. They are also the easiest and cheapest to measure using these technologies. Although there are many types of variation in the human genome (Figure 30.6 shows some examples), SNPs are the vast majority. Additionally, to account for the other types of variants, recently DNA microarrays have been developed to detect copy-number variation in addition to SNPs, after which we can impute the unobserved data.
The third advance is a new expectation of collaboration between researchers. GWASs rely on large sample sizes to increase the power (probability of a true positive) of statistical tests. The explosion in the number of published GWASs has allowed for a new type of meta-analysis which combines the results of several GWASs for the same phenotype to make more powerful associations. Meta-analysis accounts for various technical and population-genetic biases in individual studies. Researchers who conduct GWASs are expected to collaborate with others who have conducted GWASs on the same trait in order to show replicability of results. By pooling together the data, we also have more confidence in the reported associations, and the genes that are discovered may lead to the recognition of key pathways and processes.
Did You Know?
Modified from the Wellcome Trust Sanger Institute: Crohn’s disease and Ulcerative Colitis have been focuses for complex disease genetics, and the massive collaborative efforts of the International Inflammatory Bowel Disease Genetics Consortium (IIBDGC) strengthen the success of the research. With approximately 40,000 DNA samples from patients with IBD and 20,000 healthy controls, the IIBDGC have discovered 99 definite IBD loci. In all, the 71 Crohn’s disease and 47 UC loci account for 23 % and 16% of disease heritability respectively. Key insights into disease biology have already resulted from gene discovery (e.g. autophagy in Crohn’s disease, defective barrier function in UC and IL23 signalling in IBD and immune-mediated disease generally). It is anticipated that of the many novel drug targets identified by gene discovery, a few will ultimately result in improved therapeutics for these devastating conditions. Improved diagnostics, prognostics and therapeutics are all goals, with a view to personalized therapy (the practice of using an individual’s genetic profile as a guide for treatment decisions) in future.
Quality Controls
The main problem in conducting GWASs is eliminating confounding factors, but best practices can be used to support quality data.
First, there is genotyping error, which is common enough to require special treatment regardless of which technology is used. This is a technical quality control, and to account for such errors, we use thresholds on metrics like minor allele frequency and deviation from Hardy–Weinberg equilibrium and throw out SNPs which do not meet the criteria.
Second, systematic genetic differences between human subpopulations require a genetic quality control. There are several methods to account for this population substructure, such as genomic control [7], testing for Mendelian inconsistencies, structured association [30], and principal component analysis [27, 29].
Third, covariates such as environmental and behavioral effects or gender may skew the data. We can account for these by including them in our statistical model.
Testing for Association
After performing the quality controls, the statistical analysis involved in GWAS is fairly straightforward, with the simplest tests being single marker regression or a chi-square test. In fact, association results requiring arcane statistics/complex multi-marker models are often less reliable.
First, we assume the effect of each SNP is independent and additive to make the analysis tractable. For each SNP, we perform a hypothesis test whose null hypothesis is that the observed variation in the genotype at that SNP across the subjects does not correlate with the observed variation in the phenotype across the subjects. Because we perform one test for each SNP, we need to deal with the multiple testing problem. Each test has some probability of giving a false positive result, and as we increase the number of tests, the

Commons license. For more information, see http://ocw.mit.edu/help/faq-fair-use/.
Figure 30.7: Thresholds for GWAS significance at the blue line and red lines for a study by the IBDGC on Crohn’s disease. The blue line represents a p-value of 5e-8 and the red line represents approximately 7.2e-8.
probability of getting a false positive in any of them increases. Essentially, with linkage, p = 0.001 (.05/ 50 chromosomal arms) would be considered potentially significant, but GWAS involves performing O(10e6) tests that are largely independent. Each study would have hundreds of p <0.001 purely by statistical chance, with no real relationship to disease. There are several methods to account for multiple testing such as Bonferroni correction and measures such as the false discovery rate [3] and the irreproducible discovery rate [22]. Typically, genome-wide significance is set at p = 5*10e-8 (= .05/1 million tests), first proposed by Risch and Merikangas (1996) []. In 2008, three groups [] published empirically derivaed estimates based on dense genome-wide maps of common DNA and estimated appropriate dense-map numbers to be in the range of 2.5 to 7.2e-8. These can be visualized in Figure 30.7. Because of these different thresholds, it’s important to look at multiple studies to validate associations, as even with strict quality control there can be artifiacts that can affect one every thousand or ten thousand SNPs and escape notice. Additionally, strict genomewide significance is generally not dramatically exceeded, if it’s reached at all, in a single study.
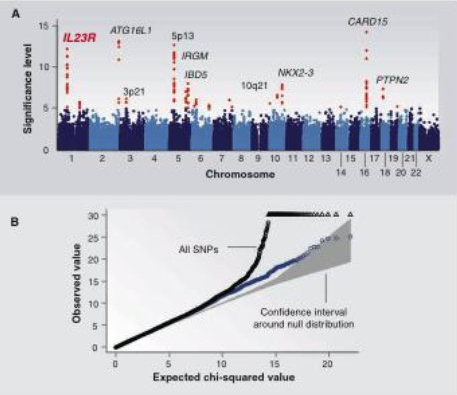
In addition to reporting SNPs which show the strongest associations, we typically also use Manhattan plots to show where these SNPs are located in the genome and quantile-quantile (Q-Q) plots to detect biases which have not been properly accounted for. A Manhattan plot is a scatter plot of log-transformed p-values against genomic position (concatenating the chromosomes). In Figure 30.8A, the points in red are those which meet the significance threshold. They are labeled with candidate genes which are close by. A Q-Q plot is a scatter plot of log-transformed observed p-values against log-transformed expected p-values. We use uniform quantiles as the expected p-values: assuming there is no association, we expect p-values to be uniformly distributed. Deviation from the diagonal suggests p-values are more significant than would be expected. However, early and consistent deviation from the diagonal suggests too many p-values are too significant, i.e. there is some bias which is confounding the test. In Figure 30.8B, the plot shows observed test statistic against expected test statistic (which is equivalent). Considering all markers includes the Major Histocompatability Complex (MHC), which is the region associated with immune response. This region has a unique LD structure which confounds the statistical analysis, as is clear from the deviation of the black points from the diagonal (the gray area). Throwing out the MHC removes much of this bias from the results (the blue points).
GWAS identifies markers which correlate with the trait of interest. However, each marker captures a neighborhood of SNPs which it is in LD with, making the problem of identifying the causal variant harder. Typically, the candidate gene for a marker is the one which is closest to it. From here, we have to do further study to identify the relevance of the variants which we identify. However, this remains a challenging problem for a few reasons:
- Regions of interest identified by association often implicate multiple genes
- Some of these associations are nowhere near any protein coding segments and do no thave an obviously functional allele as their origin
- Linking these regions to underlying biological pathways is difficult
Interpretation: How can GWAS inform the biology of disease?
Our primary goal is to use these found associations to understand the biology of disease in an actionable manner, as this will help guide therapies in order to treat these diseases. Most associations do not identify specific genes and causal mutations, but rather are just pointers to small regions with causal influences on disease. In order to develop and act on a therapeutic hypothesis, we must go much further, and answer these questions:
- Which gene is connected to disease?
- What biological process is thereby implicated?
- What is the cellular context in which that process acts and is relevant to disease?
- What are the specific functional alleles which perturb the process and promote or protect from disease?
This can be approached in one of two manners: the bottom-up approach, or the top-down approach.
Bottom-up
The bottom-up approach is used to investigate a particular gene that has a known association with a disease, and investigate it’s biological importance within a cell. Kuballa et al.[19] were able to use this bottom-up approach to learn that a particular risk variant associated with Crohn’s Disease leads to impairment of

autophagy of certain pathogens. Furthermore, the authors were able to create a mouse model of the same risk variant found in humans. Identifying biological implications of risk variants at the cellular level and creating these models is invaluable as the models can be directly used to test new potential treatment compounds.
Top-down
In contrast, the top-down approach involves looking at all known associations, utilizing the complete set of GWAS results, and trying to link them to shared biological processes/pathways implicated in disease pathogenesis. This approach is based on the idea that many of the associated genes with a disease share relevant biological pathways. This is commonly done by taking existing networks like protein-protein interaction networks, and layering the associated genes on top of them. However, these resulting disease networks may not be significant due to bias in both the discovery of associations and the experimental bias of the data that the associations are being integrated with. This significance can be estimated by permuting the labels for the nodes in the network many times, and then computing how rare the level of connectivity is for the given disease network. This process is illustrated in Figure 30.9. As genes connected in the network should be co-expressed, it has been shown that these disease networks can be further validated from gene-expression profiling[14].
Comparison with Linkage Analysis
It is important to note GWAS captures more variants than linkage analysis. Linkage analysis identifies rare variants which have negative effects, and linkage studies are used when pedigrees of related individuals with phenotypic information is available. They can identify rare alleles that are present in smaller numbers of families, usually due to a founder mutatios and have been used to identify mutations such as BRCA1, associated with breast cancer. Alternatively, association studies are used for this purpose and also to find more common genetic changes that confer smaller influences in susceptibility, such as rare variants which have protective effects. Linkage analysis cannot identify these variants because they are anti-correlated with disease status. Furthermore, linkage analysis relies on the assumption that a single variant explains the disease, an assumption that does not hold for complex traits such as disease. Instead, we need to consider many markers in order to explain the genetic basis of these traits.
While genomic medicine promises novel discoveries in disease mechanisms, target genes, therapeutics, and personalized medicine, several challenges remain, including that 90+% of hits are non-coding.
To fix this, the non-coding genome has been annotated through ENCODE/Roadmap and enhancers have been linked to regulators and target genes. Once each GWAS locus is expanded using SNP linkage desiquilibrium (LD) it can be used to recognize relevant cell types, driver transcription factors, and target genes. These leads to a linking of traits to their relevant cell and tissue types.
Conclusions
We have learned several lessons from GWAS. First, fewer than one-third of reported associations are coding or obviously functional variants. Second, only some fraction of associated non-coding variants are significantly associated to expression level of a nearby gene. Third, many are associated to regions with no nearby coding gene. Finally, the majority of reported variants are associated to multiple autoimmune or inflammatory diseases. These revelations indicate that there are still many mysteries lurking in the genome waiting to be discovered.