
12: Electrophoretic Mobility Shift Assay
- Page ID
- 172064
\( \newcommand{\vecs}[1]{\overset { \scriptstyle \rightharpoonup} {\mathbf{#1}} } \)
\( \newcommand{\vecd}[1]{\overset{-\!-\!\rightharpoonup}{\vphantom{a}\smash {#1}}} \)
\( \newcommand{\dsum}{\displaystyle\sum\limits} \)
\( \newcommand{\dint}{\displaystyle\int\limits} \)
\( \newcommand{\dlim}{\displaystyle\lim\limits} \)
\( \newcommand{\id}{\mathrm{id}}\) \( \newcommand{\Span}{\mathrm{span}}\)
( \newcommand{\kernel}{\mathrm{null}\,}\) \( \newcommand{\range}{\mathrm{range}\,}\)
\( \newcommand{\RealPart}{\mathrm{Re}}\) \( \newcommand{\ImaginaryPart}{\mathrm{Im}}\)
\( \newcommand{\Argument}{\mathrm{Arg}}\) \( \newcommand{\norm}[1]{\| #1 \|}\)
\( \newcommand{\inner}[2]{\langle #1, #2 \rangle}\)
\( \newcommand{\Span}{\mathrm{span}}\)
\( \newcommand{\id}{\mathrm{id}}\)
\( \newcommand{\Span}{\mathrm{span}}\)
\( \newcommand{\kernel}{\mathrm{null}\,}\)
\( \newcommand{\range}{\mathrm{range}\,}\)
\( \newcommand{\RealPart}{\mathrm{Re}}\)
\( \newcommand{\ImaginaryPart}{\mathrm{Im}}\)
\( \newcommand{\Argument}{\mathrm{Arg}}\)
\( \newcommand{\norm}[1]{\| #1 \|}\)
\( \newcommand{\inner}[2]{\langle #1, #2 \rangle}\)
\( \newcommand{\Span}{\mathrm{span}}\) \( \newcommand{\AA}{\unicode[.8,0]{x212B}}\)
\( \newcommand{\vectorA}[1]{\vec{#1}} % arrow\)
\( \newcommand{\vectorAt}[1]{\vec{\text{#1}}} % arrow\)
\( \newcommand{\vectorB}[1]{\overset { \scriptstyle \rightharpoonup} {\mathbf{#1}} } \)
\( \newcommand{\vectorC}[1]{\textbf{#1}} \)
\( \newcommand{\vectorD}[1]{\overrightarrow{#1}} \)
\( \newcommand{\vectorDt}[1]{\overrightarrow{\text{#1}}} \)
\( \newcommand{\vectE}[1]{\overset{-\!-\!\rightharpoonup}{\vphantom{a}\smash{\mathbf {#1}}}} \)
\( \newcommand{\vecs}[1]{\overset { \scriptstyle \rightharpoonup} {\mathbf{#1}} } \)
\(\newcommand{\longvect}{\overrightarrow}\)
\( \newcommand{\vecd}[1]{\overset{-\!-\!\rightharpoonup}{\vphantom{a}\smash {#1}}} \)
\(\newcommand{\avec}{\mathbf a}\) \(\newcommand{\bvec}{\mathbf b}\) \(\newcommand{\cvec}{\mathbf c}\) \(\newcommand{\dvec}{\mathbf d}\) \(\newcommand{\dtil}{\widetilde{\mathbf d}}\) \(\newcommand{\evec}{\mathbf e}\) \(\newcommand{\fvec}{\mathbf f}\) \(\newcommand{\nvec}{\mathbf n}\) \(\newcommand{\pvec}{\mathbf p}\) \(\newcommand{\qvec}{\mathbf q}\) \(\newcommand{\svec}{\mathbf s}\) \(\newcommand{\tvec}{\mathbf t}\) \(\newcommand{\uvec}{\mathbf u}\) \(\newcommand{\vvec}{\mathbf v}\) \(\newcommand{\wvec}{\mathbf w}\) \(\newcommand{\xvec}{\mathbf x}\) \(\newcommand{\yvec}{\mathbf y}\) \(\newcommand{\zvec}{\mathbf z}\) \(\newcommand{\rvec}{\mathbf r}\) \(\newcommand{\mvec}{\mathbf m}\) \(\newcommand{\zerovec}{\mathbf 0}\) \(\newcommand{\onevec}{\mathbf 1}\) \(\newcommand{\real}{\mathbb R}\) \(\newcommand{\twovec}[2]{\left[\begin{array}{r}#1 \\ #2 \end{array}\right]}\) \(\newcommand{\ctwovec}[2]{\left[\begin{array}{c}#1 \\ #2 \end{array}\right]}\) \(\newcommand{\threevec}[3]{\left[\begin{array}{r}#1 \\ #2 \\ #3 \end{array}\right]}\) \(\newcommand{\cthreevec}[3]{\left[\begin{array}{c}#1 \\ #2 \\ #3 \end{array}\right]}\) \(\newcommand{\fourvec}[4]{\left[\begin{array}{r}#1 \\ #2 \\ #3 \\ #4 \end{array}\right]}\) \(\newcommand{\cfourvec}[4]{\left[\begin{array}{c}#1 \\ #2 \\ #3 \\ #4 \end{array}\right]}\) \(\newcommand{\fivevec}[5]{\left[\begin{array}{r}#1 \\ #2 \\ #3 \\ #4 \\ #5 \\ \end{array}\right]}\) \(\newcommand{\cfivevec}[5]{\left[\begin{array}{c}#1 \\ #2 \\ #3 \\ #4 \\ #5 \\ \end{array}\right]}\) \(\newcommand{\mattwo}[4]{\left[\begin{array}{rr}#1 \amp #2 \\ #3 \amp #4 \\ \end{array}\right]}\) \(\newcommand{\laspan}[1]{\text{Span}\{#1\}}\) \(\newcommand{\bcal}{\cal B}\) \(\newcommand{\ccal}{\cal C}\) \(\newcommand{\scal}{\cal S}\) \(\newcommand{\wcal}{\cal W}\) \(\newcommand{\ecal}{\cal E}\) \(\newcommand{\coords}[2]{\left\{#1\right\}_{#2}}\) \(\newcommand{\gray}[1]{\color{gray}{#1}}\) \(\newcommand{\lgray}[1]{\color{lightgray}{#1}}\) \(\newcommand{\rank}{\operatorname{rank}}\) \(\newcommand{\row}{\text{Row}}\) \(\newcommand{\col}{\text{Col}}\) \(\renewcommand{\row}{\text{Row}}\) \(\newcommand{\nul}{\text{Nul}}\) \(\newcommand{\var}{\text{Var}}\) \(\newcommand{\corr}{\text{corr}}\) \(\newcommand{\len}[1]{\left|#1\right|}\) \(\newcommand{\bbar}{\overline{\bvec}}\) \(\newcommand{\bhat}{\widehat{\bvec}}\) \(\newcommand{\bperp}{\bvec^\perp}\) \(\newcommand{\xhat}{\widehat{\xvec}}\) \(\newcommand{\vhat}{\widehat{\vvec}}\) \(\newcommand{\uhat}{\widehat{\uvec}}\) \(\newcommand{\what}{\widehat{\wvec}}\) \(\newcommand{\Sighat}{\widehat{\Sigma}}\) \(\newcommand{\lt}{<}\) \(\newcommand{\gt}{>}\) \(\newcommand{\amp}{&}\) \(\definecolor{fillinmathshade}{gray}{0.9}\)An Electrophoretic Mobility Shift Assay is a technique used to study protein-nucleic acid interactions in vitro.
Also known as:
EMSA
Gel shift
Samples needed
To perform an EMSA, you need:
-
A protein sample, which can be either purified protein or a mixture isolated from cells or tissue.
-
A DNA probe labeled with either a fluorescent or radioactive tag. An EMSA can also be performed with an RNA probe if you’re interested in RNA-protein interactions.
Method
To perform an EMSA, a short DNA fragment is labeled with a fluorescent or radioactive tag to make it detectable. This labeled DNA is then mixed with a protein extract or purified proteins, allowing the proteins to bind to the DNA. The mixture is loaded onto a non-denaturing agarose or polyacrylamide gel and subjected to electrophoresis. During this process, the DNA-protein complexes migrate more slowly through the gel compared to free DNA fragments, resulting in a "shift" in the position of the bands. After electrophoresis, the gel is visualized using autoradiography or fluorescence to detect the shifted bands, which indicate the presence of DNA-protein complexes.
Controls
Validation of the binding reaction can be carried out in several ways. First, an antibody to the protein being tested can be included in one of the binding reactions. The binding of the antibody to the protein-DNA complex results in a larger complex that migrates even more slowly than the protein-DNA complex (this is often referred to as a ‘supershift.’ Second, non-labeled competitor DNA can be included in the binding reaction in molar excess over the labeled probe DNA. The competitor DNA will outcompete the binding of the protein to the labeled DNA, resulting in a less intense protein-DNA band shifted band.
Interpretation
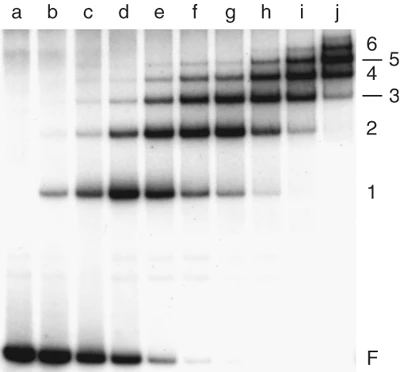
This figure shows that as the concentration of the lac repressor protein in a binding reaction increases, more proteins bind to the lac promoter sequence on the DNA probe. This results in increasing numbers of higher molecular weight protein-nucleic acid complexes that migrate more slowly during gel electrophoresis. The intensity of the band corresponding to the free probe (not bound to any protein) decreases with increasing protein concentration (moving left to right on the gel). With extremely high protein concentrations, the protein starts to bind to DNA sequences that are not the lac promoter, even though these protein-DNA interactions have lower affinity.
Image Descriptions
Figure 1 image description:
An EMSA assay. There are ten gel lanes, showing protein-DNA complexes that form when the lac operon promoter DNA is incubated with increasing concentrations of the lac operon repressor. Larger complexes migrate slower through the gel than smaller complexes.
|
Lane |
Concentration of repressor protein (X10-8 M) |
Intensity of free probe band |
Repressor : DNA ratio of bound probe complexes present |
Repressor : DNA ratio of bound probe in main complex present |
|---|---|---|---|---|
|
a |
0 |
Very strong |
0 |
0 |
|
b |
0.08 |
Strong |
1,2,3 |
1 |
|
c |
0.16 |
Medium |
1,2,3,4,5 |
1 |
|
d |
0.32 |
Medium |
1,2,3,4,5 |
1 |
|
e |
0.45 |
Weak |
1,2,3,4,5 |
1 |
|
f |
0.61 |
Very weak |
1,2,3,4,5 |
2 |
|
g |
0.83 |
None |
1,2,3,4,5 |
2 |
|
h |
0.99 |
None |
1,2,3,4,5,6 |
3 |
|
i |
1.32 |
None |
2,3,4,5,6 |
4 |
|
j |
1.66 |
None |
3,4,5,6,7 |
5 |
Thumbnail
"EMSA schematic"↗ by Linsalrob↗ is licensed under CC BY-SA 4.0↗.
Author
Mitch McVey, Tufts University
1. Hellman, L. M. and M. G. Fried. 2007. Electrophoretic mobility shift assay (EMSA) for detecting protein-nucleic acid interactions. Nature Protocols 2:1849-1861. ↵