
2.2: Measuring Species Diversity
- Page ID
- 36168

\( \newcommand{\vecs}[1]{\overset { \scriptstyle \rightharpoonup} {\mathbf{#1}} } \)
\( \newcommand{\vecd}[1]{\overset{-\!-\!\rightharpoonup}{\vphantom{a}\smash {#1}}} \)
\( \newcommand{\dsum}{\displaystyle\sum\limits} \)
\( \newcommand{\dint}{\displaystyle\int\limits} \)
\( \newcommand{\dlim}{\displaystyle\lim\limits} \)
\( \newcommand{\id}{\mathrm{id}}\) \( \newcommand{\Span}{\mathrm{span}}\)
( \newcommand{\kernel}{\mathrm{null}\,}\) \( \newcommand{\range}{\mathrm{range}\,}\)
\( \newcommand{\RealPart}{\mathrm{Re}}\) \( \newcommand{\ImaginaryPart}{\mathrm{Im}}\)
\( \newcommand{\Argument}{\mathrm{Arg}}\) \( \newcommand{\norm}[1]{\| #1 \|}\)
\( \newcommand{\inner}[2]{\langle #1, #2 \rangle}\)
\( \newcommand{\Span}{\mathrm{span}}\)
\( \newcommand{\id}{\mathrm{id}}\)
\( \newcommand{\Span}{\mathrm{span}}\)
\( \newcommand{\kernel}{\mathrm{null}\,}\)
\( \newcommand{\range}{\mathrm{range}\,}\)
\( \newcommand{\RealPart}{\mathrm{Re}}\)
\( \newcommand{\ImaginaryPart}{\mathrm{Im}}\)
\( \newcommand{\Argument}{\mathrm{Arg}}\)
\( \newcommand{\norm}[1]{\| #1 \|}\)
\( \newcommand{\inner}[2]{\langle #1, #2 \rangle}\)
\( \newcommand{\Span}{\mathrm{span}}\) \( \newcommand{\AA}{\unicode[.8,0]{x212B}}\)
\( \newcommand{\vectorA}[1]{\vec{#1}} % arrow\)
\( \newcommand{\vectorAt}[1]{\vec{\text{#1}}} % arrow\)
\( \newcommand{\vectorB}[1]{\overset { \scriptstyle \rightharpoonup} {\mathbf{#1}} } \)
\( \newcommand{\vectorC}[1]{\textbf{#1}} \)
\( \newcommand{\vectorD}[1]{\overrightarrow{#1}} \)
\( \newcommand{\vectorDt}[1]{\overrightarrow{\text{#1}}} \)
\( \newcommand{\vectE}[1]{\overset{-\!-\!\rightharpoonup}{\vphantom{a}\smash{\mathbf {#1}}}} \)
\( \newcommand{\vecs}[1]{\overset { \scriptstyle \rightharpoonup} {\mathbf{#1}} } \)
\(\newcommand{\longvect}{\overrightarrow}\)
\( \newcommand{\vecd}[1]{\overset{-\!-\!\rightharpoonup}{\vphantom{a}\smash {#1}}} \)
\(\newcommand{\avec}{\mathbf a}\) \(\newcommand{\bvec}{\mathbf b}\) \(\newcommand{\cvec}{\mathbf c}\) \(\newcommand{\dvec}{\mathbf d}\) \(\newcommand{\dtil}{\widetilde{\mathbf d}}\) \(\newcommand{\evec}{\mathbf e}\) \(\newcommand{\fvec}{\mathbf f}\) \(\newcommand{\nvec}{\mathbf n}\) \(\newcommand{\pvec}{\mathbf p}\) \(\newcommand{\qvec}{\mathbf q}\) \(\newcommand{\svec}{\mathbf s}\) \(\newcommand{\tvec}{\mathbf t}\) \(\newcommand{\uvec}{\mathbf u}\) \(\newcommand{\vvec}{\mathbf v}\) \(\newcommand{\wvec}{\mathbf w}\) \(\newcommand{\xvec}{\mathbf x}\) \(\newcommand{\yvec}{\mathbf y}\) \(\newcommand{\zvec}{\mathbf z}\) \(\newcommand{\rvec}{\mathbf r}\) \(\newcommand{\mvec}{\mathbf m}\) \(\newcommand{\zerovec}{\mathbf 0}\) \(\newcommand{\onevec}{\mathbf 1}\) \(\newcommand{\real}{\mathbb R}\) \(\newcommand{\twovec}[2]{\left[\begin{array}{r}#1 \\ #2 \end{array}\right]}\) \(\newcommand{\ctwovec}[2]{\left[\begin{array}{c}#1 \\ #2 \end{array}\right]}\) \(\newcommand{\threevec}[3]{\left[\begin{array}{r}#1 \\ #2 \\ #3 \end{array}\right]}\) \(\newcommand{\cthreevec}[3]{\left[\begin{array}{c}#1 \\ #2 \\ #3 \end{array}\right]}\) \(\newcommand{\fourvec}[4]{\left[\begin{array}{r}#1 \\ #2 \\ #3 \\ #4 \end{array}\right]}\) \(\newcommand{\cfourvec}[4]{\left[\begin{array}{c}#1 \\ #2 \\ #3 \\ #4 \end{array}\right]}\) \(\newcommand{\fivevec}[5]{\left[\begin{array}{r}#1 \\ #2 \\ #3 \\ #4 \\ #5 \\ \end{array}\right]}\) \(\newcommand{\cfivevec}[5]{\left[\begin{array}{c}#1 \\ #2 \\ #3 \\ #4 \\ #5 \\ \end{array}\right]}\) \(\newcommand{\mattwo}[4]{\left[\begin{array}{rr}#1 \amp #2 \\ #3 \amp #4 \\ \end{array}\right]}\) \(\newcommand{\laspan}[1]{\text{Span}\{#1\}}\) \(\newcommand{\bcal}{\cal B}\) \(\newcommand{\ccal}{\cal C}\) \(\newcommand{\scal}{\cal S}\) \(\newcommand{\wcal}{\cal W}\) \(\newcommand{\ecal}{\cal E}\) \(\newcommand{\coords}[2]{\left\{#1\right\}_{#2}}\) \(\newcommand{\gray}[1]{\color{gray}{#1}}\) \(\newcommand{\lgray}[1]{\color{lightgray}{#1}}\) \(\newcommand{\rank}{\operatorname{rank}}\) \(\newcommand{\row}{\text{Row}}\) \(\newcommand{\col}{\text{Col}}\) \(\renewcommand{\row}{\text{Row}}\) \(\newcommand{\nul}{\text{Nul}}\) \(\newcommand{\var}{\text{Var}}\) \(\newcommand{\corr}{\text{corr}}\) \(\newcommand{\len}[1]{\left|#1\right|}\) \(\newcommand{\bbar}{\overline{\bvec}}\) \(\newcommand{\bhat}{\widehat{\bvec}}\) \(\newcommand{\bperp}{\bvec^\perp}\) \(\newcommand{\xhat}{\widehat{\xvec}}\) \(\newcommand{\vhat}{\widehat{\vvec}}\) \(\newcommand{\uhat}{\widehat{\uvec}}\) \(\newcommand{\what}{\widehat{\wvec}}\) \(\newcommand{\Sighat}{\widehat{\Sigma}}\) \(\newcommand{\lt}{<}\) \(\newcommand{\gt}{>}\) \(\newcommand{\amp}{&}\) \(\definecolor{fillinmathshade}{gray}{0.9}\)How do we measure species diversity within a habitat? How do we compare diversity across different types of habitats containing very different numbers and types of organisms? There are many mathematical models that have been developed to quantify species diversity in different habitats. While these models differ in the exact method of diversity estimation, they all include two important components: species richness and species evenness.
Species richness is a measure of the number of different types of species in an ecosystem. A large number of different species in a habitat represents a higher species richness, and an overall more diverse ecosystem. Species evenness is a measure of the relative abundance of each species. More evenly represented species (evidenced by similar population sizes) illustrate a higher species evenness and an overall more diverse ecosystem.
Mathematically, we can distill species richness and species evenness of a habitat into a single measure of overall diversity using the following equation
\[D = (p_1^{-p1}) (p_2^{-p2}) (p_3^{-p3})…(p_n^{-n}) \]
where D is a measure of the total diversity of the ecosystem, and pn is the proportion of species n. You will practice calculating D values and comparing diversity for different ecosystems in Lab 1: Discovering Diversity.
Exercise \(\PageIndex{1}\)
For the following exercise, consider the four insect communities shown below.

To determine the diversity value for a given habitat, we must first calculate the number and proportion of species in the habitat and then enter those numbers into the equation provided above.
Habitat A: Habitat A has two species, blue insects and red insects. There are 10 total insects in this habitat, 1 of which is blue and 9 of which are red. Consequently, the proportion of blue insects is 1/10 or 0.1 and the proportion of red insects is 9/10 or 0.9. The D value for Habitat A is then
D = (0.1-0.1)(0.9-0.9) = 1.384
Calculate the diversity values for each of the other habitats to determine which habitat has the highest diversity.
- Answer
-
Habitat B: D = (0.1-0.1) (0.1-0.1) (0.1-0.1) (0.3-0.3) (0.4-0.4) = 4.13
Habitat C: D = (0.5-0.5) (0.5-0.5) = 2
Habitat D: D = (0.2-0.2) (0.2-0.2) (0.2-0.2) (0.2-0.2) (0.2-0.2) = 5
Habitat D has the highest diversity
The methodology above is easy to use with small ecosystems that contain a small number of individuals and only a few species. Real ecosystems, however, are very large and can contain hundreds or thousands of species and tens of thousands of individual organisms. In such cases, it is not possible to count every single individual and determine the exact proportion of each species in the entire ecosystem. Instead, we need a method to determine how much sampling is required in order to estimate species diversity with a reasonable degree of accuracy. In this section, we will consider two such methods: species-area curves and rarefaction curves.
Species-area curves show the relationship between the area sampled in an ecosystem (on the x axis) and the number of species found in that area (on the y axis). Figure 1 illustrates how a species-area curve is developed. In the figure, the top box represents the ecosystem being studied, with letters representing individuals of different species. Suppose the researcher begins in the top left corner of the habitat and counts the number of individuals in the 1-meter square box shaded red. There are two individuals, both of Species A, in this area. As the researcher expands the area sampled (into the orange, then yellow, then green, etc areas) the number of individuals counted increases, as does the number of species identified. A summary table of the total area sampled and number of species identified is provided next to the map. In this particular sampling method, the area sampled doubles at each step: the red box is 1 m2, sampling the orange box brings the total area 2 m2, the yellow box to 4 m2, the green box to 8 m2 and so on. The number of species identified in the habitat follows a slightly different pattern. Initially, the number of species found increases rapidly, however, few new species are found as the area increases, to the point that the line in the graph begins to taper off after about 16 m2. The resulting species-area curve suggests that the researcher has likely already found all (or at least the vast majority of) species present in this ecosystem and that additional sampling would not discover more species.

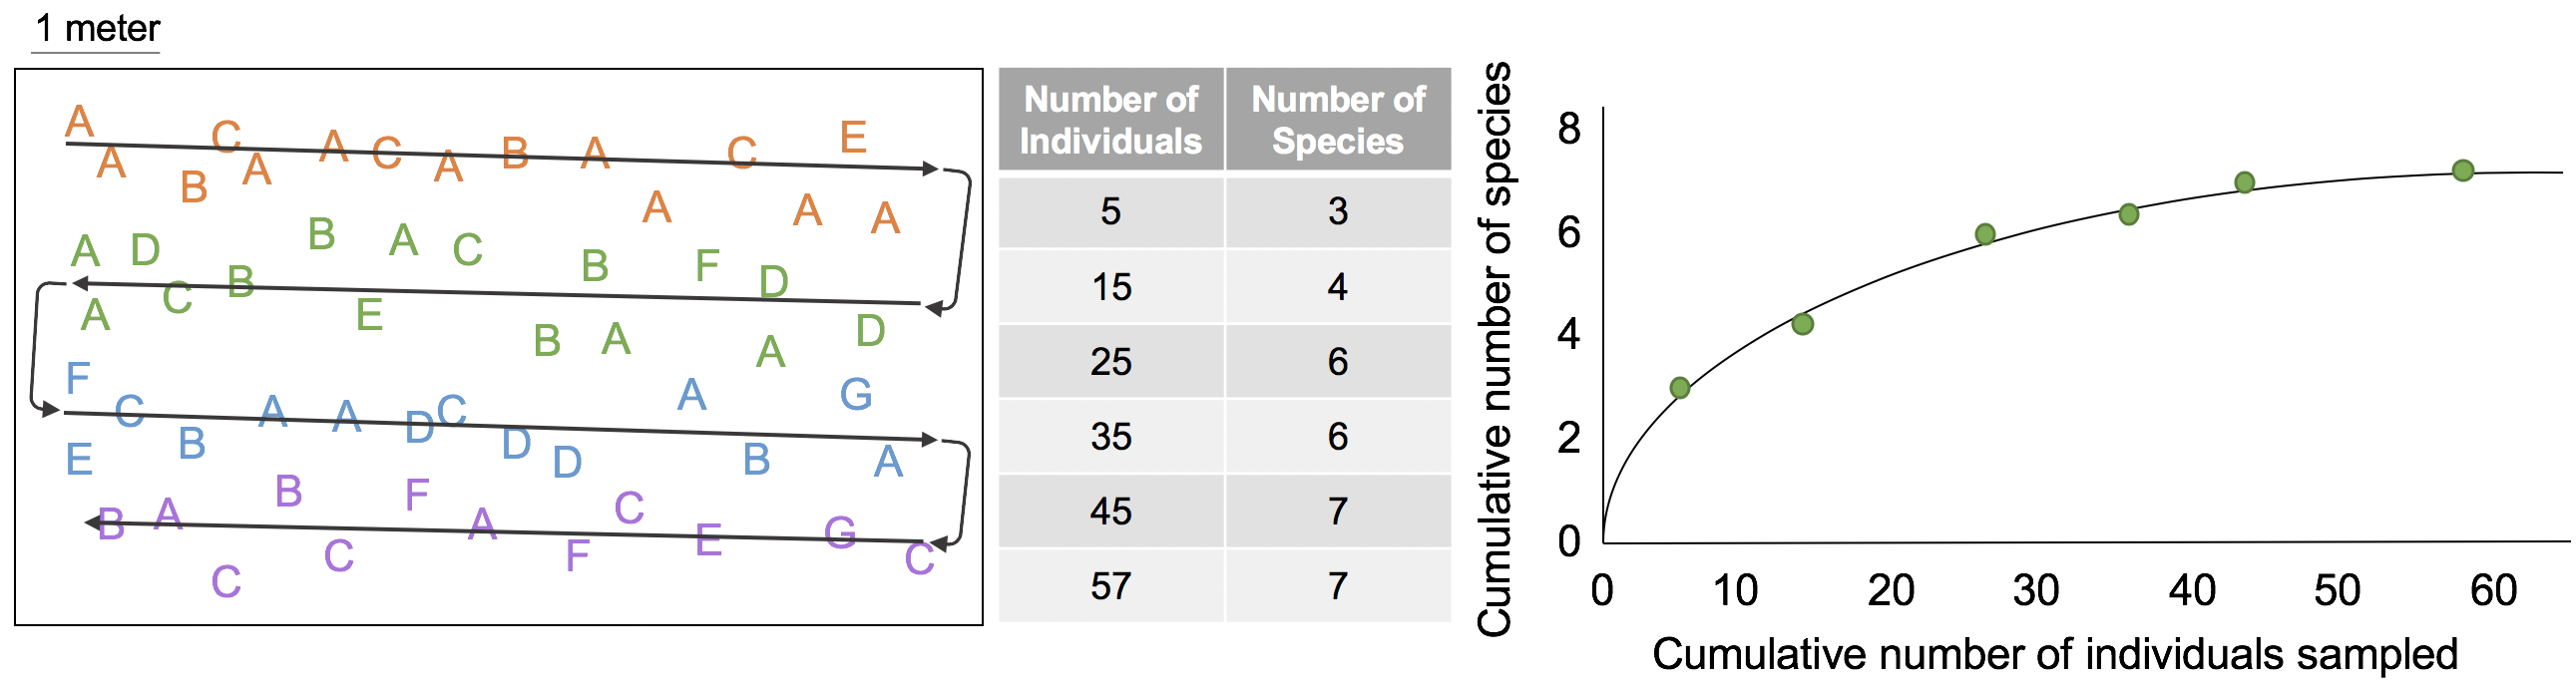
A similar method for estimating ecosystem diversity is a rarefaction curve, which is similar to a species-area curve, but focuses on the number of individuals sampled as opposed to the area. Figure 2.2.3 illustrates how a rarefaction curve is developed. Suppose another researcher samples the same area shown in Figure 2 and also begins in the top left corner, following the sampling path represented by the gray arrows. The researcher works their way through the ecosystem noting each individual organism and whether or not it represents a species already found in the ecosystem. A summary table of the number of individuals and species counted is provided next to the map. The number of individuals counted progresses rapidly, while the number of species identified tapers off after about 45 individuals sampled. The resulting rarefaction curve suggests that the researcher has likely already found all (or at least the vast majority of) species present in this ecosystem and that additional sampling would not discover more species.
The species-area curve and rarefaction curves look quite similar, and indeed they should, since the primary difference in the two methodologies is how we define sampling ‘effort’ on the x axis – through area surveyed (species-area curve) or through number of individuals counted (rarefaction curve). In both cases, the researcher sampled the entire area shown in the map, which should result in a similar estimate of species diversity for the ecosystem. Which sampling method is used depends on the characteristics of the ecosystem and species to be sampled. You will practice sampling the diversity of an ecosystem and developing a rarefaction curve of your data in Lab 1: Discovering Diversity.
Earth's Biodiversity
How many species exist on Earth? This is a question that scientists have attempted to answer for centuries, beginning with Carl Linnaeus’ first steps towards naming and classifying organisms in Systema Naturae in 1735. Linneaus himself described over 12,000 species and in the nearly 300 years since, scientists have formally described and studied over a million more. Have scientists already discovered all, or most, of the species that live on Earth? If not, how many more remain to be discovered? These questions are inherently difficult to answer because they require us to estimate how much we don’t know; how many species scientists have not discovered. This difficulty is compounded by the fact that certain regions of Earth and certain group of organisms have been much more heavily studied than others and so we know the diversity of organisms that is currently documented is somewhat biased.
Many studies have attempted to estimate the total biodiversity of Earth and, with varying methodologies, have produced estimates anywhere from 2 million to over 100 million species. Recently, Dr. Camilo Mora (at the University of Hawai’i, Mānoa) and his colleagues reviewed the various estimates and tested a new methodology to narrow down this large range to a plausible estimate. In the study, Mora used a similar strategy to the species-area and rarefaction curves described above; however, the estimate of ‘effort’ on the x-axis was not the area or number of individuals sampled, but time. Scientists have been described approximately 1.2 million species since the mid 1700’s; has the number of new species described every year begun to level off? If so, that might indicate that most species have been discovered. If not, perhaps we can use the trend in new species discovered through time to predict where the graph might begin to level off. Mora’s team also considered higher taxonomic levels; we can be relatively certain that scientists have not yet discovered every single species on Earth, but might scientists have already described all the genera, families, orders, classes, or phyla? The results of Mora’s analysis are shown in Fig 3. By using the pattern of discovery of new organisms at different taxonomic levels (Fig 3A-F) and the relationship between maximum diversity of each level (Fig 3G), Mora’s team arrived at an overall estimate of 8.7 million species on Earth. Since scientists have currently described approximately 1.2 million species, this estimate indicates that approximately 86% of species on Earth have not yet been discovered. At our current rate of discovery, Mora’s team estimated that it will take scientists another 1,200 years to identify all species on Earth.
