
2.2: Weak Acids and Bases, pH and pKa
- Page ID
- 14921


The previous section described the general acid/base properties of water. There are many functional groups in both small and large biomolecules that act as acids and bases. Common weak acids are carboxylic acids and derivatives of phosphoric acid which become negatively charged on donation of a proton. Common weak bases are amines, which become positively charged on protonation. Such charge acquisition changes the properties of the acid or base. A protonated amine is no longer a nucleophile. A deprotonated carboxylic acid can now engage in an ion-ion IMF. The extent of deprotonation depends on the acidity/basicity of the environment. We have to turn to a bit of mathematics to determine that extent.
Reaction of water with self: Autoionization
As shown in the previous section, water can react with itself to produce H3O+ and OH- as illustrated in Figure \(\PageIndex{1}\).

This autoionization reaction is often represented in a simpler form:
\[\ce{H2O <=> H^{+} + OH^{-}.}\nonumber \]
The equilibrium constant for this simplified reaction can be written as
\[
K_{e q}=\frac{\left[H^{+}\right]\left[O H^{-}\right]}{H_2 O}
\]
Given the known value of \(K_{eq}\) and the concentration of water (55 M), this can be simplistically rewritten as
\[K_a=55 K_{e q}=\left[H^{+}\right]\left[O H^{-}\right]=10^{-14}\]
(see discussion of the pKa of water below.
Hence pure, neutral water has equal but small concentrations, 10-7 M of H3O+ and OH-.
You remember from introductory chemistry and life in general that the pH of pure water is 7. This derives from the general formulas for both pH and a new quantity, pKa.
\[
\begin{gathered}
p H=-\log \left[H_3 O^{+}\right]=-\log \left(10^{-7}\right)=7 \\
p K_a=-\log K_a=-\log \left(10^{-14}\right)=14
\end{gathered}
\]
Some texts incorrectly use 15.7 for the pKa of water. Here is a link to an explanation of why 14 is better. The wrong value of 15.7 would make the pKa of water higher than that of methanol (15.3), which simply can't be since the methoxide anion is less stable due to electron release by the methyl group than OH-.
All acids of the generic formula HA have pKa.
\[\ce{HA <=> H^{+} + A^{-}} \nonumber \]
The equilibrium constant for this simplified reaction can be written as
\begin{equation}
\begin{aligned}
& K_{e q}=\frac{\left[H^{+}\right]\left[A^{-}\right]}{H A} \\
K_a= & {[H A] K_{e q}=\left[H^{+}\right]\left[A^{-}\right] } \\
& p K_a=-\log K_a
\end{aligned}
\end{equation}
The pKa becomes a simple measure of the strength of an acid. The stronger the acid, the larger the Ka and the smaller the pKa.
Here is a table of pKa values for common acids and functional groups. The pKa values change with different substituents on the acids differ. The stronger the acid, the weaker the conjugate base. This should make sense as a weak base is unlikely to reabstract a proton and return to its original acidic form. Likewise, the weakest acids produce the strongest conjugate bases which reprotonate to return to the weak acid state.
| Group | Example | weaker acid | ≈ pKa | Conjugate Base | stronger conj. base |
 |
 |
||||
| alkane | 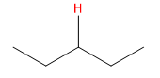 |
50 | 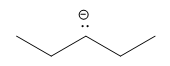 |
||
| amine | 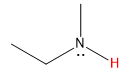 |
35 | 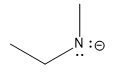 |
||
| alkyne | 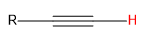 |
25 | 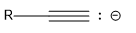 |
||
| alcohol | 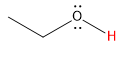 |
16 | 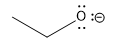 |
||
| water | 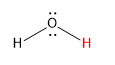 |
14 | 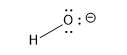 |
||
| protonated amine | 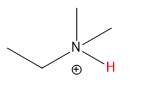 |
10 | 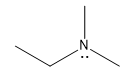 |
||
| phenol | 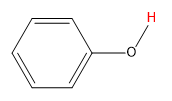 |
10 | 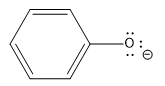 |
||
| thiol | 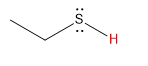 |
10 | 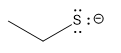 |
||
| imidazole | 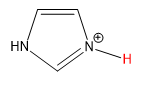 |
7 | 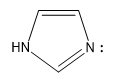 |
||
|
carboxylic |
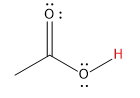 |
5 | 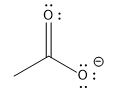 |
||
| hydrochloric acid | -8 |  |
|||
| stronger acid | weaker conj. base | ||||
The Henderson-Hasselbalch Equation
We can find the pKa for small acids in solution in pKa tables. However, from a biochemical perspective, we often need to know the charge state of the acid. Since the pH is approximately constant in organisms (more on that later), we know the [H3O+ ]. Hence we can calculate the ratio of \(A^- / HA\) using the Henderson-Hasselbalch equation (Equation \ref{HH}), which is derived below.
\begin{equation}
\begin{gathered}
K_a=\frac{\left[H^{+}\right]\left[A^{-}\right]}{H A} \\
-\log K_a=-\log \left[H^{+}\right]-\log \left(\left[A^{-}\right] /[H A]\right) \\
p K_a=p H-\log \left(\left[A^{-}\right] /[H A]\right)
\end{gathered}
\end{equation}
which given the traditional Henderson-Hasselbalch equation below.
\begin{equation}
p H=p K_a+\log \frac{\left[A^{-}\right]}{H A}
\end{equation}
In your chemistry class, you certainly would have performed titration curve analyses of acids. What is the chemistry that occurs at each step? Let's assume the pH is low and much lower than the pKa of the acid. From the Henderson-Hasselbalch equation, you would surmise that the ratio of A-/HA is very small - that is the acid is essentially fully protonated. That should also make intuitive sense. For a weak acid to be coaxed to give up a proton, a reasonably strong base (like OH-) should be added. So at low pH, the acid exists just as HA. Now consider adding an amount to NaOH to match the concentration of the ionizable proton. At that point in the titration, mass balance would suggest that the acid in its protonated state is gone, and all that remains is A-. What happens if just enough NaOH is added to react with half of the HA. The mass balance would tell us that A-=HA and at that point, the pH = pKa of the acid.
The entire titration curve can be calculated from the Henderson-Hasselbalch equation. A graph of it is shown below.
The graph simply shifts up as the pKa is increased. The pH starts soaring at the end of the graph after the added hydroxide has reacted with the last ionizable proton. After that, the pH is determined by the concentration of the strong base OH-. The graph is flattest in the middle of the curve at the inflection point of the curve. Note at this pH, pH = pKa. In the middle of the curve, the pH changes least on the addition of small amounts of OH-. This is the basis of buffering which will be covered in the next section.
If you know the pH of a solution and the pKa of the ionizable group, you can very quickly estimate the average charge state of the function group. Let's see what the Henderson-Hasselbach equation (Equation \ref{HH}) predicts under three specific pH states:
- If the pH is 2 units below the pKa (i.e under more acidic conditions when you would expect the group to be protonated), the equation becomes,\( -2 = log A/HA, or .01 = A/HA\). This means that the functional group will be about 99% protonated (with either 0 or +1 charge, depending of the functional group).
- If the pH is 2 units above the pKa, the equation becomes \(2 = log A/HA, or 100 = A/HA\). Therefore the functional group will be 99% deprotonated.
- If the pH = pka, the HH equation becomes \(0 = log A/HA, or 1 = A/HA\). Therefore the functional group will be 50% deprotonated.
From these simple examples, we have illustrated the +2 rule to determine the charge state. This rule is used to quickly determine protonation, and hence charge state, and is extremely important to know (and easy to derive).
Polyprotic Oxyacids
Acids that can donate more than one proton are called polyprotic acids. They are typically oxyacids, with the ionizable proton on an oxygen atom, which can form a reasonably stable the oxyanion (negative on the oxygen) as the oxygen is electronegative and stabilize the charge. The negative charge on the conjugate base of oxyacids is further stabilized by resonance delocalization involving the doubly bonded oxygen atom. Two of the most biologically relevant oxyacids are shown in Figure \(\PageIndex{2}\).

The pKa for each subsequent ionization is higher since it is more difficult to remove a proton from an increasingly more charged molecular ion. The titration plot of pH vs NaOH is similar to the graph above but has multiple plateaus at pH=pKa,
Derivatives of phosphoric acid are found in all major classes of biomolecules. Nucleic acids contain a sugar-phosphate link in their backbone. Many proteins become phosphorylated after they are synthesized. Membrane lipids usually contain a phosphate group. A whole class of phospholipids are found in biomembranes.
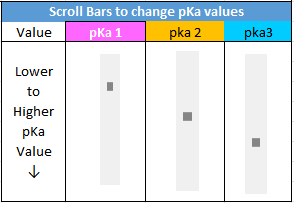
As will we see in a subsequent chapter, all amino acids have an amine and carboxylic acid group and some have an additional ionizable side chain. Each has its own pKa values. Those with three ionizable groups are triprotic acids, much like phosphoric acid. Titration curves for polyprotic acids are more complex than for a monoprotic acid. If the pKa values are separated enough, three general plateaus, each centered at the pKa value of the ionizable group, can be seen in their titration curves. If two of the groups are carboxylic acids, no clear plateau will be observed in the region of the titration curve for those groups.
Click on the Excel file link to download a spreadsheet for triprotic acid titrations that has sliders to interactively change pKa values, as shown in the image below.
Charge State of Biomolecules
The Henderson-Hasselbalch equation can be used to determine the charge state of ionizable functional groups (carboxylic and phosphoric acids, amines, imidazoles, guanidino groups) even on a large macromolecule such as proteins, which contain carboxylic acid (weak acids) and amines (weak bases). Figure \(\PageIndex{3}\) shows how the weakly acidic aspartic and glutamic acids, two common amino acids found in proteins, contribute negative charge to the protein and how the amine of the amino acid lysine, a weak base, contributes to positive charge.

Other amino acids that contain an alcoholic function group can also become phosphorylated to produce a phosphoprotein, which converts a neutral ROH group to a phosphoester with a negative two charge as shown in Figure \(\PageIndex{4}\).

pKa and Environment
The pKa is really a measure of the equilibrium constant for the reaction. And of course, you remember that ΔGo = -RT ln Keq. Therefore, pKa is independent of the concentration and depends only on the intrinsic stability of reactants with respect to the products. However, this is true only under a given set of conditions such as temperature, pressure and solvent composition.
Consider, for example, acetic acid, which in aqueous solution has a pKa of about 4.7. It is a weak acid, which dissociates only slightly to form H+ (in water the hydronium ion, H3O+, is formed) and acetate (Ac-). These ions are moderately stable in water but reassociate readily to form the starting product. The pKa of acetic acid in 80% ethanol is 6.87. This can be accounted for by the decrease in stability of the charged products, which are less shielded from each other by the less polar ethanol. Ethanol has a lower dielectric constant than water. The pKa increases to 10.32 in 100% ethanol, and to a whopping 130 in air!
The pKa values of ionizable groups in proteins vary enormously as they depend on the microenvironment of the group. Consider the amino acid aspartic acid (Asp, D), which has a -CH2CO2H R-group or "side chain" similar to acetic acid. In a given protein, a given Asp side chain might be on the surface but another in the same protein might be buried in the protein away from water. You would expect the pKa values for these two different Asp side chains to be different. The average pKa for Asp side chains in 78 different proteins was shown to be 3.5, less than that of acetic acid (4.7) but not dramatically. However, the range of pKa values for Asp in these proteins was huge, with the lowest being 0.5 (a buried Asp in the protein T4 Lysosome) and the highest being 9.2 in the protein thioredoxin from E. Coli.
Figure \(\PageIndex{5}\) shows an interactive iCn3D model of the surrounding environment of Asp 70 (D70) in T4 Lysoszyme. Its pKa has been determined experimentally to be 0.5 ,way stronger than acetic acid. The dotted cyan lines show ion-ion interactions between the -CH2CO2- side chain of Asp 70 (D7) and the positively charged imidazolium group of histidine (H31) in the protein. The distance between the two charged groups is about 3.4 A.
_in_T4_Lysoszyme_2B6Z.png?revision=1&size=bestfit&width=354&height=276)
 Figure \(\PageIndex{5}\): Surrounding environment of Asp 70 (D70) in T4 Lysoszyme (2b6z). (Copyright; author via source).
Click the image for a popup or use this external link: https://structure.ncbi.nlm.nih.gov/i...RRiVn6saN92tU6
The next model shows the surroundings of Asp 26 (D26) in E. coli thioredoxin, It has a pKa of 9.2. The dark blue group is surface exposed positively charge lysine side chain which can stabilize a negative charge on the Asp 26. Note, however, that it is much farther away than the imidazolium group in T4 lysozyme that stabilizes the negative change on D70. The rest of the model is colored based on hydrophobicity, which shows that the Asp 26 side chain is essentially surrounded by nonpolar groups. These would destabilize a negative charge on the D26, enhancing the stability of protonated (neutral) Asp, and elevating its pKa to 9.2.
_in_E._Coli_thioredoxin5hr2.png?revision=1&size=bestfit&width=355&height=310)
Figure \(\PageIndex{6}\): Surrounding environment of Asp 26 (D26) in E. Coli thioredoxin (5HR2). (Copyright; author via source).
Click the image for a popup or use this external link: https://structure.ncbi.nlm.nih.gov/i...i9BNNdbA2bmP5A