
29.10: Ethanol metabolism- The good, the bad, and the ugly
- Page ID
- 53920


David F.WilsonFranz M.Matschinsky. Medical Hypotheses, Volume 140, July 2020, 109638
https://doi.org/10.1016/j.mehy.2020.109638. Under a Creative Commons license
Abstract
Throughout the world, ethanol is both an important commercial commodity and a source of major medical and social problems. Ethanol readily passes through biological membranes and distributes throughout the body. It is oxidized, first to acetaldehyde and then to acetate, and finally by the citric acid cycle in virtually all tissues. The oxidation of ethanol is irreversible and unregulated, making the rate dependent only on local concentration and enzyme activity. This unregulated input of reducing equivalents increases reduction of both cytoplasmic and intramitochondrial NAD and, through the latter, cellular energy state {[ATP]/([ADP][Pi])}. In brain, this increase in energy state stimulates dopaminergic neural activity signalling reward and a sense of well being, while suppressing glutamatergic neural activity signalling anxiety and unease. These positive responses to ethanol ingestion are important to social alcohol consumption. Importantly, decreased free [AMP] decreases AMP-dependent protein kinase (AMPK) activity, an important regulator of cellular energy metabolism. Oxidation of substrates used for energy metabolism in the absence of ethanol is down regulated to accommodate the input from ethanol. In liver, chronic ethanol metabolism results in fatty liver and general metabolic dysfunction. In brain, transport of other oxidizable metabolites through the blood-brain barrier and the enzymes for their oxidation are both down regulated. For exposures of short duration, ethanol induced regulatory changes are rapid and reversible, recovering completely when the concentrations of ethanol and acetate fall again. Longer periods of ethanol exposure and associated chronic suppression of AMPK activity activates regulatory mechanisms, including gene expression, that operate over longer time scales, both in onset and reversal. If chronic alcohol consumption is abruptly ended, metabolism is no longer able to respond rapidly enough to compensate. Glutamatergic neural activity adapts to chronic dysregulation of glutamate metabolism and suppression of glutamatergic neural activity by increasing excitatory and decreasing inhibitory amino acid receptors. A point is reached (ethanol dependence) where withdrawal of ethanol results in significant metabolic energy depletion in neurons and other brain cells as well as hyperexcitation of the glutamatergic system. The extent and regional specificity of energy depletion in the brain, combined with hyperactivity of the glutamatergic neuronal system, largely determines the severity of withdrawal symptoms.
Overview: ethanol and human metabolism
In nature, ethanol is rarely found in foodstuffs at levels where consumption can raise blood concentrations to the levels reached by humans during social drinking. When it does occur, such as when fruit ferments either on the tree or after falling to the ground, exposure to that food source is brief. As a result, the amount of ethanol consumed is a tiny fraction of that consumed by even modest social drinkers. Ethanol is a “rogue” nutrient for which there was no evolutionary pressure for its regulation. Ethanol dependence became a problem only after humans developed methods for preservation of food, one of which was fermentation. In order to provide a framework for understanding the importance of ethanol metabolism and its effect on metabolic homeostasis in humans, Table 1 summarizes some aspects of ethanol consumption important to understanding its impact. Dettling et al. [25] measured the rate of elimination of ethanol by humans following ingestion of 0.9 g/kg body weight over a period of 2 h, an amount that resulted in maximal blood alcohol levels near 0.08 g/dl (legal limit for driving in US). After consumption stopped, ethanol disappearance, measured by decrease in blood levels, occurred at a constant rate (zero order) of about 0.016 g/dl/h for men and 0.018 g/dl/h for women. Translated into kilocalories (cal), for an 80 kg man this is 73 cal/h while for 60 kg women it is 55 cal/h. A 70 kg (155 lb) person expends about 102 cal/h working on a computer, 120 cal/h sitting in meetings, 130 cal/h during desk work or sitting in class, 186 cal/h doing police work, bartending or waitressing (Table 2). Maintenance diets for average adults are 2000 cal/day for females (83 cal/h) and 2600 cal/day (108 cal/h) for males. As such, ethanol becomes responsible for more than 50% of each individual’s energy metabolism until it is eliminated. Elimination requires about 5hr after consumption stops (7h total) and throughout that time, ethanol oxidation is the largest carbon source for energy metabolism. Further increase in alcohol consumption, either acutely or chronically, extends the time before blood alcohol levels return to near zero but not the rate at which it is removed. For ethanol dependent individuals, blood alcohol levels remain significant throughout each day. This means ethanol contributes about 1700 cal/day (80 kg male) and 1300 cal/day (60 kg female), and many metabolic and nutrient deficiencies may develop [66], [69], [62], [63], [64].
Table 1. Ethanol metabolism and the human diet (social drinking).
| 0.9 g/kg (male) | Blood max 0.084 g/dl | Elimination 0.016 g/dl/h | time 7 h#; 5 h* |
| 0.84 g/kg (female) | Blood max 0.082 g/dl | Elimination 0.018 g/dl/h | Time 6.6 h#; 4.6hr* |
| 80 kg/male (176 lb) | Total, 72 g (5drinks) | 511 calories | 73 calories/h |
| 60 kg/female (132 lb) | Total, 50 g (3.6 drinks) | 355 calories | 54 calories/h |
Measurements of the rate of elimination of ethanol from the body in human volunteers [25]. Ethanol ingestion followed a typical breakfast and consisted of consuming drinks of the subject’s choice. The number of drinks was calculated for 14 g of pure ethanol per drink. The amount consumed raised blood alcohol to near 0.08 mg/dl (17 mM, legal limit for driving in US) by the end of the 2 h period for consumption. After consumption stopped, ethanol disappeared from the blood at a nearly linear (zero order) rate of about 0.016 g/dl/h for men and 0.018 g/dl/h for women. The times required for blood alcohol to fall to near zero, h# and h*, were measured from beginning and end of consumption, respectively.
Table 2. Metabolic energy utilization by a 70 kg (155 lb) person.
| Sitting (computer work) | 102 calories/h |
| Sitting in meetings | 120 calories/h |
| Desk work or sitting in class | 130 calories/h |
| Police work, bartending, waitressing | 186 calories/h |
As noted in Table 1, for a 70 kg person ethanol contributes about 63 calories/h while the total hourly caloric expenditure is shown in the table. Assuming a drinker is awake and at activities similar to sitting in class both while and after drinking, they would be expected to expend about 130 calories/h. In that case, ethanol would provide about 50% of whole body energy metabolism until the blood alcohol fell below about 0.006 g/dl (below the KM for ADH1 of 1.4 mM).
Oxidation of ethanol occurs through three enzymes, alcohol dehydrogenase (ADH), catalase, and P450 (CYP2E1), and they all produce acetaldehyde. In the present paper, focus is on the first two because they are responsible for oxidation of most of the consumed ethanol. Ethanol readily passes through most biological membranes, and the concentration in all water spaces, including the brain, approximates that in blood plasma. Thus, tissues and cells throughout the body are nearly equally exposed to ethanol and its rate of metabolism is determined by local enzyme content. The reactions of the three ethanol oxidizing systems and the KM of each for ethanol are:
- 1. Alcohol dehydrogenase; ADH1, KM = 1.4 mM [12]:
- 2. Catalase; KM = 12 mM [103]:
- 3. Cytochrome P450 2E1 (CYP2E1); KM = 8–10 mM (12):
The equilibrium constant for the ADH reaction at pH 7.0 is approximately 10−4 [1], [6], [83]. In the cytoplasm, where the reaction occurs, the [NAD+]/[NADH] is greater than 100 and acetaldehyde concentrations remain less than 20 μM [83]. The [NAD+)/[NADH) is high enough that the ratio of the forward to reverse reactions of ADH is about 10 and the net reaction is strongly toward acetaldehyde (and NADH) formation. The reactions of catalase and CYP2E1 are irreversible under all physiological conditions. Acetaldehyde is chemically reactive and can react nonenzymatically with other cellular components to form products that are metabolically active and/or cytotoxic. The concentration of acetaldehyde is kept low through rapid removal by aldehyde dehydrogenase (ALDH) which is widely distributed in tissues [12], [127], [128]. ALDH oxidizes acetaldehyde to acetate, passing the reducing equivalents to NAD+:(4)Acetaldehyde + NAD+ → Acetate + NADH + H+
ALDH2 is localized in the mitochondrial matrix, has a high affinity for acetaldehyde (KM = 1.3 μM in brain cortex [40], and high specific activity. The equilibrium constant for this reaction at pH 7.0 is approximately 4 × 10⁹, and it is irreversible under physiological conditions [1]. As a result of ALDH activity, systemic levels of acetaldehyde are kept low [40]. Acetaldehyde is a chemically reactive compound with significant toxicity and, for individuals who express an inactive form of ALDH2, ethanol consumption can have side effects ranging from unpleasant sensations to serious illness [12], [60]. Neither ethanol oxidation (ADH, catalase, CYP2E1) nor acetaldehyde oxidation (ALDH) is subject to significant regulation and increasing alcohol concentration reduces both cytoplasmic (by ADH) and mitochondrial (by ALDH2) NAD pools. Because ethanol oxidation is not regulated, local (individual cell) rates of oxidation are cell specific, determined by the activity and degree of saturation of the responsible enzyme(s) in each cell.
Acetate, the major product of ethanol oxidation, has roles both in energy metabolism and in regulation of metabolism. Acetate is converted to acetylCoA by acetylCoA synthetase:(5)acetate + CoASH + ATP → acetylCoA + AMP + pyrophosphate
In mitochondria, acetylCoA primarily enters the citric acid cycle and is oxidized, but at the cellular level is also used to acetylate proteins, altering the activity of individual enzymes and, through histone acetylation, gene expression [74]. The regulatory role of protein acetylation, although important, is outside the scope of this paper and will not be further discussed.
In summary: Ethanol readily distributes throughout the body and can be a major fraction of caloric utilization. Oxidation of ethanol and its products, acetaldehyde and acetate, is irreversible and unregulated. This “pushes” energy metabolism and can increase reduction of both cytoplasmic and mitochondrial NAD, thereby increasing cellular energy state. The rate of ethanol oxidation, and its associated metabolic disturbance, is dependent on ethanol concentration and local (cellular) enzyme content.
Ethanol oxidation in liver and its metabolic consequences
Most of consumed alcohol is oxidized in liver by ADH1 to acetate [52], [67]. In the process, there are profound alterations in hepatic metabolism (Fig. 1, including: excessive reduction of cytoplasmic and mitochondrial NAD pools, inhibition of gluconeogenesis and fatty acid oxidation, increased [ATP]/([ADP]f[Pi]), and decrease in [AMP]f. The subscript f is used to emphasis that the concentrations of ADP and AMP relevant to metabolic regulation are free concentrations, not total amounts in the cell. Lundquist and coworkers [67] reported that, in healthy humans infused iv with ethanol at rates sufficient to result in blood concentrations near 26 mM (0.12 g/dL) oxidation of ethanol to acetate accounted for most of hepatic oxygen consumption. Although some of the acetate produced in liver was further oxidized through the citric acid cycle, most (>75%) was released into the blood. The rate of NADH production from ethanol oxidation to acetate is high enough that flux through the citric acid cycle (CAC), and therefore CO2 production by the liver, is substantially decreased [52]. The lactate/pyruvate ratio is increased, indicating reduction of cytosolic NAD, as is the β-hydroxybutyrate/acetoacetate ratio, indicating increased reduction of intramitochondrial NAD [29], [52], [67]. Increase in intramitochondrial NAD reduction with little or no change in oxygen concentration or the rate of oxygen consumption [97] is consistent with increase in cellular energy state {[ATP]/([ADP]f[Pi])} [115], [118]. In liver, increase in energy state suppresses the activity of pyruvate dehydrogenase (increased acetylCoA, [NADH]/[NAD+], and [ATP]/[ADP]f), activates pyruvate carboxylase (high acetylCoA), decreases [AMP]f, lowering AMP-dependent protein kinase (AMPK) activity [61], [98], [105], [124]. Decreased AMPK activity increases acetylCoA carboxylase activity [19], [30], [38], [39], [42], [124] and the concentration of malonylCoA [19]. MalonylCoA inhibits carnitine palmitoyl transferase 1 [30], [73] suppressing uptake and oxidation of long chain fatty acids by mitochondria. Fatty acid synthesis is activated and this, combined with excess fatty acids taken up by the liver, results in excess fatty acids being made into triglycerides. Interestingly, Galli and coworkers [32] reported that expression of ADH1 in HeLa cells was sufficient to result in ethanol induced fat accumulation, consistent with ethanol oxidation induced inhibition of AMPK being responsible for cellular lipid accumulation.
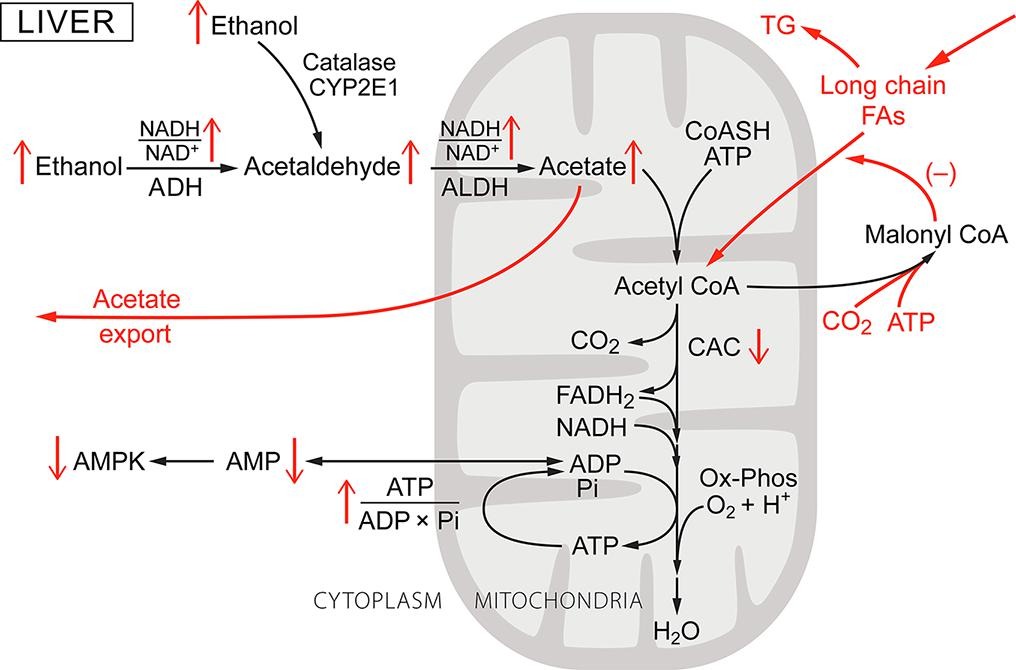
Fig. 1. Ethanol metabolism in the liver: a general schematic of its metabolism and effect on liver metabolism. As the ethanol concentration in blood increases it enters all tissues and is oxidized, mostly through alcohol dehydrogenase 1 (ADH1) in the liver. Whether a particular metabolic parameter is increased or decreased is indicated by an up or down arrow. The metabolic steps characteristic to liver are shown in red. ADH is cytoplasmic and as ethanol concentration increases ethanol oxidation increases cytoplasmic NADH/NAD+ (lactate/pyruvate) ratio. Acetaldehyde, the product of ethanol oxidation, enters the mitochondria and is oxidized to acetate by mitochondrial acetaldehyde dehydrogenase (ALDH2), increasing intramitochondrial NADH/NAD+ (β-hydroxybutyrate/acetoacetate) ratio. The acetate formed is mostly exported into the blood. Both the ADH and ALDH reactions are irreversible and the rate of ethanol oxidation by ADH1 is determined by enzyme content and degree of saturation (KM = 1.4 mM). At blood alcohol greater than about 0.01 g/dl (2.2 mM), the rates are high enough that hepatic citric acid (CAC) activity, as measured by CO2 production, is markedly suppressed. Oxygen consumption (Ox-Phos) is slightly decreased due to the higher ATP/O ratio when oxidizing NADH than for long chain fatty acids. The energy state is increased, decreasing the concentration of free AMP ([AMP]f) and thereby the activity of AMP-dependent protein kinase (AMPK). MalonyCoA is increased and this inhibits acylcarnitine transferase 1, inhibiting long chain fatty acid transport into the mitochondria and subsequent oxidation. (For interpretation of the references to colour in this figure legend, the reader is referred to the web version of this article.)
Acetate, the primary product of ethanol oxidation by the liver, is a short (shortest) chain fatty acid and oxidation of short chain fatty acids is not subject to the regulation imposed on oxidation of long chain fatty acids. Acetate produced by the liver results in a large increase in acetate concentration in the blood, to about 1 mM [44], [78]. The rate at which acetate is taken up, and oxidized, by other tissues is dependent on concentration in the blood. In both humans and rats, if blood acetate concentrations are maintained near 1 mM or higher, this results in under consumption of long chain fatty acids and activation of fatty acid synthesis [19], [30], [62], [64], [95], [122]. Since ethanol and acetate are only two carbons long, their products cannot be used for net synthesis of glucose or for anaplerotic support of the citric acid cycle or net glucose synthesis. The lactate/pyruvate ratio is increased, in large part due to decrease in pyruvate [52], and this limits the activity of pyruvate carboxylase, suppressing gluconeogenesis [29], [52], [53]. Blood glucose concentrations decrease [53], but only slightly because the set point for glucose homeostasis in only slightly decreased [72] and glucose consumption by peripheral tissue and brain is decreased.
AMP-dependent protein kinase and the metabolic responses to ethanol oxidation.
Essentially all cells have adenylate kinase and the activity is sufficient to maintain the reaction:(1)ATP + AMP = 2 ADPnear equilibrium. The equilibrium constant is approximately 1.0, and [ATP] is maintained nearly constant, so [AMP]f decreases as the square of the decrease in free [ADP]f. This makes [AMP]f a very sensitive measure of the energy state [51], [115], [118]. As a result, energy metabolism has evolved with [AMP]f as a core regulatory parameter in setting metabolic homeostasis. It is notable that metabolic homeostasis in eukaryotes has an [AMP]f “set point” and cellular metabolism operates over a narrow range of [AMP]f [115], [118]. Central to maintaining metabolic homeostasis is AMP-dependent protein kinase (AMPK) [30], [38], [39], [42], [49], [118]. Although [AMP]f also contributes to the regulation of many other enzymes and regulatory pathways, the importance of AMPK is shown schematically in Fig. 2A. This includes modulation not only of complex cellular functions, such as protein synthesis, autophagy, mitophagy, and gene expression, but also of individual enzymes and regulatory proteins (Fig. 2B). Most discussions of metabolic regulation involving AMPK focus on the conditions where [AMP]f increases, as occurs in exercise, hypoxia, or inhibition of oxidative phosphorylation, and AMPK activity increases. Activation of AMPK is designed to increase ATP production by increasing catabolic ATP production and inhibiting anabolic ATP consumption. Ethanol ingestion, however, decreases [AMP]f and thereby AMPK activity, suppressing catabolic metabolism and enhancing anabolic metabolism. Indeed, treatment with 5-aminoimidazole-4-carboxamide-1-β-D-ribofuranoside (AICAR), which activates AMPK, has been reported to provide significant protection from alcohol induced fatty liver in rats [105]. Because oxidation of ethanol and acetate is cell specific and largely unregulated, the metabolic consequences differ among cell types and overall metabolic integration disrupted.
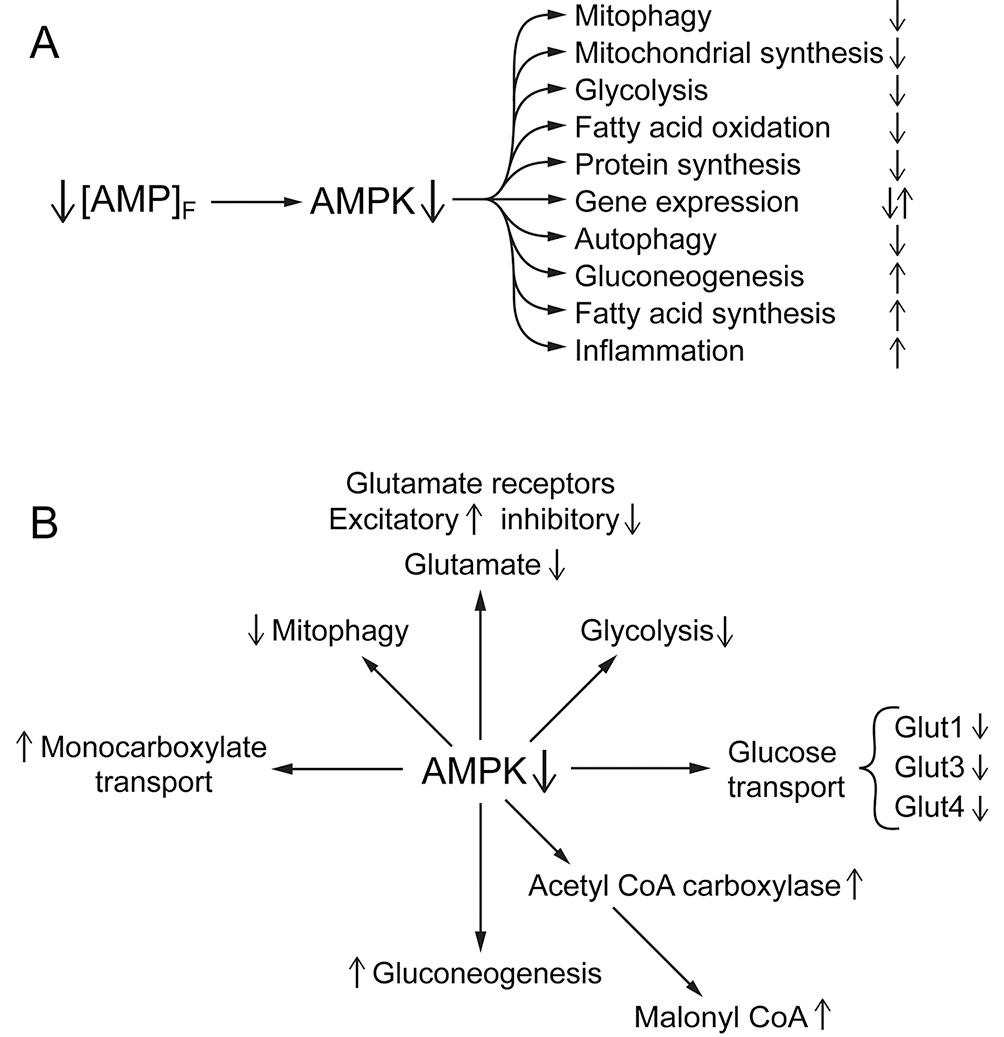
Fig. 2. A, B. The central role of AMPK in the metabolic responses to ethanol consumption. Ethanol oxidation, by increasing intramitochondrial [NADH]/[NAD+] and cellular energy state, decreases the concentration of free AMP ([AMP]f). This suppresses phosphorylation of AMPK and thereby its activity. AMPK has a central role in maintaining metabolic homeostasis (for reviews see [38], [39], [49]). Fig. 2A indicates some of the wide range of metabolism related processes that respond to alterations in AMPK activity. Some of these are expected to increase and others decrease in response to the ethanol induced decrease in AMPK activity with the direction indicated by up or down arrows on the right. Fig. 2B indicates a few effects of decreased [AMPK] on specific enzymes/processes that are noted in the text. When ethanol is consumed, its high caloric content and lack of regulation results in wide spread disruption of metabolism. Central to this disruption is suppression of “normal” [AMP]f and AMPK activity.
Ethanol/acetate metabolism and its effects on muscle
Although liver and brain are the primary tissues of concern in when considering the consequences of ethanol consumption, other tissues are also affected. This includes cardiac and skeletal muscle. Although neither has significant ADH activity, they have high acetylCoA synthetase and acetylCoA carboxylase and rely heavily on fatty acid oxidation for energy metabolism. This is particularly true when only moderately active (heart) or during rest and after endurance exercise (skeletal muscle) (Fig. 3). Chen et al. [16] reported that chronic ethanol feeding in rats suppresses expression of AMPK, myocyte enhancer factor 2, and glucose transporter 4 (Glut4) in myocardium. The effects of ethanol on muscle metabolism would be expected to be indirect, arising from elevated blood acetate. This is consistent with the report by Kiviluoma [48] that addition of acetate to the perfusate of isolated rat hearts increases incorporation of fatty acids into myocardial lipids. In addition, adding acetate at mM concentrations to the perfusate of isolated rat hearts increases reduction of intramitochondrial NAD and energy state relative to glucose perfusion [48], [99]. Similar observations have been reported for rat skeletal muscle in vivo by Bertocci et al. [11]. When lactate and acetate consumption were measured in resting skeletal muscle, acetate provided most of the acetylCoA (65%) oxidized by the citric acid cycle (CAC). In contracting muscle, the fraction provided by acetate decreased, but only to 43%. Thus, in heart under moderate work load and in resting skeletal muscle, acetate taken up from the blood can be oxidized at rates sufficient to maintain energy metabolism. Acetate displaces (down regulates) oxidation of the physiologically preferred substrate, long chain fatty acids. Putman et al. [82] measured metabolites and pyruvate dehydrogenase activity in muscle during acetate infusion in humans. The reported changes included increase in acetylCoA/CoASH and acetyl-carnitine, as well as decrease in active pyruvate dehydrogenase (PDHa). Uncontrolled production of acetylCoA from acetate in mitochondria and the resultant increase in acetylCoA/CoA, if sustained, would deplete intramitochondrial CoASH. CoASH is required for citric acid cycle. Synthesis of acetyl-carnitine by carnitine acetyl transferase allows export of excess active acetyl groups to the cytoplasm but at the expense of intramitochondrial carnitine. This process appears to be self limiting due to depletion of intramitochondrial CoASH for acetylCoA synthase combined with decreased oxalacetate for citrate synthase limits input of acetylCoA to the rate of oxidation through the citric acid cycle. Evidence supports the view that, following ethanol ingestion, elevated blood acetate becomes a major energy source for resting and moderately active muscle, consistent with associated suppression of AMPK activity [16], [48], [99]. Interestingly, tissues from alcohol dependent humans show dysfunctions in protein synthesis, mitochondrial content, and morphology, consistent with chronic suppression of AMPK activity (Fig. 2A).
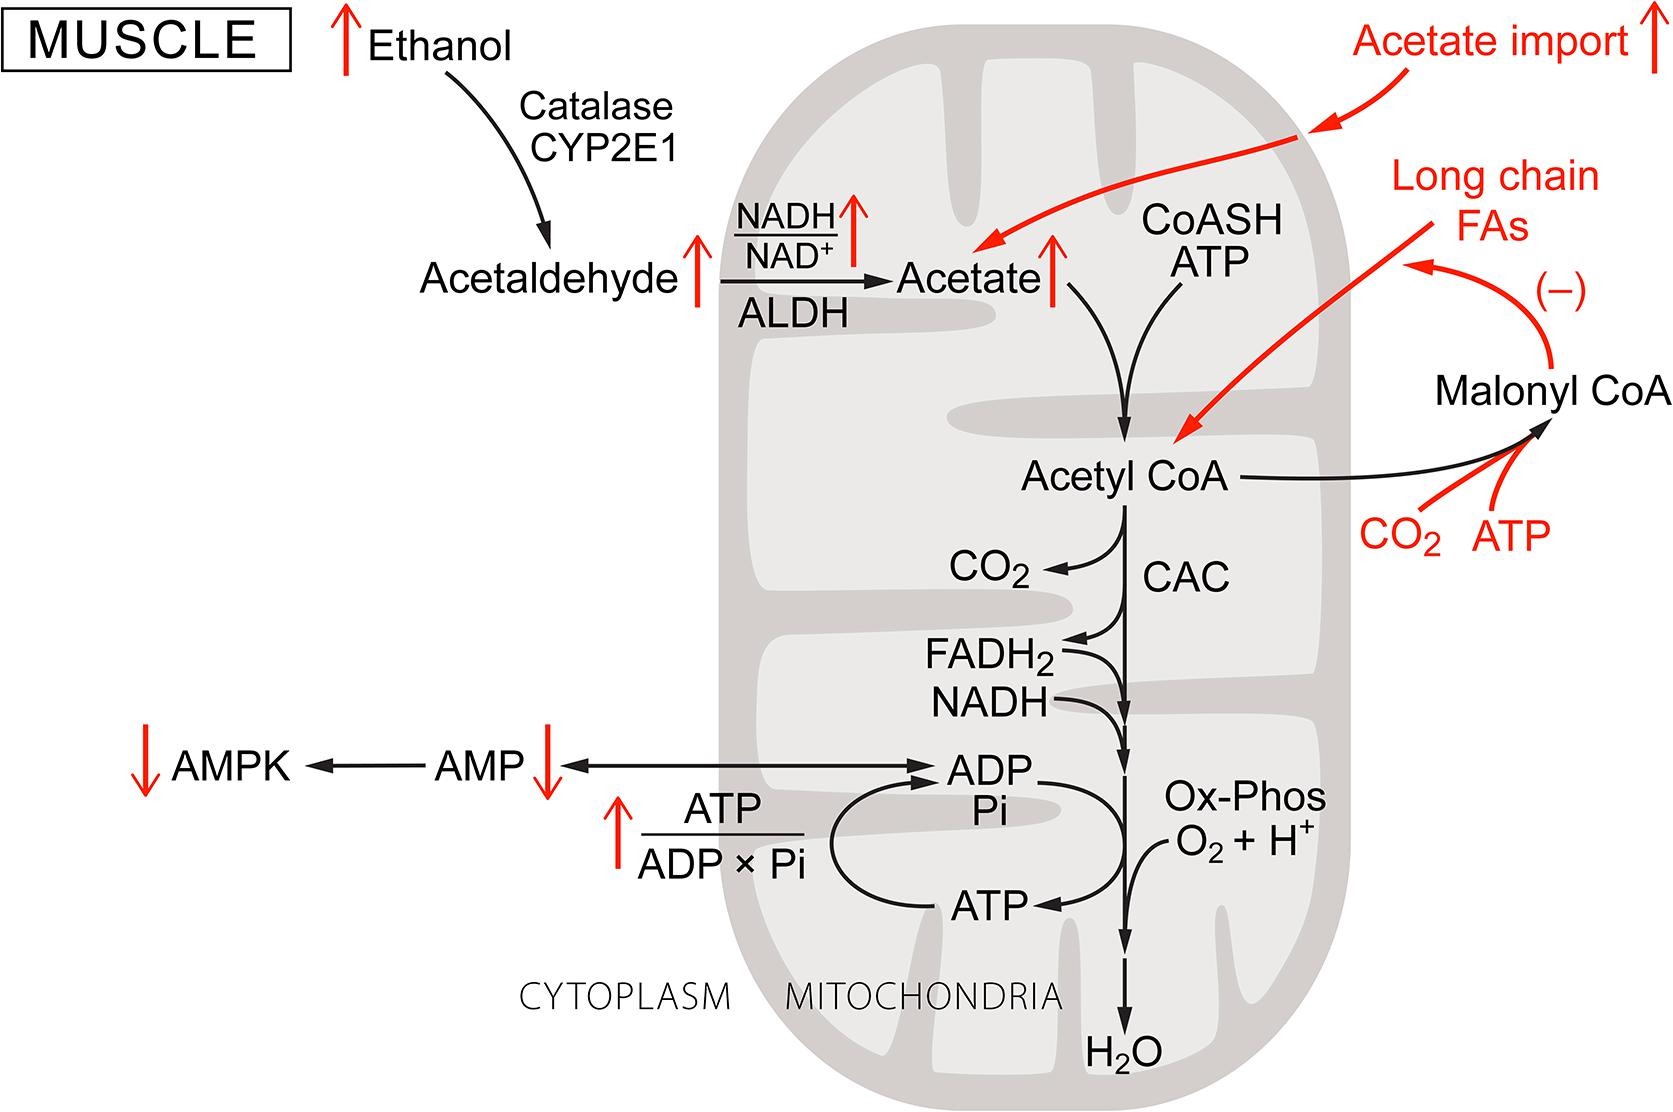
Fig. 3. Ethanol metabolism in muscle: A schematic of metabolism in muscle, which does not have alcohol dehydrogenase. Muscle, due to the lack of ethanol dehydrogenase, may oxidize some ethanol through catalase and/or CYP2E1, but these rates are low. Acetate is, however, taken up from the blood, activated by acetylCoA synthetase, and oxidized through the CAC and oxidative phosphorylation. This uncontrolled input of acetylCoA increases the acetylCoA/CoASH ratio and energy state, decreasing [AMP]f and thereby AMPK activity. Decreased AMPK activity suppresses long chain fatty acid oxidation.
Ethanol metabolism in brain and its metabolic consequences: A. General considerations
Brain is a complex organ with several types of specialized cells, each with its own metabolic requirements and supporting complement of enzymes and metabolite transporters. Ethanol produces major metabolic disturbances in brain metabolism (shown schematically in Fig. 4) including: decreased glucose uptake and metabolism, increased monocarboxylate uptake and metabolism, stimulation of dopaminergic neural activity, suppression of glutamatergic neural activity, and disruption of glutamate metabolism. Catalase, ADH, and P450 systems for oxidizing ethanol are all present in brain, and brain actively takes up acetate from the blood. Determining the role of ADH, however, is complicated by the presence of multiple different forms of alcohol dehydrogenase as well as heterogeneous distributions among cells and tissues [5], [12], [13], [47]. Initial reports by Raskin and Sokoloff [84] of low, but significant, rates of oxidation of ethanol by ADH in subfractions of brain tissue were largely discounted because of the low activity and concerns about the method of analysis [126], [127]. The enzyme properties reported, however, were consistent with the presence of small amounts of ADH1. Initial immunohistochemical data focused on ADH3, an alcohol dehydrogenase that is widely distributed in brain but has negligible activity for ethanol [27], [126], leading some to conclude that metabolism of ethanol by ADH in brain was not significant. Later measurements using antibodies grown to purified liver ADH indicated that while the total amount of enzyme are low, it is concentrated in individual neurons of cerebral cortex, hypothalamus, infundibular stalk of pituitary, and Purkinje cells of cerebellum. This distribution correlates with known sites of ethanol toxicity (13. 47). More recently, selective antibodies for ADH1 (KM = 1.4 mM) and ADH4 (KM = 37 mM) have been used [27]. Again the total amounts were low but concentrated in a small fraction of the brain cells. Martinez et al [70] examined tissue sections from several regions of adult rat brain by in situ hybridization to detect expression of genes encoding ADH1. ADH1 mRNA was found in granular and Purkinje cell layers of cerebellum, in pyramidal and granule cells of hippocampal formation, and in some types of cells in cerebral cortex. ADH4 expression was detected in Purkinje cells, pyramidal and granule cells of the hippocampal formation, and pyramidal cells of cerebral cortex. Substantial levels of both ADH1 and ADH4 mRNAs were detected cells of the CNS epithelial and vascular tissues: leptomeninges, choroidplexus, ependymocytes of ventricle walls, and endothelium. Thus, current evidence is consistent with oxidation of ethanol by ADH capable of significantly affecting brain function in subpopulations of cells in which ADH1 and/or ADH4 are expressed.
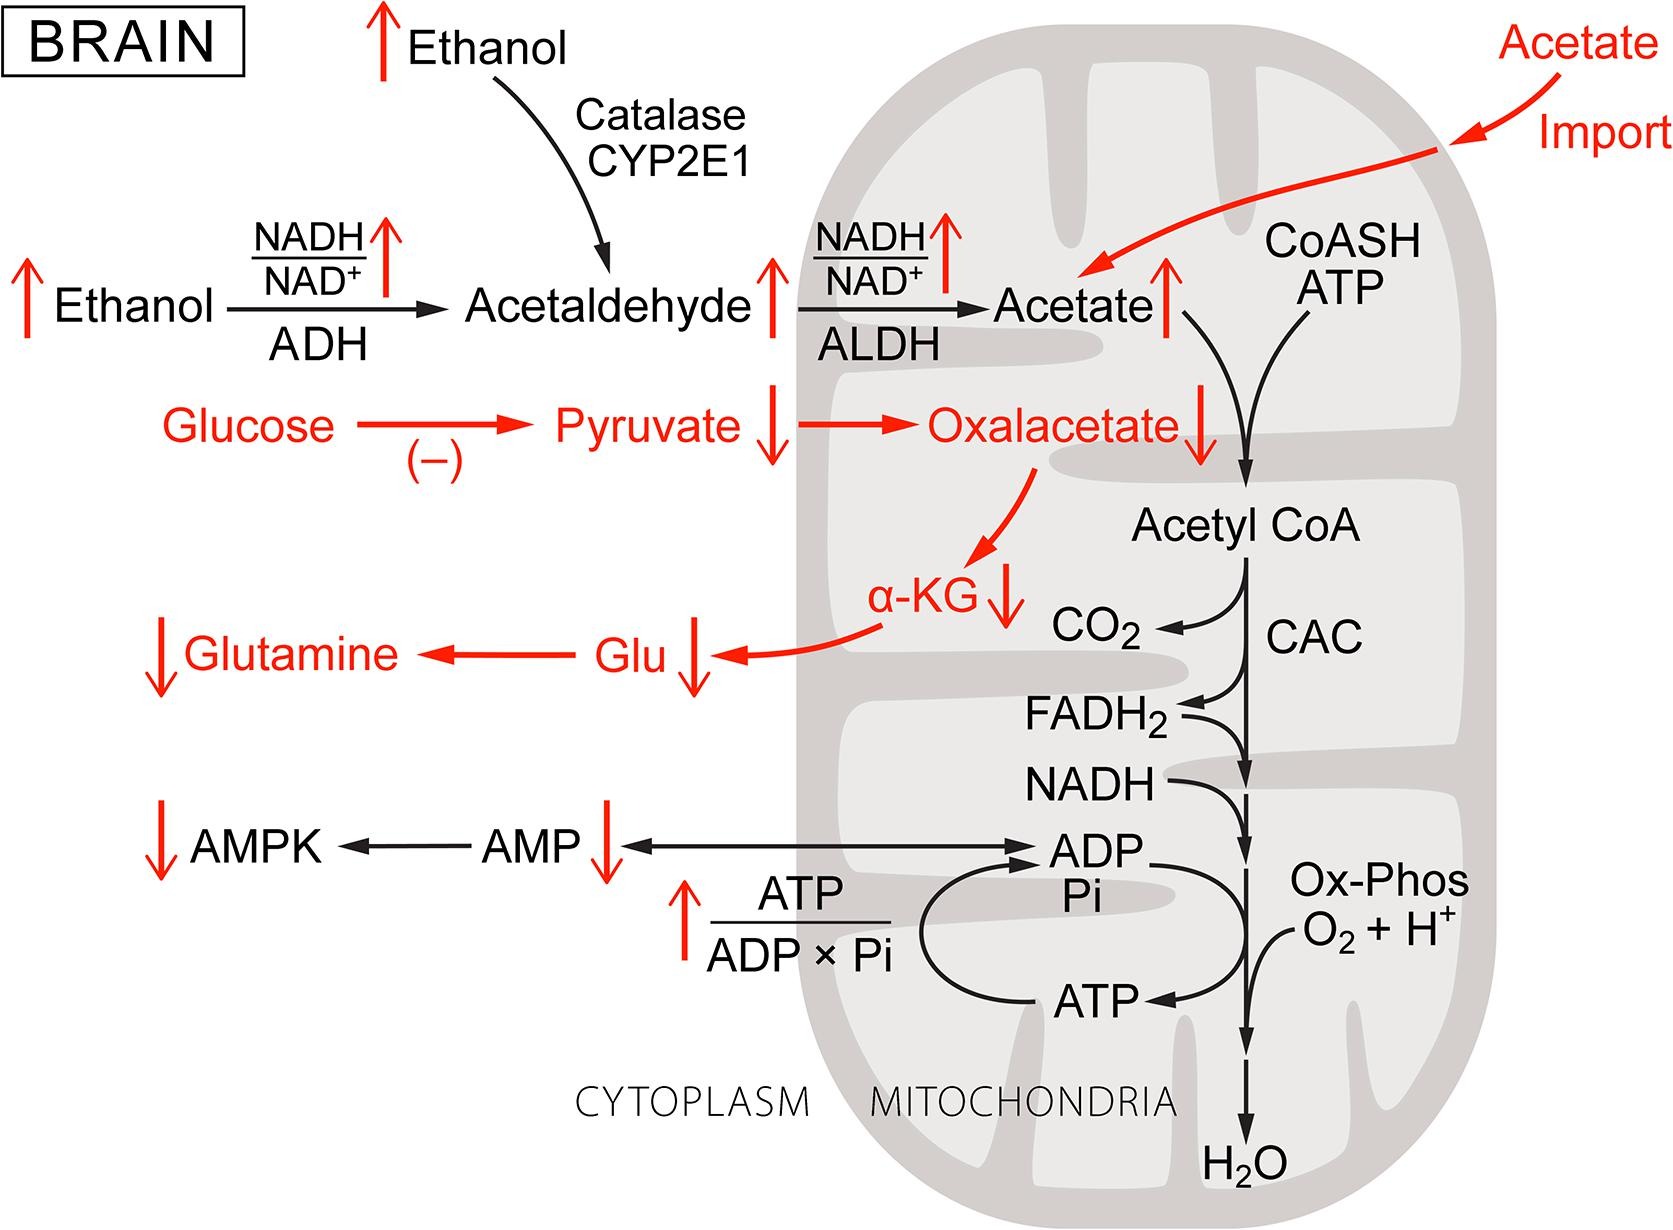
Fig. 4. Ethanol metabolism in the brain: a schematic of its metabolism and the changes induced with respect to normal brain metabolism. As was the case for Fig. 1, Fig. 2, Fig. 3, increase or decrease in each metabolic parameter is indicated by an up or down arrow. Metabolic steps characteristic brain cells and important to the effects of ethanol are shown in red. Heterogeneity in cell types and cell metabolism in brain precludes a general characterization but cells can be roughly separated into those with ADH1, ADH4 and those without this activity. Those without ADH1 and/or ADH4 oxidize ethanol by catalase or cytochrome P450 (CYP2E1) to acetaldehyde without reducing NAD. The amounts of ADH1 and ADH4 in brain are small but concentrated in a small fraction of the total number of cells. In cells with ADH1 and/or ADH4, ethanol oxidation increases the cytoplasmic NADH/NAD+. All brain cells have mitochondrial aldehyde dehydrogenase and produce acetaldehyde, if not by ADH, by catalase and CYP2E1. Oxidation of acetaldehyde and/or acetate taken up from blood augments that produced within the cell, increasing intramitochondrial NADH/NAD+. Brain cells, notably astrocytes, normally consume glucose and produce pyruvate for anaplerosis through pyruvate carboxylase. Ethanol and acetate catabolism, however, down regulates glucose consumption by decreasing both glucose transport and glycolysis. Decreased pyruvate production from glucose, combined with increased lactate/pyruvate, limits the rate of pyruvate carboxylation and thereby de novo synthesis of glutamate. (For interpretation of the references to colour in this figure legend, the reader is referred to the web version of this article.)
Ethanol and acetate metabolism in brain: B. Rates and contributions to total energy production
Ethanol, acetaldehyde, and acetate have been shown to be oxidized in brain and the combined rates are high enough to disrupt glucose and amino acid metabolism. Wang and coworkers [111] studied the rate of ethanol oxidation in rat brain cortex in vivo by 13C MRI. Using a combination of 2-13C labeled ethanol and 1,2-13C labeled acetate, they reported significant rates of incorporation of carbon from ethanol into glutamate and glutamine. The authors calculated ethanol oxidation accounted for 12% and 20% cortical oxidative metabolism in ethanol naïve and ethanol pre-treated rats. The measurements were specifically of ethanol oxidation and did not include oxidation of acetate taken up from the blood. Measurements of acetate metabolism in rat brain in vivo using 13C MRI [21], [81], [107] show it is readily transported through the blood-brain barrier and metabolized. As acetate concentration in blood was raised to 2–3 mM, the rate of metabolism by the brain saturated. At saturation, enrichment of glutamine and glutamate at the C4 position were consistent with most of the acetylCoA entering the citric acid cycle in astrocytes arising from acetate with the remaining coming from unlabeled glucose. The models used in the interpretation assumed, however, that acetate metabolism occurred almost entirely in astrocytes with negligible contribution by neurons. This may not be appropriate [87] particularly as the neurons contain substantial levels of acetylCoA synthase. As noted earlier, when ethanol is ingested, acetate is produced in the liver and released into the blood. Blood acetate levels rise rapidly to about 1 mM or more [44], [78], and ethanol oxidation in brain is augmented by oxidation of acetate taken up from the blood. When these are combined, ethanol becomes a major source of acetylCoA for production of ATP used for ATP production in many brain cells. Recent reports include evidence that in mice ethanol consumption leads to rapid increase in histone acetylation in the brain with the acetyl moiety arising from ethanol [74]. This acetylation is reported to alter gene expression in hippocampus and to affect cellular mechanisms related to learning. The level of acetylCoA and the acetylCoA/CoASH ratio are important regulators of protein acetylation and are coupled to cellular energy state and AMPK activity.
Ethanol exposure Phase 1: Acute effects of ethanol ingestion on metabolism
As noted above, alcohol ingestion results in rapid changes in the metabolism of brain and other tissues. Following ingestion, oxidation of ethanol takes precedence over other metabolites used for energy metabolism and the latter are down regulated to accommodate the input from ethanol. The effects are cell and tissue specific and depend on how rapidly ethanol is oxidized and/or acetate is taken up through the monocarboxylate transporter. Liver, due to its large size, immediate exposure to the ingested alcohol from the portal circulation, and high content of ADH1 dominates systemic ethanol disposal. Effects of acute ethanol ingestion on liver include rapid increase in metabolic energy state, production and export of acetate, suppression of long chain fatty acid oxidation and synthesis, increased β-hydroxybutyrate/acetoacetate ratios, and under production of glucose by gluconeogenesis. The response of other tissues to ethanol exposure is heterogeneous. In pancreas, increased energy state due to ethanol/acetate metabolism slightly lowers the glucose homeostasis set point [116], [117], [119]. In most other tissues, input of acetylCoA from ethanol and acetate largely replaces acetylCoA from long chain fatty acids and amino acids for energy metabolism [31], [107], [110]. The oxidation of ethanol and/or acetate induces an increase in energy state and associated decrease in [AMP]f and AMPK activity [19], [30], [31], [38], [39]. Increase in blood acetate in rats to 300 µM, for example, decreased AMPK phosphorylation in hypothalmus by about 50% [31]. Decreased AMPK activity suppresses GLUT1, GLUT3, and GLUT4, the dominant glucose transporters in brain [31], [37], [75], [119]. Handa et al. [37] isolated plasma membranes and low density microsomal fractions from rat brain 4 h after their treatment with ethanol (3 g/kg body weight) and reported immunoblot measured protein decreased by 17% and 71% for GLUT1 and 54% and 21% for GLUT3, respectively. In addition, immunofluorescence imaging showed decreased GLUT1 in choroid plexus and cortical microvessels. This is consistent with reports by Muneer and coworkers [75] that chronic ethanol treatment suppresses glucose transport and GLUT1 protein expression in microvessels of the blood-brain barrier of rats and by Frost et al. [31] that it decreased GLUT1 in the plasma membrane of brain cells in primary culture. Accompanying ethanol induced decrease in glucose transporters is increase in monocarboxylate transporter [65]. Pyruvate is needed not only for anaplerotic maintenance of citric acid cycle activity but also for de novo synthesis of glutamate in astrocytes through the activity of pyruvate carboxylase [125]. Increased uptake of lactate from the blood [65] would normally provide increased pyruvate through oxidation by cytoplasmic NAD+. For cells with ADH1 and/or ADH4, however, oxidation of ethanol in the cytoplasm results in increased reduction of the cytoplasmic NAD pool and an increase in the lactate/pyruvate ratio [52]. In these and other cells, acetaldehyde and acetate oxidation in the mitochondria also increases reduction of intramitochondrial NAD, suppressing aspartate-glutamate shuttle activity. Although intracellular lactate concentrations in brain increase during ethanol oxidation, this is due to elevated systemic lactate/pyruvate and pyruvate concentrations actually decrease. Intracellular pyruvate concentrations are normally less than the KM of pyruvate carboxylase, which is near 400 μM [92], making the rate of pyruvate carboxylation strongly dependent on intracellular pyruvate concentration [52]. Ethanol induced decrease in intracellular pyruvate suppresses de novo synthesis of oxalacetate, and thereby of glutamate, in astrocytes and this disrupts glutamate homeostasis in astrocytes and glutamatergic neurons.
Ethanol exposure Phase 2: Metabolic consequences of alcohol ingestion in greater amounts and over intermediate periods of time (days, weeks)
Ethanol dependence arises after significant periods of nearly continuous alcohol consumption, typically months to years. This is not an all or nothing phenomenon, however, and there is a transition period during which withdrawal of alcohol results in a progressively greater sense of unease, anxiety, and irritability that can be overcome by consuming alcohol. The shortest time of exposure that generates significant ethanol dependence may be binge drinking, in which substantial amounts of ethanol are consumed over periods of one or more days. A few hours after drinking stops, ethanol levels approach zero and there is a period that often includes severe headaches and other unpleasant after effects, referred to as a hangover. The colloquial antidote for a hangover is “hair of the dog that bit you”, i.e. drinking some of the same alcoholic beverage consumed during the binge in order to alleviate the hangover. This antidote acutely relieves many of the symptoms, consistent with hangovers arising in part through deficiency in oxidizable substrates for energy metabolism in brain. The extended time and extent of alcohol exposure during a binge allows participation of slower regulatory processes, including altered rates of protein turnover and gene expression. When the levels of alcohol and acetate fall too quickly for regulation to fully compensate by switching back to the usual (non-ethanol) energy sources, the deficiency can be overcome by providing some alcohol. This temporarily relieves the deficiency in energy metabolism, and thereby the hangover, as well as providing additional time for metabolic regulation to compensate for lack of ethanol/acetate.
Ethanol exposure Phase 3: Ethanol dependence resulting from heavy alcohol consumption over periods of months and years
Individuals with alcohol dependence consume a substantial fraction of their daily caloric intake as ethanol, typically near 50% of the total calories [5], [25]. This large intake, spread throughout the day and sustained for weeks to months, results significant (mM) levels of ethanol being in the blood most of the time. Diets of individuals with ethanol dependence are often deficient in essential nutrients, including vitamins, minerals, unsaturated fatty acids, and amino acids. In addition, ethanol is only 2 carbons long and can not be used for de novo synthesis of glucose, glutamate and other metabolites critical to long term metabolic homeostasis. In brain, chronic suppression of the oxidation of glucose and other (non-ethanol related) metabolites results in depletion of their associated transporters and enzymes. Conversely, the capacity for metabolism of ethanol and acetate increases [43], [65], [107]. If ethanol consumption ends abruptly, ethanol and acetate levels in the body fall to near zero within a few hours. The oxidizable metabolites used to support energy metabolism in non-ethanol dependent animals have been chronically down regulated and can no longer increase sufficiently to maintain the cellular energy state.
As noted above, for individuals who are ethanol dependent, ethanol normally provides 50% or more of the daily caloric intake. Glucose consumption in brain is substantially decreased by ethanol consumption [107], [108], [110], [112]. Oxidation of one mole of glucose provides slightly more ATP (38 ATP/mole) than does oxidation of two moles of ethanol. Oxidation of alcohol to acetaldehyde by ADH and of acetaldehyde to acetate by ALDH each contributes one NADH for oxidative phosphorylation (6 ATP/ethanol) and oxidation of acetate through the citric acid cycle provides an additional 3 NADH and 1 FADH2 (total of 17 ATP/ethanol, 11 ATP/acetate). Even after correction for the ATP required for acetate activation (acetylCoA synthetase), oxidation of 2 mol of ethanol provides 30 mol of ATP, about 80% of that supplied by oxidation of 1 mol of glucose. Volkow et al. [108] measured brain glucose metabolism in twenty healthy control subjects using positron emission tomography (PET) and fluorodeoxyglucose after administration of placebo or either 0.25 g/kg, or 0.5 g/kg of ethanol over a 40 min period. Both doses of ethanol significantly decreased whole-brain glucose metabolism (10% and 23% respectively). Similar decreases have been reported by other authors, i.e. 26% for 0.75 g/kg [112], 25% for approximately 0.6 g/kg iv [91]. Volkow et al. [107] reported that the response to ethanol is regionally specific; whereas 0.25 g/kg predominantly reduced glucose metabolism in cortical regions, 0.5 g/kg reduced metabolism in cortical as well as subcortical regions (i.e. cerebellum, mesencephalon, basal ganglia and thalamus). As noted earlier, suppression of brain glucose consumption is in response to combination of oxidation of ethanol within the brain and of acetate taken up from the blood [107], [108], [110], [111]. Indeed, in heavy drinkers studied during sobriety, acetate metabolism in the occipital cortex is reported to be increased [43].
Persistent reliance on acetate for energy metabolism of alcoholics during early alcohol detoxification may explain why the decreased brain glucose consumption observed in alcoholics mostly disappears within the first 2 weeks of detoxification [109]. It can be inferred that for cells in brain for which ethanol (and/or acetate) oxidation is responsible for substantial fraction of their ATP production, sudden withdrawal of this important support of energy metabolism results in cellular malfunction and thereby abnormal brain activity. In ethanol dependent mice, withdrawal symptoms correlate with decrease in blood alcohol and acetate, symptoms maximizing as the concentrations approach zero [85]. Derr and coworkers [22], [23], [24] reported that, for ethanol dependent rats, providing acetate during withdrawal significantly alleviated, and providing a mixture of butyrate, lactate, and β-hydroxybutyrate fully suppressed [22],the tremulous portion of their withdrawal symptoms. It did not affect the handling induced convulsions. This is consistent with the tremulous, but not the convulsive, part of the withdrawal symptoms arising from a deficiency in energy metabolism needed to support neuronal activity in the brain.
Neurological responses to ethanol consumption: a prolog
Our paper focuses on metabolism of ethanol and the impact of ethanol consumption on metabolism as a whole. This is an integral and important part of understanding how alcohol influences human biochemistry, physiology, and social behavior. In brain, we focus on effects of ethanol on metabolism of neurons and astrocytes, where changes in energy state directly influences not only all aspects of neurotransmitter function (release, receptor sensitivity, transport, and metabolism) but also induces long term alterations in the underlying cellular machinery (through gene expression, etc). It is recognized, however, that connections between cellular metabolism and neuronal function, and from neural function to behavior, are very complex. Others have made great effort to understand how ethanol alters neuronal function; receptor affinities, ion channel conductance, synaptic connections etc, but many of the particulars remain poorly understood. There is general agreement that ethanol induces substantial changes in neural function but the relative contribution of metabolism and concentration remains under discussion. Due to the complexity of the neurological consequences of ethanol consumption we will address only those we consider to be primarily responses to ethanol and acetate metabolism. There is, for example, an extensive literature on the role of ethanol metabolism and of AMPK activity in modulation of neuronal function (see as examples, [3], [93], [94], [123]). We emphasize the role of energy metabolism and [AMP]f in order to illustrate not just their importance in the response to ethanol but also their central role in coordinating metabolic processes essential to biological existence as we know it.
Neurological responses to ethanol consumption A: Early alterations in the dopaminergic system and potentiation of consumption
Ethanol induces dopamine release and increased activity in the striatum as indicated by functional imaging [91]. Dopaminergic neurons that respond to nutrients, such as glucose, involve metabolism of that nutrient. Increase in nutrient concentration causes an increase in energy state and modulates ion channel (such as the KATP channel) conductance to initiate the dopaminergic signaling cascade. Ethanol, in contrast to other nutrients, has access to neurons behind the blood-brain barrier and this augments the usual nutrient reward circuitry. Dopaminergic projections go to the nucleus accumbens, which has a crucial role in the reward system of human brain. These dopaminergic effects have been attributed to inhibition of GABAergic interneurons of the ventral tegmental area (VTA) by alcohol. Ethanol-induced dopamine release in nucleus accumbens has been reported to be antagonized by administration of an opiate receptor antagonist [34], suggesting inhibition of GABAergic VTA interneurons are at least partly mediated by opioidergic afferents to these neurons. It is reasonable to suggest ethanol induced dopamine release is in response to increased energy state (nutrient sensing) in GABAergic and dopaminergic neurons.
Considerable attention has been paid to acetaldehyde in relation to the dopaminergic response. Inhibition of catalase activity has been reported to prevent ethanol induced dopaminergic signaling in nucleus accumbens [46]. The authors attributed this effect to decrease in acetaldehyde concentration, but inhibiting catalase alters metabolism in many ways, of which acetaldehyde concentration is only one. Follow-up studies have reported that, in rats bred for ethanol preference, administration of a lentiviral vector coding for aldehyde dehydrogenase-2 (ALDH2) into the ventral tegmental area decreased long term ethanol consumption. This decrease was observed, however, only for ethanol naïve rats and not rats that had consumed ethanol on a 24-hour basis for 81 days [46]. Rivera-Meza et al. [86] reported that treating naïve UChB alcohol preferring rats with N-(1,3-benzodioxol-5-ylmethyl)-2,6-dichlorobenzamide, a drug that increased ALDH2 activity in brain by 3 fold, markedly lowered the amount of alcohol they consumed. The authors suggested that activation of ALDH2 in brain decreased acetaldehyde concentrations and this was responsible for inhibiting both acquisition and maintenance of chronic ethanol intake by alcohol-preferring rats. It has also been suggested that acetaldehyde produced from ethanol reacts with dopamine to form salsolinol and that salsolinol is an agonist for μ-opioid receptors, contributing to the reward response to alcohol [10]. There is, however, little evidence for a role for salsolinol in ethanol consumption and metabolism in humans [56], [57] and the contribution of acetaldehyde concentration remains to be established. In humans, expression of inactive aldehyde dehydrogenase 2 (ALDH2) is protective against alcohol use disorders [12], [60]. This decrease in ethanol consumption, however, has been attributed to the unpleasant side effects of systemic increased acetaldehyde. Lack of ALDH2 also suppresses oxidation of acetaldehyde in mitochondria, disrupting ethanol induced increase energy state, particularly in cells with ADH1 and the reward response to ethanol consumption.
Studies in mice by Tabakoff et al. [101] indicated that ethanol tolerance and physical dependence involve different mechanisms. The authors used intraventricular injection of 6-OH dopamine to deplete dopamine and norepinephrine in the brain. Injected prior to chronic ethanol exposure, this prevented development of tolerance to the hypnotic and hypothermic effects of ethanol without significantly affecting development of physical dependence as measured by withdrawal symptoms (convulsions etc). Once tolerance was established, however, 6-OH dopamine injection did not alleviate that tolerance. It is reasonable to conclude that dopaminergic and noradrenergic systems contribute substantially to the positive physiological response to ethanol and to development of alcohol tolerance, but not to alcohol dependence or withdrawal symptoms.
Neurological responses to ethanol consumption B: Early effects on glutamate and GABA metabolism
Chronic ethanol intake in rodents, primates, and humans results in physical dependence and it is widely considered that dependence involves excitatory glutamate and inhibitory GABA neurons. Ethanol oxidation is particularly disruptive of glutamate and GABA metabolism and handling in brain. It is hypothesized that metabolism of astrocytes and neurons is coordinated through glutamate/glutamine cycling [90] and/or lactate transfer [9]. Our version of that metabolic coordination in the absence of ethanol is shown schematically in Fig. 5. Astrocytes have high glycolytic activity and glycogen storage as well as high pyruvate carboxylase activity whereas neurons are oxidative and have high pyruvate dehydrogenase activity. Pyruvate carboxylase in astrocytes is responsible for de novo synthesis of oxaloacetate (and thereby glutamate and glutamine) from pyruvate provided by glycolysis (anaplerosis). Pyruvate carboxylase provides α-ketoglutarate (α-KG) for synthesis of glutamate by aspartate/α-KG aminotransferase. Glutamate is then condensed with ammonia (glutamine synthetase) to form glutamine which is exported and taken up by neurons. In neurons, the glutamine is deaminated (glutaminase) and used as both a neurotransmitter and energy source. In order to be used for ATP production, glutamate is first deaminated by either glutamate/oxalacetate aminotransferase [41] or glutamate dehydrogenase to α-KG which enters the CAC. The CAC, however, does not carry out net oxidation of substrates with chain lengths of 4 or more carbons [50]. α-KG is oxidized to malate in the CAC and malate is exported to the cytoplasm where malic enzyme oxidatively decarboxylates malate to pyruvate. In neurons, pyruvate dehydrogenase is active and pyruvate from either malate or lactate is oxidized to acetylCoA and then to CO2 and water by CAC plus Ox-Phos. Glutamate released at the synapse during neural activity is taken up partly by synaptic glutamate transporters [26], [120] while glutamate that diffuses out of the synapse into the perisynaptic space is taken up by astrocytes. Glutamate consumed for energy metabolism in neurons is replaced by de novo synthesis from pyruvate in astrocytes. Metabolism of ethanol and/or its metabolites inhibits both glucose uptake and glycolytic production of pyruvate through increased energy state (decreased [AMP]f) and increased NADH. Ethanol induced increase in systemic lactate/pyruvate also suppresses intracellular pyruvate concentrations, despite an increase in intracellular lactate through increased monocarboxylate transport. Intracellular pyruvate concentrations are typically below the KM for pyruvate carboxylase (about 400 μM), and decrease would be expected to suppress astrocytic de novo glutamate synthesis. Extracellular glutamate levels in the synapse also decrease due to increase in energy state through its effect on the energy dependence of synaptosomal glutamate transport [26]. The net early effects of ethanol on glutamatergic neural activity include decreased glutamate release in response to the increased energy state in neurons and increased levels of inhibitory neurotransmitter GABA [33]. These contribute to the calming effects of ethanol through suppression of glutamatergic anxiety producing neural activity.
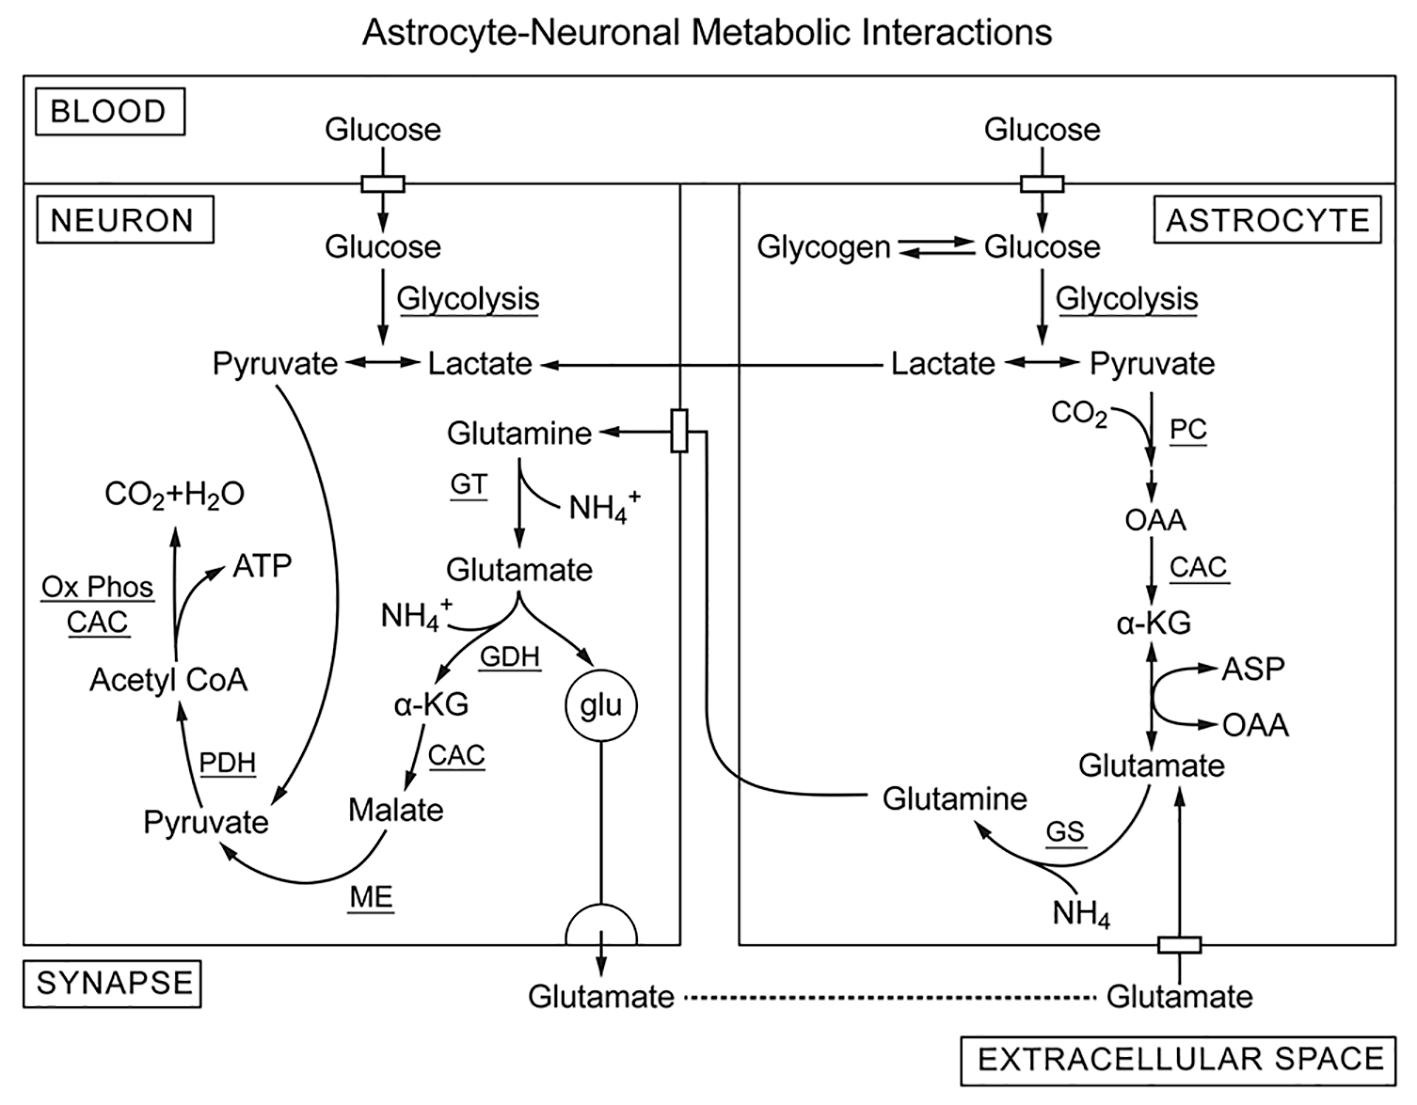
Fig. 5. Our version of the glutamate/glutamine cycle that helps to support glutamatergic neural activity (no ethanol). The astrocytes are primarily glycolytic, using puruvate from glycolysis for de novo synthesis of oxalacetate by pyruvate carboxylase whereas glutamatergic neurons are more oxidative and consume lactate and glutamate for energy metabolism. Pyruvate carboxylase is activated when acetylCoA and the acetylCoA/CoASH ratio are high, conditions for which pyruvate dehydrogenase activity is suppressed. In addition, the CAC does not catalyze net oxidation of intermediates with 4 or more carbon atoms. As a result, astroctes take up glucose and produce pyruvate by glycolysis for net synthesis of oxalacetate. Oxalacetate is converted to citrate and then oxidized to α-ketoglutarate (α-KG) in the CAC. The α-KG is transaminated to form glutamate and then condensed with ammonia glutamine synthetase (GS). Glutamine released from astrocytes is taken up by neurons which reverse this process. Glutamine is deaminated by glutaminase and then oxidatively dehydrogenated to α-KG by glutamate dehydrogenase (GDH). α-KG is oxidized to malate in the CAC and exported to the cytoplasm where it is converted to pyruvate by malic enzyme (ME). In neurons, pyruvate from lactate and glutamate is oxidized by pyruvate dehydrogenase and provides acetylCo-A for energy metabolism. Most of the glutamate released during neural activity is taken up by glutamate transporters in the synapse but some diffuses out to the surrounding perisynaptic space, is taken up by astrocytes and recycled. De novo synthesis of glutamate in astrocytes replaces that used by neurons for energy metabolism, maintaining stable glutamate/glutamine levels in support of glutamatergic neuronal function.
Neurological responses to ethanol consumption: C. Long term alterations in glutamatergic neural system and alcohol withdrawal syndrome
It has been proposed that neurophysiological and pathological effects of ethanol are mediated, to an important extent, by glutamatergic neurons [35], [36], [79], [96], [106]. Biochemical and electrophysiological studies have reported that chronic ethanol treatment increases the number of excitatory N-methyl-D-aspartate (NMDA) receptor-ionophore complexes in hippocampus, a brain area associated with ethanol withdrawal seizure activity [35], [36], [96]. Withdrawal symptoms vary, but in mice removal of ethanol from the diet induces withdrawal-associated tremors and handling-induced seizures [35], [36], [85]. The withdrawal symptoms are reported to correlate with decrease in blood alcohol and acetate levels, with the most severe seizure activity occurring when these concentrations fall to near zero. In mice, the NMDA receptor levels return to control in 24 h and the mice no longer have handling induced seizures. Treatment with NMDA during withdrawal exacerbated handling induced withdrawal seizures, while administration of MK-801, a noncompetitive NMDA receptor antagonist, decreased the occurrence and severity of seizures [35]. Treatment with MK-801 did not, in alcohol dependent mice, suppress the tremors which occur during withdrawal [35], [36]. Thus, following chronic ethanol treatment the glutamate receptors, particularly NMDA receptors, appear to mediate handling induced seizures, but not tremors, associated with ethanol withdrawal. Blocking NMDA receptors by memantine, a moderate affinity but clinically approved NMDA receptor antagonist, has been shown to reduce withdrawal induced-seizures and neurotoxicity in mice [100]. In clinical studies, memantine has been reported to attenuate cue-induced craving for alcohol and withdrawal symptoms associated with alcohol consumption [54], [55].
In rodents, exposure to alcohol has been reported to induce a significant increase in the expression and synaptic localization of α-amino-3-hydroxy-5-methyl-4-isoxazolepropionic acid receptors (AMPA receptors) in brain regions with reward circuitry [15], [17]. AMPA receptors are ionotropic transmembrane receptors for glutamate that mediate fast synaptic transmission in the CNS. Infusion of an AMPA receptor inhibitor into the dorsomedial striatum exhibited promising results in reducing alcohol consumption in rats [113] and an AMPA/kainate receptor antagonist, topiramate, is reported to suppress withdrawal symptoms in humans [55]. Another drug, acamprosate, known to affect two neurotransmitter systems, GABA (as an agonist) and glutamate (as an NMDA receptor agonist and mGluR5 antagonist), has been reported to be effective in increasing complete abstinence rate as well as cumulative abstinence duration in several long-term placebo-controlled trials in alcohol-dependent patients [59], [80], [88]. In a large clinical trial involving 1383 patients in nine possible treatment groups, however, acamprosate neither alone nor with naltrexone or combined behavioral intervention showed statistically significant reduction in alcohol consumption over placebo [4]. Despite the inconsistencies in findings, overall advantageous pharmacological effects of acamprosate on alcohol consumption are such that it is approved for treatment of alcohol use disorders in Europe and USA.
Understanding how glutamate signaling may contribute to addiction needs to account for multiple pools of intra- and extra-cellular glutamate. Glutamate concentrations within glutamatergic synapses are determined by balance of vesicular release and energy dependent glutamate reuptake whereas that in the perisynaptic space is determined by diffusion from the synapse and extrasynaptic release/uptake [28], [104]. Perisynaptic glutamate regulates neurotransmission by stimulating group II glutamate receptors (mGluRs) in the presynaptic area [7], [121]. These are presynaptic receptors capable of inhibiting vesicular release [8], [18], [89]. Thus, presynaptic receptors permit cross talk between the two pools and altered nonvesicular glutamate release may contribute to pathological glutamate signaling linked to addiction [110]. As indicated above, under normal physiological conditions, plasma acetate concentration is low but with ethanol ingestion it rapidly increases to about 1 mM. Acetate is readily taken up and metabolized by brain [20], [81], [114], largely by astrocytes. Calculated rates of utilization of acetate from the blood were reported to be 15–25% of total glucose consumption in non-stimulated tissue and to range from 28 to 115% of estimated rates of glucose oxidation in astrocytes [20], [114]. During intoxication, blood acetate concentrations are higher for alcoholics than for controls [78]. This would facilitate metabolism of acetate by glial cells, as shown for laboratory animals chronically exposed to alcohol [107], [111].
Madayag and coworkers [68] reported that repeated N-acetylcysteine administration alters plasticity-dependent effects of cocaine. The authors provided evidence that the ability of N-acetylcysteine to regulate drug-seeking behavior results from actions on cystine-glutamate exchanger (system xc−) and is associated with suppression of the large release of glutamate that occurs in accumbens during drug seeking. In vitro measurements have been reported to show that cystine induced activation of cystine/glutamate exchange system xc− results in release of glial glutamate and stimulation of mGlu2 receptors [45]. This inhibits neuronal glutamate release. In cocaine addiction, decrease in reinstated cocaine seeking elicited by activating xc− with N-acetylcysteine is prevented by pretreatment with an mGlu2/3 antagonist [58]. Pharmacological treatment with N-acetylcysteine is reported to modulate responses to stress and depressive-like behaviors by increasing xc− expression and to indirectly activate mGlu2 receptors [76]. The fact that pharmacological blockade of the xc− system also blocked N-acetylcysteine effects on mGlu2 receptors further supports linkage of mGlu2 regulation in promoting resilience to stress. A consistent biomarker of mood-related behaviors associated with electrophysiological changes in the dentate gyrus is reduction in the mGlu2 receptors that regulate vesicular release of glutamate at synapses [77].
Ethanol metabolism and associated alcohol withdrawal syndrome: a synopsis
Ethanol, through its role as a major but essentially unregulated metabolite for energy metabolism, causes a truly metabolic disease. An initial positive sense of well being is induced by “pushing” energy metabolism and increasing energy state to above its homeostatic set point. The positive sense of well being is part of the neurological signaling system that has evolved to guide adaptation to the environment. Positive reward feelings associated with adequate food, warmth etc. are enhanced and negative feelings associated with hunger, anxiety, etc are suppressed. This leads to a euphoric state with an enhanced sense of being well fed and unstressed. Short exposures are reversible and cause little long term injury, but as ethanol exposure continues there is progressive disruption of critical regulatory mechanisms that maintain metabolic homeostasis. The extent of disruption is dependent on individual tissues and their metabolic requirements with many other contributing parameters (including genetic differences, diet, etc). A key aspect of ethanol metabolism appears to be the decrease in [AMP]f and attendant decrease in AMPK activity. Both chronic decrease in AMPK activity and alcohol dependence are reported to cause decreased activity of oxidative phosphorylation, abnormally shaped mitochondria and other cellular morphological and enzymatic changes [14], [102]. In addition to the debilitating effects of prolonged ethanol consumption, it is necessary to deal with alcohol withdrawal syndrome. As described earlier, this is a complex response to stopping ethanol consumption and correlates with disappearance of ethanol and its metabolic products from the body. The symptoms can be severe and life threatening but do not arise from a single cause. Due to the multiplicity in causes, a single drug is unlikely to fully alleviate the withdrawal symptoms. Effective treatment is likely to require simultaneous treatment of multiple causes. Identifiable primary metabolic contributions to alcohol withdrawal symptoms and treatments that should substantially suppress the symptoms include:
1). Correct the energy deficiency in specific brain cells (neurons and astrocytes). Derr and coworkers [22] reported this can be addressed by providing a metabolite “cocktail” (butyrate, lactate, and β-hydroxybutyrate) for energy metabolism and anaplerotic support of the citric acid cycle. Derr and Derr [23] quantified the tremulous and rigidity symptoms of alcohol withdrawal in rats and concluded that feeding β-hydroxybutyrate suppressed the tremulous, but not the rigidity, symptoms. Other suitable nutrients include branched chain amino acids and branched short chain fatty acids, as these also rapidly cross the blood-brain barrier. Importantly, each can provide both acetylCoA for oxidative metabolism and pyruvate for anaplerotic synthesis of glutamate. Given the importance of carnitine in acetate metabolism, supplementing with carnitine and/or acetyl-L-carnitine may also be helpful [71].
2A). Stabilize glutamate distribution and metabolism in the brain. Treatment with N-acetylcysteine has been reported to modulate responses to stress and depressive-like behaviors in several ways. These include increasing expression of glutamate-cystine antiporter (system xc−), increasing the concentrations of cysteine and cystine, and indirectly by activating mGlu2 receptors [2], [76]. This helps to rebalance glutamate homeostasis and glutamatergic neuronal/astrocyte interactions.
2B). Pharmacological compensation for increased sensitivity of the glutamatergic neural system. As noted above, chronic ethanol consumption induced suppression of glutamatergic activity results in increase in excitatory (NMDA, AMPA) and decrease in inhibitory (mGluR) glutamate receptors. The contribution of enhanced glutamatergic sensitivity and neurotoxicity of excessive NMDA receptor activity to ethanol withdrawal symptoms can be suppressed by antagonists for excitatory glutamate receptors. Among the glutamate receptor antagonists currently clinically approved or in trials are acamprosate, memantine, and MK-801. Suppression of glutamatergic sensitivity through the critical withdrawal period has been reported to decrease the severity of symptoms [55]. Once energy and glutamate metabolism have normalized, receptor numbers should return to near normal.
Alcohol dependence is not just a metabolic disease, and there are substantial genetic, psychological, and social contributions. Identifying and characterizing the metabolic consequences of ethanol ingestion and of alcohol dependence is important to understanding the disease and how to more effectively treat alcohol dependence. This is, however, just one piece of a complex medical and social problem.
Conflict of interest statement
Neither DFW nor FMM have any financial and personal relationships that could influence the work presented in this manuscript.
Acknowledgement
The authors are indebted to Dr. Joseph J. Higgins for insightful and memorable discussions concerning ethanol metabolism and its regulation.
References
- [1]
- R.A. Alberty
Thermodynamics of reactions of nicotinamide adenine dinucleotide and nicotinamide adenine dinucleotide phosphate
Arch Biochem Biophys, 307 (1) (1993), pp. 8-14
- [2]
- P. Albrecht, J. Lewerenz, S. Dittmer, R. Noack, P. Maher, A. Methner
Mechanisms of oxidative glutamate toxicity: the glutamate/cystine antiporter system xc- as a neuroprotective drug target
CNS Neurol Disord: Drug Targets, 9 (3) (2010), pp. 373-382
- [3]
- A.L. Alhadeff, N. Goldstein, O. Park, M.L. Klima, A. Vargas, J.N. Betley
Natural and drug rewards engage distinct pathways that converge on coordinated hypothalamic and reward circuits
Neuron, 103 (2019), pp. 891-908
- [4]
- R.F. Anton, S.S. O'Malley, D.A. Ciraulo, R.A. Cisler, D. Couper, D.M. Donovan, et al.
Combined pharmacotherapies and behavioral interventions for alcohol dependence: the COMBINE study: a randomized controlled trial
JAMA, 295 (17) (2006), pp. 2003-2017
- [5]
- P. Bach, E. Zois, S. Vollstädt-Klein, M. Kirsch, S. Hoffmann, A. Jorde, et al.
Association of the alcohol dehydrogenase gene polymorphism rs1789891 with gray matter brain volume, alcohol consumption, alcohol craving and relapse risk
Addict Biol, 24 (2017), pp. 110-120
- [6]
- C.-I. Bäcklin
The equilibrium constant of the system ethanol, aldehyde, DPN, DPNH and H+
Acta Chem Scand, 12 (1958), pp. 1279-1285
- [7]
- D.A. Baker, A. Madayag, L.V. Kristiansen, J.H. Meador-Woodruff, V. Haroutunian, I. Raju
Contribution of cystine-glutamate antiporters to the psychotomimetic effects of phencyclidine
Neuropsychopharm, 33 (7) (2008), pp. 1760-1772, 10.1038/sj.npp.1301532
- [8]
- A. Baskys, R.C. Malenka
Agonists at metabotropic glutamate receptors presynaptically inhibit EPSCs in neonatal rat hippocampus
J Physiol, 444 (1991), pp. 687-701
- [9]
- M. Bèlanger, I. Allaman, P.J. Magistretti
Brain energy metabolism: Focus on astrocyte-neuron metabolic cooperation
Cell Metab, 14 (2011), pp. 724-738
- [10]
- P. Berríos-Cárcamo, M.E. Quintanilla, M. Herrera-Marschitz, V. Vasiliou, G. Zapata-Torres, M. Rivera-Meza
Racemic salsolinol and its enantiomers act as agonists of the m-opioid receptor by activating the Gi protein-adenylate cyclase pathway
Front Behav Neurosci, 10 (2016), p. 253, 10.3389/fnbeh.2016.00253
- [11]
- L.A. Bertocci, J.G. Jones, C.R. Malloy, R.G. Victor, G.D. Thomas
Oxidation of lactate and acetate in rat skeletal muscle: analysis by 13C nuclear magnetic resonance spectroscopy
J Appl Physiol, 83 (1) (1997), pp. 32-39
- [12]
- W.F. Bosron, T. Ehrig, T.K. Li
Genetic factors in alcohol metabolism and alcoholism
Semin Liver Dis, 13 (1993), pp. 126-135
PMID: 8337601
- [13]
- R. Bűhler, D. Pestalozzi, M. Hess, J.-P. von Wartburg
Immunohistochemical localization of alcohol dehydrogenase in human kidney, endocrine organs, and brain
Pharmacol Biochem Behav, 18 (Suppl 1) (1983), pp. 55-59
- [14]
- A.L. Bujak, J.D. Crane, J.S. Lally, R.J. Ford, S.J. Kang, I.A. Rebalka, et al.
AMPK activation of muscle autophagy prevents fasting induced hypoglycemia and myopathy during aging
Cell Metab, 21 (2015), pp. 883-890
- [15]
- L.J. Chandler, D. Norwood, G. Sutton
Chronic ethanol upregulates NMDA and AMPA, but not kainate receptor subunit proteins in rat primary cortical cultures
Alcohol Clin Exp Res, 23 (2) (1999), pp. 363-370
- [16]
- I.-Y. Chen, F.-R. Wang, X.-L. Sun, J. Zhou, L. Gao, Y.-L. Jiao, et al.
Chronic ethanol feeding impairs AMPK and MEF2 expression and is associated with GLUT4 decrease in rat myocardium
Expt Mol Med, 42 (3) (2010), pp. 205-215
- [17]
- D.T. Christian, N.J. Alexander, M.R. Diaz, S. Robinson, B.A. McCool
Chronic intermittent ethanol and withdrawal differentially modulate basolateral amygdala AMPA-type glutamate receptor function and trafficking
Neuropharm, 62 (7) (2012), pp. 2429-2438, 10.1016/j.neuropharm.2012.02.017
- [18]
- A.J. Cochilla, A.S. Simon
Metabotropic glutamate receptor-mediated control of neurotransmitter release
Neuron, 20 (1998), pp. 1007-1016
- [19]
- D.W. Crabb, S. Liangpunsakul
Alcohol and lipid metabolism
J Gastroenterol Hepatol, 3 (2006), pp. S56-S60
- [20]
- N.F. Cruz, A. Lasater, H.R. Zielke, G.A. Dienel
Activation of astrocytes in brain of conscious rats during acoustic stimulation: acetate utilization in working brain
J Neurochem, 92 (2005), pp. 934-947
- [21]
- D.K. Deelchand, A.A. Shestov, D.M. Koski, K. Uğurbil, P.-G. Henry
Acetate transport and utilization in the rat brain
J Neurochem, 109 (Suppl 1) (2009), pp. 46-54, 10.1111/j.1471-4159.2009.05895.x
- [22]
- R.F. Derr
The ethanol withdrawal syndrome: a consequence of lack of substrate for a cerebral Krebs-cycle
J Theor Biol, 106 (1984), pp. 375-381
- [23]
- R.F. Derr, M.I. Derr
Separation of the tremorous and muscular rigidity components of the ethanol withdrawal syndrome in the rat
Physiol Behav, 38 (1986), pp. 1-3
- [24]
- R.F. Derr, K. Draves, M. Derr
Abatement by acetate of an ethanol withdrawal syndrome
Life Sci, 29 (1981), pp. 1787-1790
- [25]
- A. Dettling, F. Fischer, S. Böhler, F. Ulrich, G. Skopp, M. Graw, et al.
Ethanol elimination rates in men and women in consideration of the calculated liver weight
Alcohol, 41 (2007), pp. 415-420
- [26]
- M. Erecińska, D. Wontorsky, D.F. Wilson
Aspartate transport in synaptosomes from rat brain
J Biol Chem, 258 (1983), pp. 9069-9077
- [27]
- J. Farrès, A. Moreno, B. Crosas, J.M. Peralba, A. Allali-Hassani, L. Hjelmqvist, et al.
Alcohol dehydrogenase of class IV (ss-ADH) from human stomach. cDNA sequence and structure/function relationships
Eur J Biochem, 224 (1994), pp. 549-557
- [28]
- D.E. Featherstone
Intercellular glutamate signaling in the nervous system and beyond
ACS Chem Neurosci, 1 (2010), pp. 4-12, 10.1021/cn900006n
- [29]
- O.A. Forsander
Influence of the metabolism of ethanol on the lactate/pyruvate ratio of rat-liver slices
Biochem J, 98 (1966), pp. 244-247
- [30]
- D.W. Foster
Malonyl-CoA: the regulator of fatty acid synthesis and oxidation
J Clin Invest, 122 (6) (2012), pp. 1958-1959, 10.1172/JCI63967
- [31]
- Gary Frost, Michelle L. Sleeth, Meliz Sahuri-Arisoylu, Blanca Lizarbe, Sebastian Cerdan, Leigh Brody, Jelena Anastasovska, Samar Ghourab, Mohammed Hankir, Shuai Zhang, David Carling, Jonathan R. Swann, Glenn Gibson, Alexander Viardot, Douglas Morrison, E.L. Thomas, Jimmy D. Bell
The short-chain fatty acid acetate reduces appetite via a central homeostatic mechanism
Nat Commun, 5 (1) (2014), 10.1038/ncomms4611
- [32]
- A. Galli, D. Price, D. Crabb
High-level expression of rat class I alcohol dehydrogenase is sufficient for ethanol-induced fat accumulation in transduced HeLa cells
Hepatology, 29 (1999), pp. 1164-1170
- [33]
- G.L. Gessa, R. Agabio, M.A.M. Carai, C. Lobina, M. Pani, R. Reali, et al.
Mechanism of the antialcohol effect of gamma-hydroxybutyric acid
Alcohol, 20 (2000), pp. 271-276
- [34]
- R.A. Gonzales, F. Weiss
Suppression of ethanol-reinforced behavior by naltrexone is associated with attenuation of the ethanol-induced increase in dialysate dopamine levels in the nucleus accumbens
J Neurosci, 18 (24) (1998), pp. 10663-10671
- [35]
- K.A. Grant, P. Valverius, M. Hudspith, B. Tabakoff
Ethanol withdrawal seizures and the NMDA receptor complex
Eur J Phamacol, 176 (1990), pp. 289-296
- [36]
- K. Gulya, K.A. Grant, P. Valverius, P.L. Hoffman, B. Tabakoff
Brain regional specificity and time course of changes in the NMDA receptor-ionophore complex during ethanol withdrawal
Brain Res, 547 (1991), pp. 129-134
- [37]
- R.K. Handa, M.R. DeJoseph, L.D. Singh, R.A. Hawkins, S.P. Singh
Glucose transporters and glucose utilization in rat brain after acute ethanol administration
Metab Brain Dis, 15 (2000), pp. 211-222
- [38]
- D.G. Hardie
Keeping the home fires burning: AMP-activated protein kinase
J R Soc Interface, 15 (2018), p. 20170774, 10.1098/rsif.2017.0774
- [39]
- D.G. Hardie, B.E. Schaffer, A. Brunet
AMPK: an energy-sensing pathway with multiple inputs and outputs
Trends Cell Biol, 26 (2016), pp. 190-201, 10.1016/j.tcb.2015.10.013
- [40]
- I.E. Hassinen, M.A. Härkönen, R.H. Ylikahri
Metabolic effects of acetaldehyde in the intact rat brain cortex and its subcellular fractions
Brain Res, 70 (1974), pp. 301-312
- [41]
- L. Hertz, D.L. Rothman
Glutamine-glutamate cycle flux is similar in cultured astrocytes and brain and both glutamate production and oxidation are mainly catalyzed by aspartate aminotransferase
Biology, 6 (17) (2017), pp. 1-21, 10.3390/biology6010017
- [42]
- S. Herzig, R.J. Shaw
AMPK: guardian of metabolism and mitochondrial homeostasis
Nat Rev Mol Cell Biol, 19 (2) (2018), pp. 121-135, 10.1038/nrm.2017.95
- [43]
- L. Jiang, B.I. Gulanski, H.M. De Feyter, S.A. Weinzimer, B. Pittman, E. Guidone, et al.
Increased brain uptake and oxidation of acetate in heavy drinkers
J Clin Invest, 123 (4) (2013), pp. 1605-1614, 10.1172/JCI65153
- [44]
- A. Juhlin-Dannfelt
Ethanol effects of substrate utilization by the human brain
Scand J Clin Lab Invest, 37 (5) (1977), pp. 443-449
ISSN: 0036-5513, 0036-5513
- [45]
- P.W. Kalivas
The glutamate homeostasis hypothesis of addiction
Nat Rev Neurosci, 10 (2009), pp. 561-572
- [46]
- E. Karahanian, M. Rivera-Meza, L. Tampier, M.E. Quintanilla, M. Herrera-Marschitz, Y. Israel
Long-term inhibition of ethanol intake by the administration of an aldehyde dehydrogenase-2 (ALDH2)-coding lentiviral vector into the ventral tegmental area of rats
Addict Biol, 20 (2015), pp. 336-344, 10.1111/adb.12130
- [47]
- J.T. Kerr, D.S. Maxwell, D.W. Crabb
Immunocytochemistry of alcohol dehydrogenase in the rat central nervous system
Alcoholisn: Clin Exptl Res, 13 (6) (1989), pp. 730-736
- [48]
- K. Kiviluoma, I. Hassinen
Role of acetaldehyde and acetate in the development of ethanol-induced cardiac lipidosis, studied in isolated perfused rat hearts
Alcoholism: Clin Exptl Res, 1 (2) (1982), pp. 169-175
- [49]
- R. Kjøbsted, J.R. Hingst, J. Fentz, M. Foretz, M.-N. Sanz, C. Pehmøller, et al.
AMPK in skeletal muscle function and metabolism
FASEB J, 32 (2018), pp. 1741-1777, 10.1096/fj.201700442R
- [50]
- H.A. Krebs
The citric acid cycle
Nobel Lecture (1953)
- [51]
- H.A. Krebs
The Croonian lecture. Gluconeogenesis
Proc R Soc Lond B, 159 (1964), pp. 545-564, 10.1098/rspb.1964.0019)
- [52]
- H.A. Krebs, R.A. Freedland, M. Stubbs
Inhibition of hepatic gluconeogenesis by ethanol
Biochem J, 112 (1969), pp. 117-124
- [53]
- R.A. Kreisberg, W.C. Owen, A.M. Siegal
Ethanol-induced hyperlacticacidemia: inhibition of lactate utilization
J Clin Invest, 50 (1971), pp. 166-174
- [54]
- E.M. Krupitsky, O. Neznanova, D. Masalov, A.M. Burakov, T. Didenko, T. Romanova, et al.
Effect of Memantine on cue-induced alcohol craving in recovering alcohol-dependent patients
Am J Psychiatry, 164 (3) (2007), pp. 519-523
- [55]
- E.M. Krupitsky, A.A. Rudenko, A.M. Burakov, T.Y. Slavina, A.A. Grinenko, B. Pittman, et al.
Antiglutamatergic strategies for ethanol detoxification: comparison with placebo and diazepam
Alcohol Clin Exp Res, 31 (2007), pp. 604-611
[PubMed: 17374039]
- [56]
- M. Kurnik-Łucka, P. Panula, A. Bugajski, K. Gil
Salsolinol: an unintelligible and double-faced molecule—lessons learned from in vivo and in vitro experiments
Neurotox Res, 33 (2018), pp. 485-514, 10.1007/s12640-017-9818-6
- [57]
- J. Lee, V.A. Ramchandani, K. Hamazaki, E.A. Engleman, W.J. McBride, T.K. Li, et al.
A critical evaluation of influence of ethanol and diet on salsolinol enantiomers in humans and rats
Alcohol Clin Exp Res, 34 (2010), pp. 242-250
- [58]
- J. Lewerenz, S.J. Hewett, Y. Huang, M. Lambros, P.W. Gout, P.W. Kalivas, et al.
The cystine/glutamate antiporter system Xc- in health and disease: from molecular mechanisms to novel therapeutic opportunities
Antiox Redox Signal, 18 (2013), pp. 522-555
- [59]
- J.P. Lhuintre, N. Moore, G. Tran, L. Steru, S. Langrenon, M. Daoqust, et al.
Acamprosate appears to decrease alcohol intake in weaned alcoholics
Alcohol Alcohol, 25 (6) (1990), pp. 613-622
- [60]
- D. Li, H. Zhao, J. Gelernter
Strong association of the alcohol dehydrogenase 1B gene (ADH1B) with alcohol dependence and alcohol-induced medical diseases
Biol Psychiatry, 70 (6) (2011), pp. 504-512, 10.1016/j.biopsych.2011.02.024
- [61]
- S. Liangpunsakul, S.-E. Wou, Y. Zeng, R.A. Ross, H.N. Jayaram, D.W. Crabb
Effect of ethanol on hydrogen peroxide-induced AMPK phosphorylation
Am J Physiol Gastrointest Liver Physiol, 295 (6) (2008), pp. G1173-G1181
- [62]
- C.S. Lieber
Relationships between nutrition, alcohol use, and liver disease
Alcohol Res Health, 27 (3) (2003), pp. 220-231
- [63]
- C.S. Lieber, L.M. DeCarli
An experimental model of alcohol feeding and liver injury in the baboon
J Med Primatol, 3 (1974), pp. 153-163
- [64]
- C.S. Lieber, D.P. Jones, L.M. Decarli
Effects of prolonged ethanol intake: production of fatty liver despite adequate diets
J Clin Invest, 44 (1965), pp. 1009-1021
- [65]
- D. Lindberg, A.M.C. Ho, L. Peyton, D.-S. Choi
Chronic ethanol exposure disrupts lactate and glucose homeostasis and induces dysfunction of the astrocyte-neuron lactate shuttle in the brain
Alcoholism: Clin Exp Res, 43 (9) (2019), pp. 1838-1847
- [66]
- C. Loguercio, Blanco F Del Vecchio, V. De Girolamo, D. Disalvo, G. Nardi, A. Parente, et al.
Ethanol consumption, amino acid and glutathione blood levels in patients with and without chronic liver disease
Alcohol Clin Exp Res, 23 (11) (1999), pp. 1780-1784
- [67]
- F. Lundquist, N. Tygstrup, K. Winkler, K. Mellemgaard, S. Munck-Petersen
Ethanol metabolism and production of free acetate in the human liver
J Clin Invest, 41 (5) (1962), pp. 955-961
- [68]
- A. Madayag, D. Lobner, K.S. Kau, J.R. Mantsch, O. Abdulhameed, M. Hearing, et al.
Repeated N-acetylcysteine administration alters plasticity-dependent effects of cocaine
J Neurosci, 27 (2007), pp. 13968-13976
- [69]
- S. Mandayam, M.M. Jamal, T.R. Morgan
Epidemiology of alcoholic liver disease
Semin Liver Dis, 24 (2004), pp. 217-232
- [70]
- S.E. Martínez, J. Vaglenova, J. Sabriá, M.C. Martínez, J. Farrès, X. Parès
Distribution of alcohol dehydrogenase mRNA in the rat central nervous system: Consequences for brain ethanol and retinoid metabolism
Eur J Biochem, 268 (2001), pp. 5045-5056
- [71]
- G. Martinotti, D. Reina, M. Di Nicola, S. Andreoli, D. Tedeschi, I. Ortolani, et al.
Acetyl-L-carnitine for alcohol craving and relapse prevention in anhedonic alcoholics: a randomized, double-blind, placebo-controlled pilot trial
Alcohol Alcohol, 45 (5) (2010), pp. 449-455
- [72]
- F.M. Matschinsky, D.F. Wilson
The central role of glucokinase in glucose homeostasis: a perspective 50 years after demonstrating the presence of the enzyme in islets of Langerhans
Frontiers Physiol, 10 (148) (2019), p. 2019, 10.3389/fphys.2019.00148. eCollection
- [73]
- J.D. McGarry, G.F. Leatherman, W. Daniel, D.W. Foster
Carnitine palmitoyltransferase 1: The site of inhibition of hepatic fatty acid oxidation by malonyl-CoA
J Biol Chem, 253 (12) (1978), pp. 4128-4136
- [74]
- P. Mews, G. Egervari, R. Nativio, S. Sidoli, G. Donahue, S.I. Lombroso, et al.
Alcohol metabolism contributes to brain histone acetylation
Nature, 574 (2019), pp. 717-721
- [75]
- P.M.A. Muneer, S. Alikunju, A.M. Szlachetka, J. Haorah
Inhibitory effects of alcohol on glucose transport across the blood–brain barrier leads to neurodegeneration: preventive role of acetyl-L-carnitine
Psychopharmacology, 214 (2011), pp. 707-718
- [76]
- C. Nasca, B. Bigio, D. Zelli, P. de Angelis, T. Lau, M. Okamoto, et al.
Role of the astroglial glutamate exchanger xCT in ventral hippocampus in resilience to stress
Neuron, 96 (2017), pp. 402-413
- [77]
- C. Nasca, D. Zelli, B. Bigio, S. Piccinin, S. Scaccianoce, R. Nisticó, et al.
Stress dynamically regulates behavior and glutamatergic gene expression in hippocampus by opening a window of epigenetic plasticity
PNAS, 112 (2015), pp. 14960-14965
- [78]
- H. Nuutinen, K. Lindros, P. Hekali, M. Salaspuro
Elevated blood acetate as indicator of fast ethanol elimination in chronic alcoholics
Alcohol, 2 (1985), pp. 623-626
- [79]
- M.F. Olive, R.M. Cleva, P.W. Kalivas, R.J. Malcolm
Glutamatergic medications for the treatment of drug and behavioral addictions
Pharmacol Biochem Behav, 100 (4) (2012), pp. 801-810, 10.1016/j.pbb.2011.04.015
- [80]
- F.M. Paille, J.D. Guelfi, A.C. Perkins, R.J. Royer, L. Steru, P. Parot
Double-blind randomized multicentre trial of acamprosate in maintaining abstinence from alcohol
Alcohol Alcohol, 30 (2) (1995), pp. 239-247
- [81]
- A.B. Patel, R.A. de Graaf, D.L. Rothman, K.L. Behar, G.F. Mason
Evaluation of cerebral acetate transport and metabolic rates in the rat brain in vivo using 1 H-[13C]-NMR
J Cerebral Blood Flow Metab, 30 (2010), pp. 1200-1213
- [82]
- C.T. Putman, L.L. Spriet, E. Hultman, D.J. Dyck, G.J. Heigenhauser
Skeletal muscle pyruvate dehydrogenase activity during acetate infusion in humans
Am J Physiol, 268 (1995), pp. E1007-E1017
- [83]
- M.E. Quintanilla, Y. Israel, A. Sapag, L. Tampier
The UChA and UChB rat lines: metabolic and genetic differences influencing ethanol intake
Addict Biol, 11 (2006), pp. 310-323, 10.1111/j.1369-1600.2006.00030.x
- [84]
- N.H. Raskin, L. Sokoloff
Alcohol dehydrogenase activity in rat brain and liver
J Neurochem, 17 (1970), pp. 1677-1687
- [85]
- R.F. Ritzmann, B. Tabakoff
Body temperature in mice: a quantitative measure of alcohol tolerance and physical dependence
J Pharmacol Exp Ther, 199 (1976), pp. 158-170
- [86]
- M. Rivera-Meza, D. Vásquez, M.E. Quintanilla, D. Lagos, B. Rojas, M. Herrera-Marschitz, et al.
Activation of mitochondrial aldehyde dehydrogenase (ALDH2) by ALDA-1 reduces both the acquisition and maintenance of ethanol intake in rats: A dual mechanism?
Neuropharm, 146 (2019), pp. 175-183
- [87]
- B.D. Rowlands, M. Klugmann, C.D. Rae
Acetate metabolism does not reflect astrocytic activity, contributes directly to GABA synthesis, and is increased by silent information regulator 1 activation
J Neurochem, 140 (6) (2017), pp. 903-918, 10.1111/jnc.13916
Epub 2017 Jan 23
- [88]
- H. Sass, M. Soyka, K. Mann, W. Zieglgänsberger
Relapse prevention by acamprosate. Results from a placebo-controlled study on alcohol dependence
Arch Gen Psychiatry, 53 (8) (1996), pp. 673-680
- [89]
- D.D. Schoepp
Unveiling the functions of presynaptic metabotropic glutamate receptors in the central nervous system
J Pharm Exptl Ther, 299 (2001), pp. 12-20
- [90]
- A. Schousboe, S. Scafidi, L.K. Bak, H.S. Waagepetersen, M.C. McKenna
Glutamate metabolism in the brain focusing on astrocytes
Adv Neurobiol, 11 (2014), pp. 13-30, 10.1007/978-3-319-08894-5_2
- [91]
- M. Schreckenberger, R. Amberg, A. Scheurich, M. Lochmann, W. Tichy, A. Klega, et al.
Acute alcohol effects on neuronal and attentional processing: striatal reward system and inhibitory sensory interactions under acute ethanol challenge
Neuropsychopharmacology, 29 (2004), pp. 1527-1537
- [92]
- M.C. Scrutton, M.F. Utter
Pyruvate carboxylase III. Some physical and chemical properties of the highly purified enzyme
J Biol Chem, 240 (1) (1965), pp. 1-9
- [93]
- K.-Z. Shen, Y.-N. Wu, A.C. Munhall, S.W. Johnson
AMP Kinase regulates ligand-gated K-ATP channels in substantia nigra dopamine neurons
Neuroscience, 330 (2016), pp. 219-228
- [94]
- K.-Z. Shen, V. Yakhnitsa, A.C. Munhall, S.W. Johnson
AMP kinase regulates K-ATP currents evoked by NMDA receptor stimulation in rat subthalamic nucleus neurons
Neuroscience, 274 (2014), pp. 138-152, 10.1016/j.neuroscience.2014.05.031
- [95]
- G.I. Smith, A.E. Jeukendrup, D. Ball
Sodium acetate induces a metabolic alkalosis but not the increase in fatty acid oxidation observed following bicarbonate ingestion in humans
J Nutr, 137 (2007), pp. 1750-1756
- [96]
- L.D. Snell, B. Tabakoff, P.L. Hoffman
Radioligand binding to the N-methyl-D-aspartate receptor/ionophore complex: alterations by ethanol in vitro and by chronic in vivo ethanol ingestion
Brain Res, 602 (1993), pp. 91-98
- [97]
- K. Souda, T. Kawasaki, T. Yoshimi
Effects of acute and chronic ethanol administration on hepatic hemodynamics and hepatic oxygen consumption in awake rats
J Hepatology, 24 (1996), pp. 101-108
ArticleDownload PDFCrossRefView Record in ScopusGoogle Scholar
- [98]
- M.P. Srinivasan, K.K. Bhopale, S.M. Amer, J. Wan, L. Kaphalia, G.S. Ansari, et al.
Linking Dysregulated AMPK signaling and ER stress in ethanol-induced liver injury in hepatic alcohol dehydrogenase deficient deer mice
Biomolecules, 9 (560) (2019), pp. 1-17, 10.3390/biom9100560
- [99]
- J.W. Starnes, D.F. Wilson, M. Erecinska
Substrate dependence of metabolic state and coronary flow in perfused rat heart
Am J Physiol, 249 (1985), pp. H799-H806
- [100]
- T.D. Stepanyan, J.M. Farook, A. Kowalski, E. Kaplan, S. Barron, J.M. Littleton
Alcohol withdrawal-induced hippocampal neurotoxicity in vitro and seizures in vivo are both reduced by memantine
Alcoholism: Clin Exptl Res, 32 (2008), pp. 2128-2135
- [101]
- B. Tabakoff, R.F. Ritzmann
The effects of 6-hydroxydopamine on tolerance to and dependence on ethanol
J Pharmacol Exp Ther, 203 (1977), pp. 319-331
- [102]
- M.R. Teli, C.P. Day, A.D. Burt, M.K. Bennett, O.F.W. James
Determinants of progression to cirrhosis or fibrosis in pure alcoholic fatty liver
Lancet, 346 (1995), pp. 987-990
- [103]
- R.G. Thurman, H.G. Ley, R. Scholz
Hepatic microsomal ethanol oxidation. Hydrogen peroxide formation and the role of catalase. Euro
J Biochem, 25 (3) (1972), pp. 420-430
[PubMed: 4402915]
- [104]
- W. Timmerman, B.H. Westerink
Brain microdialysis of GABA and glutamate: what does it signify?
Synapse, 27 (3) (1997), pp. 242-261
- [105]
- K. Tomita, G. Tamiya, S. Ando, N. Kitamura, H. Koizumi, S. Kato, et al.
AICAR, an AMPK activator, has protective effects on alcohol-induced fatty liver in rats
Alcohol Clin Exp Res, 29 (12) (2005), pp. 240S-245S
- [106]
- G.E. Tsai, P. Ragan, R. Chang, S. Chen, V.M.I. Linnoila, J.T. Coyle
Increased glutamatergic neurotransmission and oxidative stress after alcohol withdrawal
Am J Psychiatry, 155 (1998), pp. 726-732
- [107]
- N.D. Volkow, S.W. Kim, G.-J. Wang, D. Alexoff, J. Logan, L. Muench, et al.
Acute alcohol intoxication decreases glucose metabolism but increases acetate uptake in the human brain
NeuroImage, 64 (2013), pp. 277-283
- [108]
- N.D. Volkow, G.-J. Wang, D. Franceschi, J.S. Fowler, P.K. Thanos, L. Maynard, et al.
Low doses of alcohol substantially decrease glucose metabolism in the human brain
NeuroImage, 29 (2006), pp. 295-301
- [109]
- N.D. Volkow, G.-J. Wang, R. Hitzemann, J.S. Fowler, J.E. Overall, G. Burr, et al.
Recovery of brain glucose metabolism in detoxified alcoholics
J Psychiatry, 151 (1994), pp. 178-183
- [110]
- N.D. Volkow, G.-J. Wang, E.S. Kojori, J.S. Fowler, H. Benveniste, D. Tomasi
Alcohol decreases baseline brain glucose metabolism more in heavy drinkers than controls but has no effect on stimulation-induced metabolic increases
J Neurosci, 35 (7) (2015), pp. 3248-3255
- [111]
- J. Wang, H. Du, L. Jiang, X. Ma, R.A. de Graaf, K.L. Behar, et al.
Oxidation of ethanol in the rat brain and effects associated with chronic ethanol exposure
Proc Natl Acad Sci, 110 (35) (2013), pp. 14444-14449
- [112]
- G.J. Wang, N.D. Volkow, D. Franceschi, J.S. Fowler, P.K. Thanos, N. Scherbaum, et al.
Regional brain metabolism during alcohol intoxication
Alcohol Clin Exp Res, 24 (2000), pp. 822-829
- [113]
- J. Wang, S.B. Hamida, E. Darcq, W. Zhu, S.L. Gibb, M.F. Lanfranco, et al.
Ethanol-mediated facilitation of AMPA receptor function in the dorsomedial striatum: Implications for alcohol drinking behavior
J Neurosci, 32 (43) (2012), pp. 15124-15132
- [114]
- R.A. Waniewski, D.L. Martin
Preferential utilization of acetate by astrocytes is attributable to transport
J Neurosci, 18 (1998), pp. 5225-5233
- [115]
- D.F. Wilson
Oxidative phosphorylation: regulation and role in cellular and tissue metabolism
J Physiol, 595 (2017), pp. 7023-7038, 10.1113/JP273839
- [116]
- D.F. Wilson, A.T.J. Cember, F.M. Matschinsky
The thermodynamic basis of glucose-stimulated insulin release: a model of the core mechanism
Physiol Rep, 5 (12) (2017), 10.14814/phy2.13327
pii: e13327 PMID: 28655753
- [117]
- D.F. Wilson, A.T.J. Cember, F.M. Matschinsky
Glutamate dehydrogenase: Role in regulating metabolism and insulin release in pancreatic β-cells
J Appl Physiol, 125 (2) (2018), pp. 419-428
doi: 0.1152/japplphysiol.01077.2017. Epub 2018 Apr 12.PMID:29648519
- [118]
- D.F. Wilson, F.M. Matchinsky
Metabolic homeostasis: Oxidative phosphorylation and the metabolic requirements of higher plants and animals
J Appl Physiol, 125 (2019), pp. 1183-1192
- [119]
- D.F. Wilson, F.M. Matschinsky
Hyperbaric oxygen toxicity in brain: a case of hyperoxia induced hypoglycemic brain syndrome
Med Hypotheses, 132 (2019), Article 109375, 10.1016/j.mehy.2019.109375
PMID: 31454640
- [120]
- D.F. Wilson, A. Pastuszko
Transport of cysteate by synaptosomes isolated from rat brain: Evidence that it utilizes the same transporter as aspartate, glutamate and cysteine sulfinate
J Neurochem, 47 (1986), pp. 1091-1097
- [121]
- Z.-X. Xi, S. Ramamoorthy, D.A. Baker, H. Shen, D.J. Samuvel, P.W. Kalivas
Modulation of group II metabotropic glutamate receptor signaling by chronic cocaine
J Pharm Exptl Ther, 303 (2002), pp. 608-615
- [122]
- T. Yamamoto, M. Yamakawa
Effect of acetate administration on rats with chronic uremia
Artif Organs, 11 (1987), pp. 208-213
- [123]
- W. Yang, A.C. Munhall, S.W. Johnson
AMP-activated protein kinase slows D2 dopamine autoreceptor desensitization in substantia nigra neurons
Neuropharmacology, 158 (2019), Article 107705
- [124]
- M. You, M. Matsumoto, C.M. Pacold, W.K. Cho, D.W. Crabb
The role of AMP-activated protein kinase in the action of ethanol in the liver
Gastroenterology, 127 (2004), pp. 1798-1808
- [125]
- A.C. Yu, J. Drejer, L. Hertz, A. Schousboe
Pyruvate carboxylase activity in primary cultures of astrocytes and neurons
J Neurochem, 41 (1983), pp. 1484-1487
- [126]
- S.M. Zimatkin, R.A. Deitrich
Ethanol metabolism in the brain
Addiction Biol, 2 (1997), pp. 387-399
- [127]
- S.M. Zimatkin, S.P. Pronko, V. Vasiliou, F.J. Gonzalez, R.A. Deitrich
Enzymatic mechanisms of ethanol oxidation in the brain
Alcoholism: Clin Exptl Res, 30 (2006), pp. 1500-1505
PMID: 16930212
- [128]
- S.M. Zimatkin, U.K. Rout, M. Koivusalo, R. Bϋhler, K.O. Lindros
Regional distribution of low-Km mitochondrial aldehyde dehydrogenase in the rat central nervous system
Alcohol Clin Exp Res, 16 (6) (1992), pp. 1162-1167