
1.14: Separation of the Phosphatidylcholines Using Reverse Phase HPLC
- Page ID
- 18917

14.1 Learning Objective
This laboratory has 2 goals, (1) to learn more of membrane lipid structures by working with phosphatidylcholines and (2) to learn the basics of an especially important high performance liquid chromatography (HPLC) technique, reverse phase HPLC. You should use your knowledge of phosphatidylcholine structures to rationalize the elution pattern from the HPLC.
14.2 Phosphatidylcholines
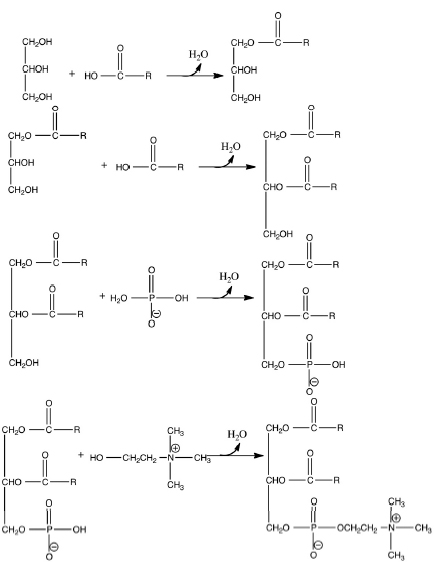
Phosphatidylcholine is an important class of lipids (hydrophobic biochemicals). This class is one of the primary constituents of the biological membrane. Phosphatidylcholines have a common structure. To build a phosphatidylcholine, start with glycerol. Other components are connected to glycerol using ester bonds. Two fatty acids (long chain carboxylic acids) are esterified to the top two positions of glycerol. The third position contains a phosphate and a choline. Each phosphatidylcholine differs from others of its class based on the molecular characteristics of the fatty acid chains (Fig. 14.1).
14.3 High Performance Liquid Chromatography (HPLC)
Separation of phosphatidylcholines is difficult, but can be done using high performance liquid chromatography (HPLC). This separation technique depends on passing a solution (the mobile phase) through a column packed with very tiny particles (the stationary phase). Some solutes are attracted strongly to these particles, and travel through the column slowly. These solutes stick to a particle for a certain length of time and then “hop” to the next particle. Compared with the motion of the mobile phase, these solutes are retarded. Other solutes are only attracted to the particles weakly and so can travel through the column quickly.
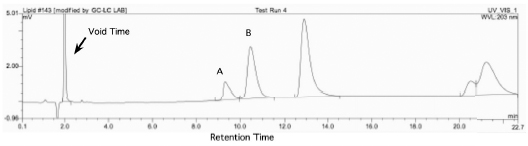
The differential movement of solutes leads to the separation of the solute. This is often shown as a chromatogram (Fig. 14.2).
You will be using reverse phase HPLC. The particles in this technique are made of silica (sand) that has been coated with alkane chains. Solutes that are more hydrophobic are more strongly attracted to the stationary phase and move more slowly through the column. You will be separating five phosphatidylcholine compounds with very similar structures (Fig. 14.3).
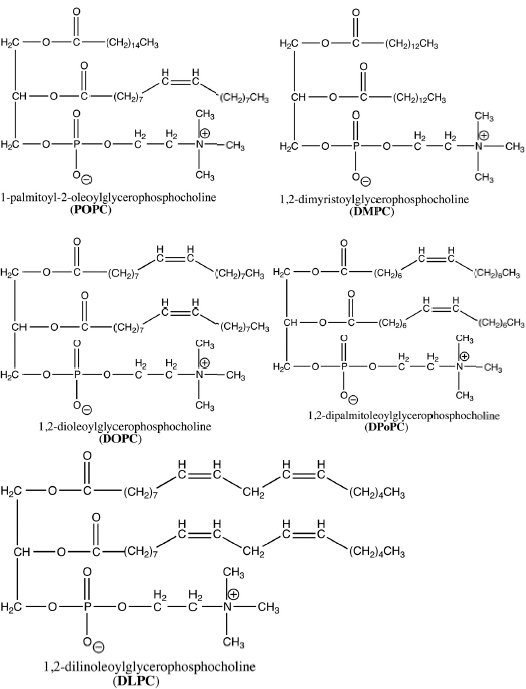
Phosphatidylcholines with the longer fatty acid chains are more strongly attracted to the stationary phase. The length of the fatty acid chains depends on:
– the number of carbons,
– the presence of cis double bonds. Each cis double bond makes the chain act as if it were one to two carbons shorter (less hydrophobic).
Which of the five phosphatidylcholines would you predict to be attracted most to the stationary phase? Which would you predict will be attracted least? Based on the PC structure, predict the order of elution from the column.
14.4 Quantifying Chromatography
The success of a separation can be measured in several different ways. First, quicker separation tends to be better, because the experimenter doesn’t have to wait for her/ his results too long. For each solute a retention time is measured. This is the elapsed time from the beginning to when the solute peak leaves the column. Typically, this time is reported relative to the quickest elution time (the time it takes for solvent to pass through the column, the void time). So, the quickness of separation is measured by relative retention or capacity factor (k´).
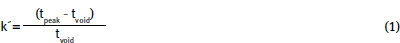
Using the chromatogram in Fig. 14.2, Peak A has a retention time of 9.3 min. The void time for this chromatogram is 2.0 min.
Peak A is retained on the column 3.6-times longer than the mobile phase.
Another measure of success is to monitor the shape of each peak. Sharp peaks mean a better separation. This is measured by determining the width of the peak relative to how long the peak is retained on the column.
The Peak A from Fig. 14.2 has a retention time of 9.3 min with a peak width of 0.8 min.
A well-done separation will give efficiencies in the thousands.
A third measure of success is to quantify how much separation occurs between neighboring peaks. This selectivity is calculated as the ratio of capacity factors
Peak A has a k´= 3.6 while Peak B has a k´= 4.3. This means, this separation between Peak A and Peak B has a selectivity of 1.2. Peak B is retained 20% longer than Peak A. A good separation will give selectivity values of greater than 1.1.
PROCEDURES
Reagents and equipment needs are calculated per six student teams. There is ~20% excess included.
Equipment/glassware needed:
- Standard HPLC system 1 per 2 student teams
- C-18 reverse phase HPLC column
Reagents needed:
- 98% methanol
- 100 μl of phosphatidylcholines mix dissolved in methanol. Stock concentrations for each phosphatidylcholine in the mix are listed below
- DMPC 10 mg/ml
- DPoPC 5 mg/ml
- DLPC 1 mg/ml
- POPC 5 mg/ml
- DOPC 5 mg/ml
Experimental procedure:
- A standard analytical, reverse phase HPLC column (C-18) is equilibrated with 98% methanol - 2% water. A flow rate of 1 ml/min is convenient.
- Each separation uses 10 μl of a mixed phosphatidylcholine sample.
- The sample contains 10 mg/ml DMPC, 5 mg/ml DPoPC, 1 mg/ml DLPC, 5 mg/ml POPC, 5 mg/ml DOPC in methanol.
- Each separation requires about forty minutes.
- Follow your instructor’s directions concerning operation of the HPLC chromatograph.
Data Analysis:
- Calculate the capacity factor (relative retention) for each phosphatidylcholine.
- Determine the column efficiency (N) calculated using the DLPC peak.
- Calculate the selectivity (α) between (a) DMPC vs. DPoPC, (b) DPoPC vs. DLPC, (c) DLPC vs. POPC and (d) POPC vs. DOPC.
Notes to Instructor
This laboratory is scheduled to maximize use of a limited number of chromatographs. At the authors’ institution, we use three HPLC machines simultaneously. Two student teams (each team composed of a student pair) are assigned to each chromatograph. While one team runs the chromatography, the other team is completing an in-lab HPLC problem set. Thus, by the end of the period, all teams have completed a chromatographic trial and practiced the common calculations needed to analyze a chromatogram.
HPLC of Lipids Prelab
1. Draw the structure of each phosphatidyl choline that you are going to separate during lab (there are five)!
2. Circle the hydrophobic part of each molecule!
3. Rank these molecules based on hydrophobicity from least (5) to most hydrophobic (1)!
4. Which of the five PCs would you predict to be attracted most to the stationary phase? Which would you predict will be attracted least?
5. Based on the PC structure, predict the order of elution from the column.
HPLC of Phosphatidylcholines
Lab Report Outline and Point Distribution
Introduction
1. Several sentences defining the goal/purpose of this experiment. (3 pts.)
Data
- A copy of your chromatogram with each peak labeled with a specific phosphatidylcholine. (10 pts.)
Results (please show all calculations)
- The capacity factor (relative retention) for each phosphatidylcholine. (10 pts.)
- The column efficiency (N) calculated using the DLPC peak. (4 pts.)
- The selectivity (α) between (a) DMPC vs. DPoPC, (b) DPoPC vs. DLPC, (c) DLPC vs. POPC, and (d) POPC vs. DOPC. (8 pts.)
Analysis
- Which phosphatidylcholines are cleanly separable on this column. Briefly explain. (5 pts.)
- Problems (10 pts.)
HPLC Problem Set
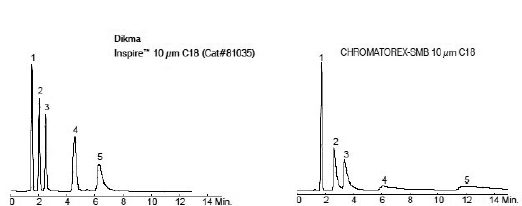
(Courtesy of Dikma Technologies. Chromatorex is a registered trademark of Fuji Silysia Chemical Ltd. Dikma Technologies Inc. is not affiliated with the above company.
1. (5 pts.) The chromatogram from Chromatorex-SMB appears not as good as the chromatogram from Inspire. Calculate the column efficiencies (N) based on peak 3. (Use a ruler and the conversion, 1 minute/6 mm.) Does this agree with the conclusion in the first sentence? Briefly explain.
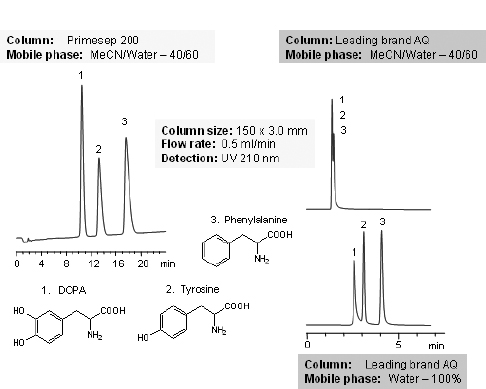
(Courtesy of SIELC Technologies)
2. (5 pts.)By just looking at the chromatograms, rank them from best separation to worst separation. Using the two chromatograms that are measurable, determine retention times for each peak. (Estimate times to the nearest 0.1 minute.) Calculate capacity factors for each peak using 1.1 min as the void time. Then, calculate selectivity factors (α) for Peak 1 vs. Peak 2 and for Peak 2 vs. Peak 3. Do the selectivity factors agree with your ranking? Briefly explain.