
1.13: Determining the Efficiency of the Enzyme Acetylcholine Esterase Using Steady-State Kinetic Experiment
- Page ID
- 18916

13.1 Learning Objective
This laboratory introduces you to steady-state kinetic analysis, a fundamental tool for studying enzyme mechanisms. The enzyme studied, acetylcholinesterase (AChE), has a well-understood mechanism and carefully examined structure. Additionally, AChE is physiologically very important and is an example of “catalytic perfection.” You will determine Vmax, kcat, and KM and then analyze the catalytic capabilities of AChE.
13.2 Measuring the Catalytic Efficiency of Acetylcholinesterase
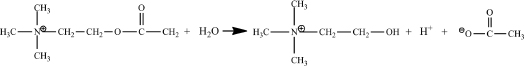
Acetylcholinesterase catalyzes the hydrolysis of the neurotransmitter acetylcholine to choline and acetate:
The organic reactant in an enzymatic reaction is also termed the substrate. By studying the kinetics of this reaction, you will probe the details of acetylcholinesterase catalysis.
As is the case with many enzyme studies, you will use a different substrate that gives a color change upon reaction, acetylthiocholine (ASCh). A sulfur atom replaces the oxygen atom in this compound’s ester.
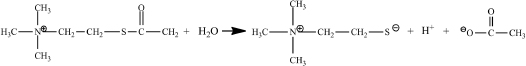
ASCh reacts like acetylcholine, but one of its products is different. This different product, thiocholine, reacts with the color-forming reagent, 5,5´-dithiobis(2- nitrobenzoate) (DTNB) producing a strong yellow color.

13.3 Running a Steady-State Enzyme Kinetics Experiment
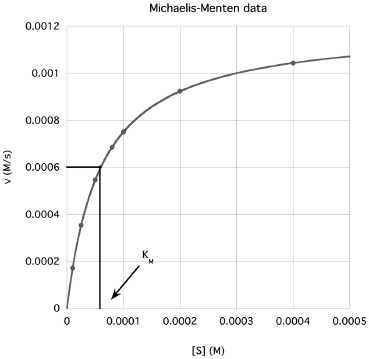
The most common steady-state enzyme experiment holds the enzyme concentration constant and measures reaction rate (velocity, v) at varying reactant (substrate, S) concentrations. Velocity is the dependent variable and substrate is the independent variable. This experiment generates the Michaelis-Menten plot. An example follows (Fig. 13.1):
13.4 Designing a Steady-State Experiment
Commonly, an assay solution contains buffer, substrate, enzyme and often a color-forming reagent. Your assays will start with a milliliter volume of buffer into which microliter volumes of stock substrate, stock color-forming reagent, and stock enzyme are diluted. To prepare for a steady-state enzyme kinetics experiment you have to fill out a chart similar to the one below.
Table of Volumes for Each Assay
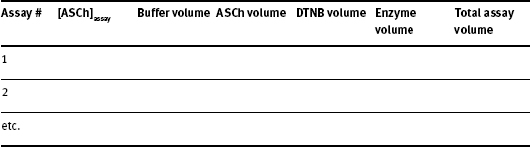
Instructions on how to calculate each quantity are as follows:
1. [ASCh]assay:
Refer to the Michaelis-Menten plot on Fig. 13.1. The Michaelis constant (KM) is related to the attraction between the enzyme and the substrate. That is, a smaller KM means the enzyme reacts at smaller substrate concentrations - the substrate is more strongly attracted to the enzyme.
As shown, the KM is also a rough midpoint on the hyperbolic curve. Commonly, about one half of the assays should have [S] < KM and about one half of the assays, [S] > KM. Typically, the largest [S] is chosen to be about 5 x KM. Because of the hyperbolic curve shape, the smaller [S] are spaced closer together while the larger [S] values are spaced further apart. The KM provides a guide for choosing substrate concentrations.
Acetylcholinesterase (AChE) has a KM for the substrate (acetylthiocholine iodide, ASCh, M.W. = 289.18 g/mol) of about 8 x 10⁻⁵ M. Choose seven substrate concentrations up to 5 x KM being careful to space the concentrations appropriately. Fill in the column marked “[ASCh]assay” in your Table of Volumes for Each Assay.
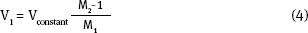
Understand that the concentrations you have just chosen are under assay conditions - that is, in the cuvette. You get these cuvette concentrations by adding small volumes of a stock [ASCh] to a larger volume of buffer (a dilution). You now need to calculate (a) the stock [ASCh] concentration and (b) the microliter volumes of this stock [ASCh] to be used for each of these assays.
2. Buffer volume:
You will use a 1:4 dilution of the tris buffer you prepared several weeks ago in a 3.0 ml assay volume. For the experiments you will use standard quartz cuvettes.
3. Stock [ASCh] concentration:
When you calculate the stock [ASCh] concentration ([ASCh]stock) you need to consider two things: (1) The highest [ASCh] you want to use in the assay. As we mentioned earlier, this is typically 5 x KD value of the enzyme; (2) [ASCh]stock gets diluted when it is added to the buffer in the cuvette. Consequently, you need to use the dilution equation:

where:
M1 is [ASCh]stock
V1 is 100 μl for a 3.0 ml assay
M2 is [ASCh]assay
V2 is the total volume in the cuvette.

Looking ahead the enzyme volume will be a constant at 10 μL and the DTNB volume will be 60 μL. Then,

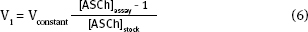
4. [ASCh] volume:
Now that you have calculated the [ASCh]stock, you can calculate the ASCh volume, V1. This calculation is more complicated than it seems, because the total assay volume, V2, depends on the ASCh added, V1. To simplify the calculation volumes that are constant in each assay can be combined to yield:
Where

Recall that

Thus
5. Selecting an enzyme concentration:
For steady-state kinetics, [S] >>> [E]; that is, the enzyme concentration must be much smaller than the substrate concentration over the entire substrate concentration range. You will start with a prepared [AChE]superstock and dilute a small amount of this 1:100 for use in the kinetic assays. This dilution is [AChE]stock. You will then add 10 μl of stock enzyme into each assay mixture. Fill in the Enzyme Volume column in your Table of Volumes for Each Assay.
6. Preparing other reagents:
This AChE assay uses the colorimetric reagent, 5,5´-dithiobis(2-nitrobenzoate) (DTNB). Every assay will contain a constant amount of DTNB. The stock room has prepared [DTNB]stock = 0.01 M. We will use 60 μl of this stock DTNB per assay. Fill in the DTNB Volume column in your Table of Volumes for Each Assay. Finally, complete the Total Assay Volume column in your table.
SUMMARY: An outline for preparing enzyme assays
1. Set the conditions for the assay - choose the assay buffer and approximate assay volume.
2. Select the substrate concentration to use in each assay.
3. Calculate the stock substrate concentration knowing the largest volume and the largest substrate concentration.
4. Calculate the substrate volumes for all other assays knowing the total assay volumes and the stock substrate concentration.
5. Use constant amounts of enzyme and other reagents.
PROCEDURES
Reagents and equipment needs are calculated per six student teams. There is ~20% excess included.
Equipment Needed
- Micropipettes, 2-20 μl, 20-200 μl
- Volumetric glass pipette, 3.00 ml
- UV/vis spectrophotometer
- Standard quartz cuvette, 3 ml
Reagents
- 0.01 M 5,5´-dithiobis(2-nitrobenzoate) (DTNB) in water. [Prepare 20 ml for 18 groups. Add about 1 mg sodium bicarbonate per ml to help dissolve the DTNB]
- 300 units/ml of AChE. [Use 1 mg lyophilized AChE powder (518 units/mg) into 1.7 ml .05 M Na2HPO4, pH = 7.0.]
Prepare reagents as follows
- Prepare 100 ml of a 1:4 diluted tris buffer from your stock tris buffer.
- Prepare 10.00 ml of the stock acetylthiocholine iodide in tris buffer solution.
- Prepare 1.0 ml of 1:100 diluted enzyme solution from the superstock AChE solution using your 1:4 diluted tris buffer. Be careful! This is a very expensive reagent. Put your enzyme stock solution on ice.
Assay Procedure
- Adjust the spectrophotometer to 412 nm and set the software to record a time course with one spectrum every 15 s for a total of 3 minutes.
- Using a volumetric glass pipette, add 3.00 ml of buffer to a quartz cuvette. Then, add a volume of ASCh and mix by gently inverting the cuvette several times. Add 60 μl of the stock DTNB solution and mix. Place the cuvette into the spectrophotometer and start recording the time course. After about 20 seconds, remove the cuvette and add 10 μl of the [AChE]stock. Mix rapidly (and gently!) and put the cuvette into the spectrophotometer to complete recording the time course.
- Record the initial linear rate as calculated by the spectrophotometer’s software (in units of Abs/s).
- Repeat this assay procedure for each different [ASCh].
Calculations following completion of assays
- Using Beer’s law and the molar absorptivity for the colored product, 14,150 M-1cm-1, convert all initial linear rates to units of M/min.
- Using a graphing program, plot velocity (M/min) versus [ASCh] (M) (the Michaelis-Menten plot). If your program can fit a hyperbolic equation (i.e., the Michaelis-Menten equation) to the data, determine KM and Vmax.
- Using a graphing program, construct a Lineweaver-Burk plot (1/v versus 1/[ASCh]). Fit the data to a straight line and calculate both KM and Vmax.
- Calculate the enzyme concentration in the cuvette knowing the superstock [AChE]. [Note: Although the ASCh volume varies from assay to assay, the total assay volume changes little. We can treat the total assay volume as constant and the enzyme concentration as the same for all assays.]
- Determine the kcat (in units of s-1) and, finally, the measure of catalytic efficiency, kcat/KM.
Notes to Instructor
This lab assumes a working knowledge of the Michaelis-Menten equation as taught in the biochemistry lecture. Thus, in our schedule, this laboratory often comes near the end of the term.
This lab seeks to emphasize the very practical aspects of steady-state experiments. This means, calculations focus on determining volumes and concentrations. We find it important to emphasize to the students that without these “basic” calculations accurately done, the experiment will fail.
Prelab for AchE Kinetics
1. Briefly outline a step-by-step procedure for this steady-state experiment.
2. List your chosen stock substrate concentration and calculate how you make 10 ml of this solution if the substrate acetylthiocholine iodide has a molar mass of 289.18 g/mol).
3. Construct a table showing the volumes of each reagent you will use for each assay and the corresponding [ASCh]:
Table of Volumes for Each Assay

Lab Report Outline and Point Distribution
1. Introduction
a. Several sentences defining the goal/purpose of this experiment. (3 pts.)
b. Brief outline of the step-by-step procedure for this steady-state experiment. (3 pts.)
2. Data
a. Table of Volumes for Each Assay (the table that you prepared before lab). (3 pts.)
i. Provide a brief rational for your choice of acetylthiocholine concentrations. (3 pts.)
i. ii. Give an example of a calculation to determine V1 for adding ASCh to the cuvette. (3 pts.)
b. Calculations to determine [AChS]stock. (4 pts.)
c. Calculations to determine [AChE] in the cuvette. (4 pts.)
d. Table listing [ASCh] versus rates in units of Abs/s and M/min. Give an example of the calculations needed to convert rate from Abs/s to M/min. (4 pts.)
3. Results
a. Computer-generated Michaelis-Menten plot. (5 pts.)
b. Computer-generated Lineweaver-Burk plot. (5 pts.)
c. Values for KM, Vmax, kcat, and the ratio kcat/KM. Show the calculations used to determine kcat. (4 pts.)
4. Analysis
a. Using the ratio, kcat/KM, comment on the efficiency of acetylcholinesterase. (What does this ratio tell you about the enzyme efficiency?) (5 pts.)
b. Relate the enzyme efficiency to the biological role of acetylcholinesterase. (4 pts.)
Enzyme Kinetics Worksheet
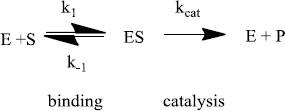
Enzymes do two things really well - specific binding and catalysis:

The rate of an enzyme-catalyzed reaction is proportional to the concentration of ES:

This equation is difficult to use because the [ES] is not directly measurable. An equation that relates the rate to [S] (a variable that can be set by the researcher) is needed. This is called the Michaelis-Menten equation:
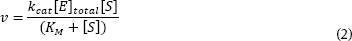
The Michaelis constant (KM) combines many rate constants together.
This equation predicts an hyperbola when v is plotted against [S] - just what is normally observed. As you know, this plot approaches a constant v at high [S]. The equation predicts this behavior. When substrate concentration is very large [S]>>(KM), Equation 2 simplifies to:
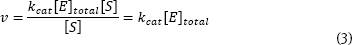
The rate approaches a constant, large value, kcat[E]total. This is termed the maximum velocity or Vmax. So, the Michaelis-Menten equation can be written:
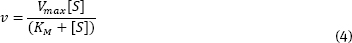
It can be shown that the KM is numerically equal to the substrate concentration that gives 1/2 Vmax.

Work the following problems involving the Michaelis-Menten equation and plot.
Problem 1 (3 pts.). Estimate KM and Vmax from the following plot:

Given [E]total = 5 x 10⁻⁶ M, calculate the kcat for this enzyme.
Problem 2 (7 pts.). From the following data, prepare a computer-generated Michaelis-Menten plot. Then, estimate Vmax and KM.
| [S] (M) | v (M/min) |
| 2.0000e-05 | 6.7961e-05 |
| 3.0000e-05 | 9.2920e-05 |
| 4.0000e-05 | 0.00011382 |
| 6.0000e-05 | 0.00014685 |
| 1.0000e-04 | 0.00019126 |
| 0.00020000 | 0.00024735 |
| 0.00030000 | 0.00027415 |
| 0.00050000 | 0.00030017 |
Problem 3 (10 pts.) It is common to use a linearized form of the Michaelis-Menten equation to get a more precise measure of KM and Vmax. Inverting the Michaelis-Menten equation gives the Lineweaver-Burk equation which is a straight-line equation:
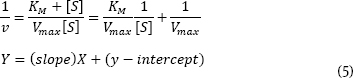
Using the above set of data, calculate and plot 1/v versus 1/[S]. Determine KM and Vmax. Knowing that the [E]total = 0.00004 M, also calculate kcat.
 What can you learn from a steady-state kinetics experiment?
Steady-state kinetics experiments supply numerical measures of an enzyme’s capabilities, both catalysis and binding.
Vmax, kcat (the maximum velocity, the catalytic rate constant): In general, Vmax is not part of published studies because this value depends on [E]total. Instead, kcat is reported.

The catalytic rate constant (kcat) is a measure of enzyme effectiveness at high [S], when all enzyme sites are saturated with substrate. Substrate is “forced” onto the active site independent of the enzyme’s ability to bind. The catalytic rate constant measures one important enzyme characteristic (catalysis) but not the other (specific binding).
Enzymes that are better catalysts have larger kcat’s. This value can be understood as a turnover number. It measures the number of substrates “turned-over” to products per unit time by one enzyme when saturated with substrate. Thus, an enzyme with a kcat = 1500 s-1 converts 1500 substrate molecules to products per second under saturating conditions. The other enzyme with a kcat = 4500 s-1 is a three-fold more efficient catalyst.
KM (the Michaelis constant): The Michaelis constant is used in two different ways. First, it gives a good estimate of the “midpoint” for the hyperbolic Michaelis-Menten plot. This follows from the definition of KM as the [S] that gives 1/2 Vmax. The KM allows an estimate of the concentration range over which the enzyme is active.
Second, the Michaelis constant is a ratio of rate constants for the enzyme-catalyzed mechanism. Commonly, the binding step rate constants play a prominent role. So, the KM can be used as a measure of specific binding - the smaller the KM the tighter the specific binding. However, it is important to note that the value of KM is also affected by catalysis (kcat).
kcat/KM (the ratio of the catalytic rate constant to the Michaelis constant): This ratio is a measure of the overall enzyme efficiency - it takes into account both catalysis (kcat) and a measure of specific binding (KM). A more efficient enzyme has a larger kcat/KM while a less efficient enzyme has a smaller ratio. The larger ratio may be caused by the fact that an enzyme is a better catalyst (a larger kcat) or because an enzyme is a better binder (a smaller KM) or both.
To understand this ratio further we need a more detailed analysis of the reaction mechanism that comes from steady-state theory. Generally:

As nature improves an enzyme, specific rate constants change. The enzyme can be improved by being made a better catalyst - increasing kcat. And/or, it can become a better enzyme by binding more tightly - decreasing k-1. The third rate constant (k1) is not affected by the enzyme. Instead, k1 is a constant and only depends on how fast E and S diffuse together. The k1 value ranges from about 108 M-1s-1 to 109 M-1s-1 under physiological conditions.
For the “perfect” enzyme: (1) ES will almost never fall apart to E plus S (k-1 will be very small); ES will almost always immediately react to form products (kcat will be very large). Therfore, substrate will react as quickly as E and S diffuse together. The rate equation that expresses this situation is as follows:

Under these conditions the enzyme can no longer increase the rate of reaction!! The rate depends only on how fast E can diffuse together with S. The reaction rate is out of the enzyme’s control!
So, there is an upper limit to the rate constant of an enzyme-catalyzed reaction (108 M-1s-1 to 109 M-1s-1 ). Diffusion serves as nature’s speed limit. As enzymes improve, their rate constants approach this limit. More specifically, kcat/KM approaches this limit. That is, the closer kcat/KM is to 108 M-1s-1 to 109 M-1s-1, the closer the enzyme is to “perfection.”
[A brief mathematical justification for using kcat/KM to judge enzyme perfection.]
Under steady-state conditions,

for the common mechanism,
The enzyme can be improved by becoming a better catalyst, increasing kcat and/or it can become a better enzyme by binding more tightly, decreasing k-1. Either way, (k-1 + kcat) approaches kcat for the best enzymes and Equation (7) becomes:

Then, the ratio kcat/KM equals kcat/(kcat/k1) which is just equal to k1. The efficiency of the enzyme reaches an upper limit, k1. No matter how much better the enzyme catalyzes the reaction (increasing kcat) or how much more tightly it binds substrate (decreasing k-1), the overall reaction rate will not improve further. At this point, the reaction rate just depends on the speed at which S and E diffuse together. The enzyme is doing all it can and it is said to have reached “perfection.”
The ratio, kcat/KM, is perhaps the most useful constant for describing enzyme efficiency. First, it allows a relative comparison between enzymes - a comparison that takes into account both catalysis and binding. Second, this ratio provides an absolute comparison to the “perfect” enzyme.
Problem 4 (20 pts.). Two enzymes that catalyze the same reaction were studied ([Enzyme A] = 5 x 10⁻⁷ M; [Enzyme B = 2 x 10⁻⁶ M). The data from this study are given below:
| [S] (M) | v (M/s), Enz A | v (M/s), Enz B |
| 2.0000e-05 | 3.2500e-05 | 0.0018824 |
| 3.0000e-05 | 4.7273e-05 | 0.0021818 |
| 4.0000e-05 | 6.1176e-05 | 0.0023704 |
| 6.0000e-05 | 8.6667e-05 | 0.0025946 |
| 1.0000e-04 | 0.00013000 | 0.0028070 |
| 0.00020000 | 0.00020800 | 0.0029907 |
| 0.00030000 | 0.00026000 | 0.0030573 |
| 0.00050000 | 0.00032500 | 0.0031128 |
- (1) Create Lineweaver-Burk plots for each enzyme.
- (2) Calculate and report KM, Vmax, kcat and kcat/KM (show calculations as well as reporting values).
- (3) Compare the enzymes with each other and with “perfection.”