
1.10: Evaluating Antibiotic Binding to Blood Serum Albumin Using Fluorescence Spectroscopy
- Page ID
- 18913

10.1 Learning Objectives
In this laboratory, you will study one of the most important functions of proteins. Proteins bind specific small molecules in a very selective fashion. This laboratory focuses on the major extracellular protein in the blood stream, human serum albumin. To study binding, we have chosen a sensitive optical measurement, fluorescence. You will use the wealth of data from this sensitive technique to study the details of antibiotic binding to albumin.
10.2 Biological Role of Serum Albumin
Albumin is the major circulating protein in the blood stream comprising about half of the total serum protein. Its structure contains many hydrophobic pockets which bind a variety of biological molecules. Several examples follow:
- When red cells die and lyse, excess of the heme is released. Albumin binds this excess removing it from the blood stream.
- Hydrophobic hormones, such as the thyroxines or steroids are often bound by albumin.
- Many anionic, hydrophobic drugs bind to albumin. This binding has a major impact on the drugs’ effectiveness. This binding can slow drug distribution to the tissues, reduce drug clearance and cause an overall loss of drug efficacy. Interactions between drugs are also mediated by serum albumin. For example, one drug may cause an increase in availability of a second drug (thus, increasing the effective drug dose) if the drugs compete for the same binding site of serum albumin.
During this laboratory you will masure binding affinity between albumin and a common antibiotic, levofloxacin (Levaquin®).
10.3 Fluoroquinoline Antibiotics
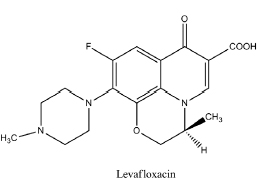
Levofloxacin (Levaquin®) is a member of the fluoroquinoline class of antibiotics. These drugs have been known for about 50 years, but especially effective derivatives were not widely available until the 1980s. These are “second generation” fluoroquinolines and include the common drugs, ciprofloxacin (Cipro®) and ofloxacin (Floxin®).
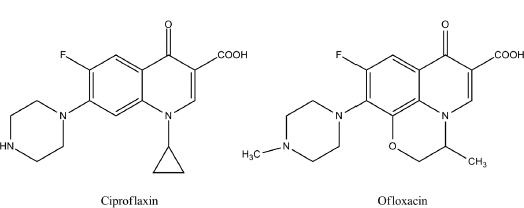
Levofloxacin (Levaquin®) is a “third generation” fluoroquinolone and is simply the biologically-active isomer of ofloxacin (a racemic mixture).
The fluoroquinolones have a unique site of action, inhibiting the bacterial DNA gyrase (topoisomerase type II) and topoisomerase IV. These enzymes unwind DNA and are required for DNA replication. The fluoroquinolines block DNA unwinding and, thus, block bacterial replication. They are most effective against Gram-negative bacteria although the later generation drugs also are effective against some Gram-positive and anaerobic bacteria.
10.4 Protein Structure, Aromatic Amino Acids, and Fluorescence
Proteins are polymers of amino acids. The amino acid side chains (R groups) are primarily responsible for unique properties of each protein. For example, if a protein has many amino acids with alkyl side chains, then the protein is relatively hydrophobic. Or, if the protein has many amino acids with carboxylate-containing side chains, then the protein tends to be negatively charged.
The aromatic amino acids, phenylalanine, tyrosine and tryptophan, contribute to the unique property of proteins, fluorescence. Fluorescence is a process by which a molecule absorbs light and then emits the light again (typically at a longer wavelength; Fig. 10.1).

The aromatic amino acids have an absorbance peak between 260 nm to 290 nm. They emit light maximally from about 290 nm to about 350 nm.
10.5 Measuring Fluorescence
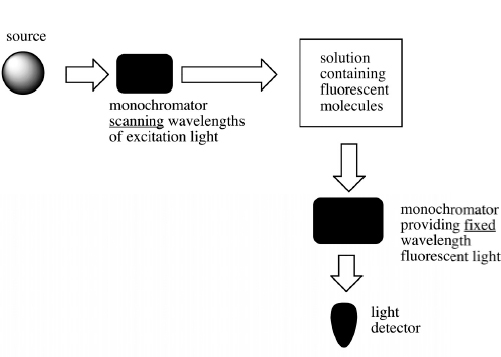
To measure fluorescence, you always set two wavelengths, the wavelength of light irradiating the sample (the excitation or absorbance λ) and the wavelength of emitted light to be measured (emission λ). To scan an emission spectrum, the absorbance/ excitation λ is fixed and a monochromator scans through the emission wavelengths (Fig. 10.2).
To scan an excitation spectrum, the emission λ is fixed and a monochromator scans through wavelengths of light that irradiate the sample (Fig. 10.3).

Fluorescent molecules, like the aromatic amino acids, have characteristic emission and excitation spectra - these spectra can serve to identify molecules. For example, the shapes of the peaks as well as the peak wavelengths are characteristic of specific molecules. Tryptophan has a broad emission peak at about 350 nm while tyrosine has a narrow emission peak at about 305 nm. The wavelength difference between excitation and emission also is characteristic. Depending on a molecule’s electronic energy levels, the difference between excitation and emission may be large (much energy is lost before light is emitted) or small (little energy is lost before light is emitted). For example, tryptophan has about a 60 nm difference between excitation and emission wavelength while tyrosine has only about a 15 nm difference (Fig. 10.4). Tryptophan loses more energy before emission while tyrosine loses less.

10.6 Synchronous Spectroscopy
Synchronous spectroscopy selects for fluorophores with a specified energy difference between excitation and emission. This technique depends on maintaining a constant difference between the excitation wavelength and the emission wavelength. The excitation monochromator scans wavelengths simultaneously and at the same speed as the emission monochromator. Since the monochromators are synchronized with each other (synchronous spectroscopy) a constant Δλ is maintained. Using a Δλ = 15 nm means the spectrofluorometer is sensitive to groups that fluoresce light after a small shift in wavelength, i.e., tyrosine. Setting a Δλ = 60 nm allows the spectrofluorometer to “see” groups that fluoresce light after a large shift in wavelength, i.e., tryptophan. By setting a given Δλ, the spectrofluorometer is able to monitor select, specific amino acids.
10.7 Data Analysis
The goal of this laboratory is to monitor binding of levofloxacin to albumin.
Levofloxacin binding is proportional to the change in fluorescence. Since the fluorescence decreases, the change is called fluorescence quenching. To measure binding of levofloxacin by albumin as a function of levofloxacin concentration, we need to plot fluorescence quenching versus the concentration of the levofloxacin in the cuvette. In general, binding between a protein (P) and a ligand (L) fits the following equation:
P +L  PL
PL
where
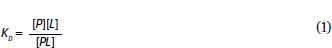
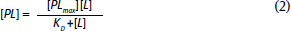
In most experiments, [L] (the independent variable) is varied and [PL], the dependent variable, is measured. Equation 1 is algebraically rearranged to put the dependent variable on the left and the independent variable on the right. Note that Equation 2 has the same form as the Michaelis-Menten equation (Fig. 10.5).
and
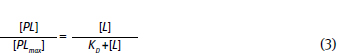
It is important to recognize that the dissociation constant, KD, is numerically equal to the [L] that yields  So, the KD can be determined from both graphs. Since fluorescence quenching
  is equal to
  ,
,
This equation is analogous to Equation 3 and leads to a graph as shown in Fig. 10.6.
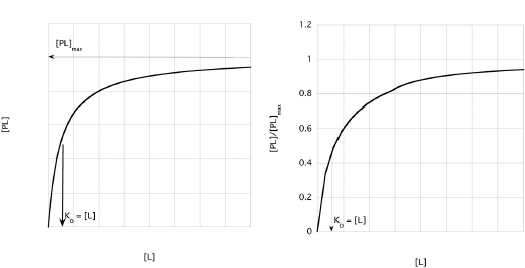 . When plotted this way, the Y-axis varies from 0 to 1.
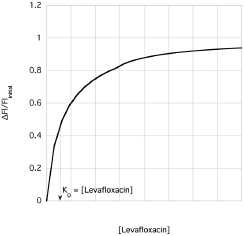 .
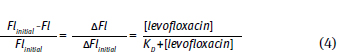
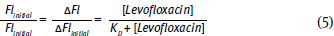
.This plot is similar to the two plots you created for your titrations. However, it is not the same. This plot graphs the free [levafloxacin], that is the total [levafloxacin] in the cuvette minus the [levafloxacin] bound to albumin. Your two plots graphed the total [levafloxacin] in the cuvette. Your concentrations must be corrected before an equilibrium constant can be calculated. Following rearrangement and substitution of Equation 4, Equation 5 is derived:
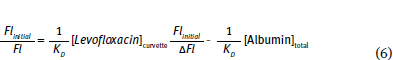
Equation 6 allows calculation of KD. Furthermore, this equation is set in a linear form using the slope-intercept equation, y = m x + b. Note that this equation uses Flinitial, ΔFl and Fl. Fluorescence spectroscopy can provide information concerning protein conformation changes. Both tyrosine and tryptophan fluorescence are blue-shifted, if the amino acids move into a more hydrophobic (non-polar) environment and red-shifted if the amino acids move into a more hydrophilic (polar) environment (Fig. 10.7).
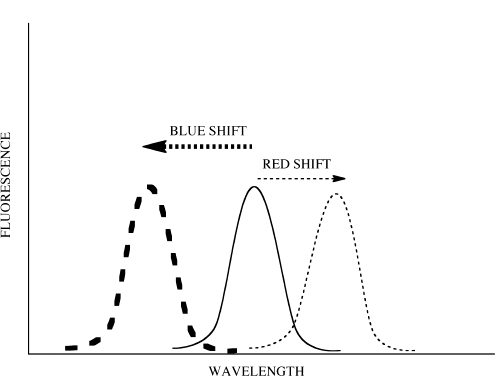
Note the change in peak λ when more levofloxacin is added for both Titration #1 and Titration #2. What can you conclude about the changing environment around the fluorophores?
PROCEDURES
Reagents and equipment needs are calculated per six student teams. There is ~20% excess included.
Equipment/glassware needed:
- Three sets of micropipettes 20-100 μl, 2-20 μl and 1-10 μl
- standard cuvette for a spectrofluorometer
Reagents needed:
- 10 ml of 0.014 M levofloxacin in 0.05 M tris, pH = 7.0
- 100 ml of 1 × 10⁻⁵ M serum albumin in 0.05 M tris, pH = 7.0
Experimental procedure:
Titration #1:
- Set spectrofluorometer to Δλ = 15 nm.
- Pipet 2.0 ml of bovine serum albumin (1 × 10⁻⁵ M; 0.05 M tris, pH = 7.0) into the fluorescence cuvette. Measure synchronous spectra from 250 nm to 450 nm.
- Add 1 μl of 0.014 M levofloxacin (0.05 M tris, pH = 7.0). Measure synchronous spectra from 250 nm to 450 nm.
- Repeat the levofloxacin additions followed by synchronous fluorescent measurements two more times.
- Add 2 μl of 0.014 M levofloxacin. Measure synchronous spectra from 250 nm to 450 nm.
- Repeat the levofloxacin additions followed by synchronous fluorescent measurements four more times.
- You should have eight different spectra at this point. Plot data as follows:
- Create an overlay of all spectra.
- Record the fluorescence at an excitation λ = 287 nm for each spectra.
- Print overlay spectra.
- Rinse the cuvette carefully with distilled water. The albumin solution may be discarded in the sink.
Titration #2:
- Repeat the same procedure, but set the spectrofluorometer to Δλ = 60 nm.
- Rinse the cuvette carefully with distilled water. The albumin solution may be discarded in the sink.
Data Analysis:
1. Calculate fluorescence quenching:

Note that fluorescence quenching varies from 0 to 1.
2. Calculate the concentration of levofloxacin in the cuvette; [levofloxacin]cuvette for each addition. Remember that the levofloxacin is diluted when added to the cuvette. You need to use the dilution equation, M1V1 = M2V2, where M1 = stock concentration of levofloxacin, V1 = total volume of levofloxacin added to the cuvette, M2 = the cuvette concentration of levofloxacin, and V2 = the total volume in the cuvette.
3. Plot the fluorescence quenching versus [levofloxacin]cuvette for Titration #1 and Titration #2.
4. Determine KD values for Titration #1 and Titration #2 as follows.
a. Plot  versus [Levofloxacin]curvette
  for Titration #1 and Titration #2. Note that we are using the linear form of the KD equation (see Equation 5).
b. KD =  of this graph.
Notes to the Instructor
The experiment in Chapter 10 uses the versatility of a research-grade spectrofluorometer. The spectrofluorometer gives a complete view of the observed spectral changes. Students measure complete spectra and then analyze fluorescence at specific wavelengths. Synchronous spectroscopy is possible with such a spectrofluorometer. A more basic fluorometer with filters rather than monochromators can also be used. In this case, the student should be provided with the pertinent spectra.
Lab Report Outline and Point Distribution
Introduction
- Several sentences defining the goal/purpose of this experiment. (2 pts.)
Data
- A table reporting the fluorescence as a function of the total volume of levofloxacin solution added for Titration #1. (2 pts.)
- A table reporting the same data for Titration #2. (2 pts.)
Results
- An example of the calculation you used to find the levofloxacin concentrations in the cuvette. (2 pts.)
- Four plots:
- Fluorescent Quenching vs. [levofloxacin]cuvette for Titration #1 and #2. (4 pts. each)
- vs. [levofloxacin]cuvette for Titration #1 and #2. Determine the KD from each plot. (5 pts. each)
Analysis
- Access the fluorescence excitation and emission spectra for phenylalanine, tyrosine and tryptophan using the Internet. Answer the following four questions. (8 pts.)
- Estimate peak wavelengths for absorption (at λ > 230nm) and emission (at λ > 250nm) for each amino acid.
- How are the peak absorption wavelengths related to the peak emission wavelengths? For example, is the emitted light at lower or higher energy than the absorbed light? Briefly explain.
- Which amino acid shows the biggest energy change from absorption to emission? Explain your reasoning.
- Rank these three amino acids from most fluorescent to least fluorescent. Briefly explain your reasoning.
- Identify the titration (either Δλ = 15 nm or Δλ = 60nm) that monitors tyrosine fluorescence and the titration that monitors tryptophan fluorescence. Which amino acid accounts for most of albumin fluorescence? Briefly explain. Which amino acid is most quenched by levofloxacin binding? Briefly explain. (6 pts.)
- Is there evidence for an albumin conformation change caused by levofloxacin binding? If there is evidence for a conformation change, are the tyrosines changing their environment (becoming more exposed to solvent or more buried into the protein interior)? Answer the same question for the tryptophans. Briefly explain being as specific as possible. (10 pts.)