
9.3: Obtaining the Data- Do the Results from the Experiment Support Your Hypothesis?
- Page ID
- 24180

\( \newcommand{\vecs}[1]{\overset { \scriptstyle \rightharpoonup} {\mathbf{#1}} } \) \( \newcommand{\vecd}[1]{\overset{-\!-\!\rightharpoonup}{\vphantom{a}\smash {#1}}} \)\(\newcommand{\id}{\mathrm{id}}\) \( \newcommand{\Span}{\mathrm{span}}\) \( \newcommand{\kernel}{\mathrm{null}\,}\) \( \newcommand{\range}{\mathrm{range}\,}\) \( \newcommand{\RealPart}{\mathrm{Re}}\) \( \newcommand{\ImaginaryPart}{\mathrm{Im}}\) \( \newcommand{\Argument}{\mathrm{Arg}}\) \( \newcommand{\norm}[1]{\| #1 \|}\) \( \newcommand{\inner}[2]{\langle #1, #2 \rangle}\) \( \newcommand{\Span}{\mathrm{span}}\) \(\newcommand{\id}{\mathrm{id}}\) \( \newcommand{\Span}{\mathrm{span}}\) \( \newcommand{\kernel}{\mathrm{null}\,}\) \( \newcommand{\range}{\mathrm{range}\,}\) \( \newcommand{\RealPart}{\mathrm{Re}}\) \( \newcommand{\ImaginaryPart}{\mathrm{Im}}\) \( \newcommand{\Argument}{\mathrm{Arg}}\) \( \newcommand{\norm}[1]{\| #1 \|}\) \( \newcommand{\inner}[2]{\langle #1, #2 \rangle}\) \( \newcommand{\Span}{\mathrm{span}}\)\(\newcommand{\AA}{\unicode[.8,0]{x212B}}\)
Now you will use the fish cards to see whether the result of the crosses described in Part 1 support your hypothesis. The cards show photographs of stickleback fish that were stained with a solution that turns bones red, making them easier to see. There should be two sets of cards: the first set (16 cards) represents the first filial (F1) generation and the second set (40 cards) the second filial (F2) generation. You will be sorting these cards according to whether the fish have pelvic spines.
- Sort the F1 set of cards into two separate piles: fish with pelvic spines and fish without pelvic spines.
- Repeat the same procedure with the F2 set of cards.
- Count and record the total number of fish with each phenotype in the table below.
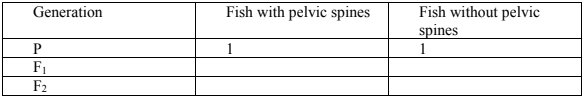
Results of a Cross Between Marine and Bear Paw Lake Stickleback - What is the ratio of fish with pelvic spines to fish without pelvic spines in the F1 generation?
- What is the ratio of fish with pelvic spines to fish without pelvic spines in the F2 generation?
- Do these results support the hypothesis that the presence or absence of pelvic spines is controlled by a single gene? Explain using evidence.
- According to these results, which phenotype is dominant and which is recessive? Explain using evidence.