
6.2: Catalase
- Page ID
- 24158

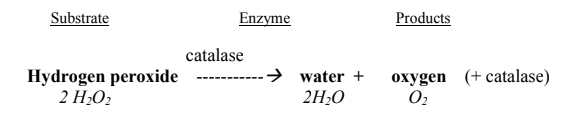
Cells produce hydrogen peroxide (H2O2) as a toxic by-product of normal cellular reactions. The enzyme catalase quickly breaks down hydrogen peroxide into water and oxygen. In other words, catalase protects cells from the toxic effects of hydrogen peroxide. All aerobic cells produce catalase. One molecule of catalase enzyme may work on 40 million molecules of hydrogen peroxide per second!
If you have used hydrogen peroxide to clean a cut, you have seen catalase in action. When hydrogen peroxide comes in contact with the cut, it reacts with the catalase enzyme in the damaged cells to produce oxygen foam. When the catalase reaction is conducted in a test-tube, the oxygen gas bubbles. The height of the foam is an indication of the amount of catalase activity present.
Investigation of catalase activity in plant and animal tissues
Materials
- 5 test-tubes
- wax pencil
- millimeter ruler
- 4 blended tissue extracts (may include apple, potato, onion, Baker's yeast, beef steak or/and beef liver)
- distilled water
- hydrogen peroxide (H2O2) solution (3%)
Hypothesis
State a hypothesis concerning the relative abilities of the various tissue types to catalyze the conversion of hydrogen peroxide to water and oxygen.
Procedure
- Label tubes 1 – 5. Use a wax pencil to draw a line 1 cm from the bottom of
each tube. Draw an additional line at the 2 cm mark - Add the appropriate extract to each tube to the level of the 1 cm line.
- Add H2O2 to the 2 cm line in each tube. Do not contaminate the dropper. If extract comes into contact with the dropper, discard the dropper.
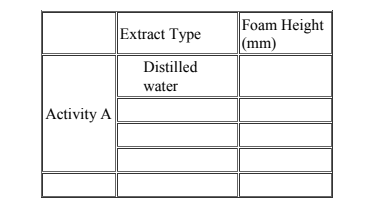
- Measure the height of the foam (in millimeters) and record the data.
- Wash the test-tubes. Rinse well with water and drain.
Results
Prepare a bar graph of catalase activity. Include labels.
Analysis
- Did the results of the experiment support the hypothesis? Explain.
- Write the reaction. Use molecular formulas. Identify substrate, enzyme and products.
- What type of gas is released in the bubbles?
- What happens to catalase itself in the reaction – is it used up? destroyed? unchanged?
- The experimental variable (independent variable) is the aspect that varies between the experimental groups. What is the experimental variable in this experiment?
- Controlled variables are those conditions that are kept constant between experimental groups. The controlled variables insure that only one experimental variable is tested per experiment. What are 3 controlled variables in this experiment?
- The dependent variable changes in response to the experimental variable. The dependent variable is what is physically measured to assess the experimental outcome. What is the dependent variable in this experiment?
The effect of temperature on the activity of catalase
Materials
- 3 clean test-tubes
- hydrogen peroxide solution
- wax pencil
- extract of liver or yeast
- millimeter ruler
- crushed ice
- water bath at 70oC
- thermometer
Hypothesis
State a hypothesis concerning the relative action of catalase at various temperatures. Refer to section 6.1
Procedure
- Label tubes 1- 3. Use a wax pencil to draw a line 1cm from the bottom of each tube. Draw another line at the 2 cm mark.
- Add extract to the 1 cm line. Note that extract type is a controlled variable in this experiment. Do not add hydrogen peroxide until AFTER step 3.
- Incubate the tubes at the following temperatures for 5 minutes
Tube 1 on ice (record the temperature of the ice)
Tube 2 at room temperature (record the temperature)
Tube 3 at 70oC - After 5 minutes, return the tubes to the lab bench. Add H2O2 (hydrogen peroxide) to the 2 cm line. Use ice-cold H2O2 for the tube on ice.
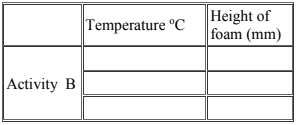
- Measure the height of the foam on each tube. Record.
- Wash the test-tubes with water and drain to remove the excess water
Results
Prepare a line graph of catalase activity as influenced by temperature.
Analysis
- Explain the results shown in the line graph. Did the results support the hypothesis?
- Identify the experimental variable in the experiment.
- List 2 controlled variables in the experiment.
- What is the dependent variable in the experiment?