7.1: Infectious Disease Protocol
- Page ID
- 25233
The Spread of an Infectious Disease
An infectious disease is any disease caused by germs that can be spread from one person to another. Germs include viruses, bacteria, and protozoa. What are some infectious diseases?
This activity will simulate the spread of an infectious disease. A simulation is a simplified demonstration of a real biological process. Our simulation will show how an infectious disease can spread from one infected person to other people who, in turn, infect others.
Instructions
1. Your teacher will give everyone a cup filled with a clear solution. This solution represents your body. Only one person in the class will have a cup that has been “infected”. Obviously, you should not drink from the cup. In laboratory activities, you should never drink or eat anything unless your teacher tells you that it is safe to do so.
2. In this part of the activity, you will interact with two other students. To interact with another student, pour all of your solution into your partner’s cup. Then have your partner pour all of the mixed solution back into your empty cup. Finally, pour half of the mixed solution back into your partner’s empty cup. Wait for the signal from your teacher and then move to another part of the classroom and interact with a second student. After you have finished your second interaction, return to your seat.
Estimate how many people you think will be infected. ________
3. Your teacher will come around and put an “infection indicator” in your cup. If you have exchanged solutions with the original infected person or someone else after they became infected, you are now infected and your solution will turn pink. If you have not exchanged solutions with anyone who was infected, your solution will not turn color.
Next, your teacher will ask everyone who is infected to raise their hand.
How many people were infected? ________
4. You will do another set of interactions, again beginning with only one student with an infected cup. This time there will be three rounds of interactions. For each interaction, be sure to move to a different part of the room with different students.
Estimate how many people you think will be infected after each student has interacted with three other students. ________
After the teacher has come around with the indicator, write down how many people were actually infected. ________
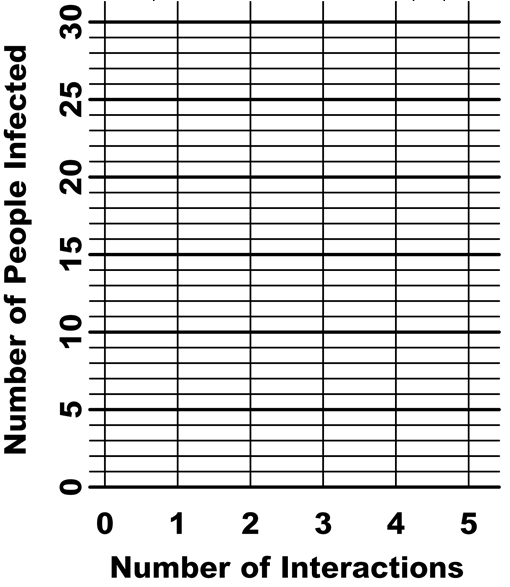
5. Now you will graph how an infection spreads to infect more and more people after each interaction.

First, plot a point to indicate that one person was infected before any interactions.
How many people would be infected after just one interaction? ________
Add this point to your graph.
Next, plot the number of people who were infected after two interactions (from 3 on page 1) and the number of people who were infected after three interactions (from 4 on page 1).
Discussion Questions
6. How many people developed a new infection as a result of the first round of interactions? _____
How many people developed a new infection as a result of the second round of interactions? _____
How many people developed a new infection as a result of the third round of interactions? _____
Which round of interactions resulted in the biggest increase in the number of infected people?_____
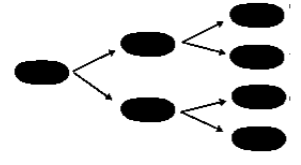
In each round of interactions, each infected person can infect one new person. Therefore an interaction that begins with more infected people will generally result in more new infections.
7. How many people do you think would be infected if your class had four interactions? _____
Explain your reasoning.
How many people do you think would be infected if your class had five interactions? _____
Plot these points on the graph, using the symbol P to indicate that these are predicted points.
8. In our simulation, the infectious disease spread very rapidly. Multiple people were infected within a few minutes. In real life, infections do not spread this rapidly. What are some reasons that the spread of infections is slower in real life?
Population Growth
There are some interesting similarities between the spread of infectious disease in our simulation and population growth, e.g. the increase in the number of bacteria, plants, or animals in a population. For example, suppose that a single bacterium is placed in a container of broth that has plenty of food for bacterial growth, so every 30 minutes each bacterium divides into two bacteria. This results in a doubling of the number of bacteria every 30 minutes, which is similar to the doubling in the number of infected people after the first and second rounds of interactions in the spread of infectious disease simulation.

9. If a single bacterium is placed in a container of broth and the number of bacteria in the population doubles every 30 minutes, how long do you think it would take before there would be 1000 bacteria?
10. To calculate how long it would actually take for the single bacterium to multiply to form a population of 1000 bacteria, fill in the number of bacteria at each time in the table.
|
1 |
Bacterium at the beginning |
|
Bacteria after 30 minutes |
|
|
Bacteria after 1 hour |
|
|
Bacteria after 1 hour and 30 minutes |
|
|
Bacteria after 2 hours |
|
|
Bacteria after 2 hours and 30 minutes |
|
|
Bacteria after 3 hours |
|
|
Bacteria after 3 hours and 30 minutes |
|
|
Bacteria after 4 hours |
|
|
Bacteria after 4 hours and 30 minutes |
|
|
Bacteria after 5 hours |
11. How long would it take for the population of bacteria to increase from 1 bacterium to 500 bacteria?
How long would it take for the population of bacteria to increase from 500 bacteria to 1000 bacteria?
Notice that, when a population doubles every 30 minutes, the number of bacteria in the population increases faster and faster as the population gets larger. This kind of population growth is called exponential growth.
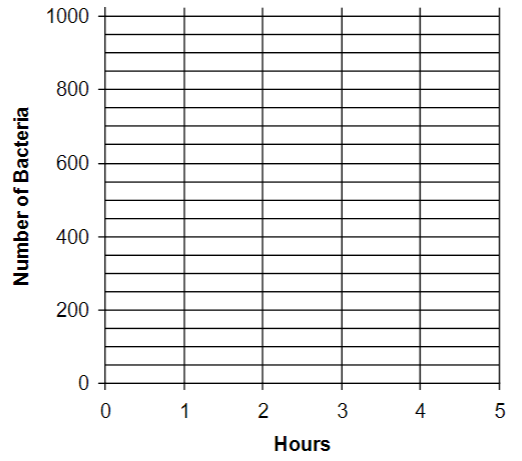
12. To see what exponential growth looks like in a graph, use the data from the table on the previous page to plot the number of bacteria at each time in this graph.

13. Why does the slope of this exponential growth curve get much steeper in the fourth and fifth hours of population growth?
If exponential growth continued for 10 hours, the original single bacterium would increase to a population of over one million bacteria. This illustrates how exponential growth can result in a very rapid increase in population size.
14. In the real world, no population of bacteria or any other biological organism can keep increasing exponentially forever. Why not?
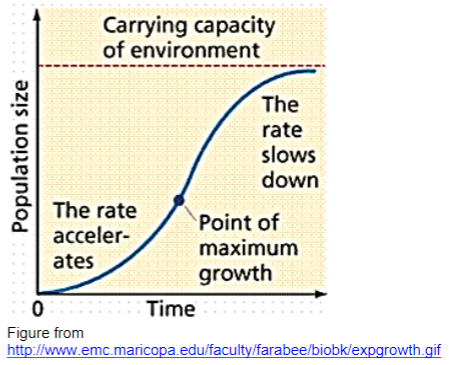
All organisms require resources such as water and nutrients to grow and reproduce. The environment where a population is growing has only a limited amount of resources. As the population gets larger, there will not be enough resources to support the continued rapid growth of the population. The rate of growth of the population will slow down, and, finally, the population will reach a maximum size which is called the carrying capacity of the environment. This type of logistic growth curve is illustrated in the figure.

15. Which characteristic of the logistic growth curve could be caused by increasing competition for food as population size increases? Use an arrow to indicate this characteristic.
16. Which part of the logistic growth curve looks like exponential growth? Circle this in the figure.

